标签:参考 for 隐藏 page splay 程序 查看 mount box
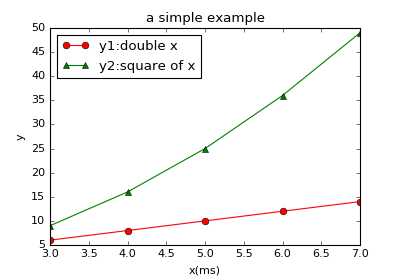
 1 import matplotlib.pyplot as plt
 2 import numpy as np
 3
 4 x = np.arange(3,8,1)    #x轴数据
 5 y1 = x*2
 6 y2 = x**2
 7 plt.figure(figsize=(5,3.5))
 8 plt.plot(x, y1,‘r‘,marker=‘o‘,label=‘y1:double x‘)  #关键句,前两个参数是X、Y轴数据,其他参数指定曲线属性,如标签label,颜色color,线宽linewidth或lw,点标记marker
 9 plt.plot(x,y2,‘g‘,marker=‘^‘,label=‘y2:square of x‘)
10 plt.legend(loc=‘best‘)  #显示图例,前提是plot参数里写上label;loc是图例的位置
11 plt.xlabel(‘x(ms)‘)
12 plt.ylabel(‘y‘)
13 plt.title(‘a simple example‘)
14 #plt.savefig(‘G:/YDPIC/example.png‘,dpi=80)  #除了png,还有一些格式如svg,dpi是dot per inch每英寸的像素点数,缺省值80,论文写作一般要求1200或者矢量图
15 plt.show()  #show函数显示图表会中断程序,直到关闭图像。不要把show写在savefig前,否则保存图像一片空白。最好是注释掉savefig或者show其中一行。
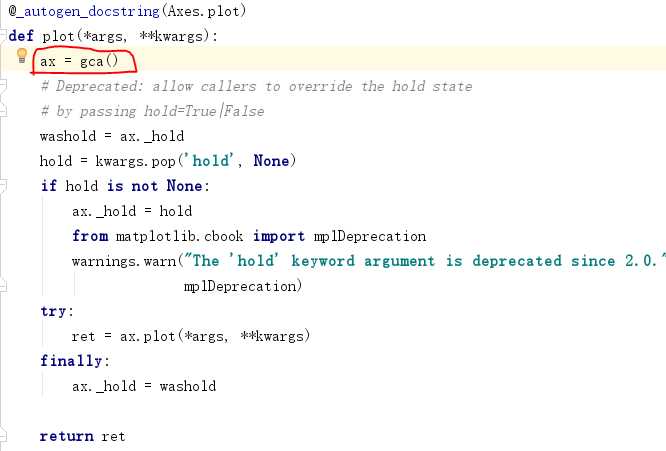
matplotlib官网对plot的说明
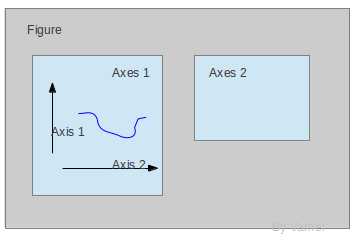
Figure对象,是一个“画布或者容器” 的东西。如果用户没有写plt.figure(),程序会自动创建一个Figure对象(图像窗口)。 Axes是子图,一个figure上可以有多个子图,是具体作图的区域。 Axis是坐标轴。关系如下图。
在"一、简单示例"的代码中,plt帮我们隐藏了创建对象的过程,使用起来简单,能满足大部分作图的需求。查看plt.plot的源码发现ax = gca() 意思是get current axes获取当前子图,然后作图都是调用的"ax"对象的方法。 当需要在一个figure上画多子图的时候,面向对象方式绘图很好用。
给出几个例子
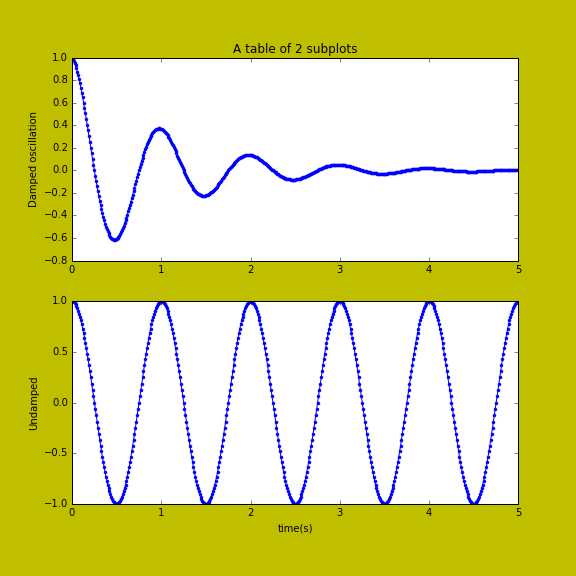
绘制多子图subplot
 1 import numpy as np
 2 import matplotlib.pyplot as plt
 3
 4 x = np.arange(0,5,0.01)
 5 y1 = np.cos( 2*np.pi*x )*np.exp(-x)
 6 y2 = np.cos( 2*np.pi*x )
 7
 8 fig = plt.figure(facecolor=‘y‘)
 9
10 ax1 = fig.add_subplot(211)  #2行1列第1幅图
11 ax1.plot(x, y1, ‘.-‘)
12 ax1.set_title(‘A table of 2 subplots‘)
13 ax1.set_ylabel(‘Damped oscillation‘)
14
15 ax2 = fig.add_subplot(212)  #2行1列第2幅图
16 ax2.plot(x,y2, ‘.-‘ )
17 ax2.set_xlabel(‘time(s)‘)
18 ax2.set_ylabel(‘Undamped‘)
19
20 plt.show()
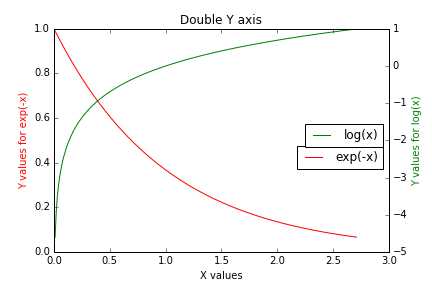
双Y轴 ax2 = ax1.twinx()

import matplotlib.pyplot as plt
import numpy as np

x = np.arange(0.01,np.e, 0.01)
y1 = np.exp(-x)
y2 = np.log(x)

fig = plt.figure()

ax1 = fig.add_subplot(111)
ax1.plot(x, y1,‘r‘,label=‘exp(-x)‘)
ax1.legend(bbox_to_anchor=(1,0.5))
ax1.set_ylabel(‘Y values for exp(-x)‘,color=‘r‘)
ax1.set_xlabel(‘X values‘)
ax1.set_title(‘Double Y axis‘)

ax2 = ax1.twinx()
ax2.plot(x,y2,‘g‘,label=‘log(x)‘)
ax2.legend(bbox_to_anchor=(1,0.6))
ax2.set_ylabel(‘Y values for log(x)‘,color=‘g‘)

plt.show()
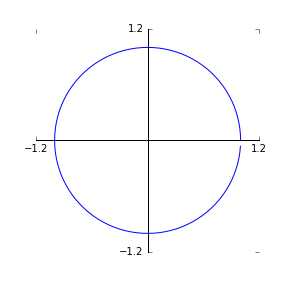
移动坐标轴spines
 1 import matplotlib.pyplot as plt
 2 import numpy as np
 3
 4 fig = plt.figure(figsize=(4,4))
 5 ax = fig.add_subplot(111)
 6 theta = np.arange(0, 2*np.pi, 2*np.pi/100)
 7 x = np.cos(theta)
 8 y = np.sin(theta)
 9 ax.plot(x,y)
10 # top和right颜色置为none从而看不见
11 ax.spines[‘top‘].set_color(‘none‘)
12 ax.spines[‘right‘].set_color(‘none‘)
13 # spines的set_position函数,移动坐标轴位置
14 ax.spines[‘bottom‘].set_position((‘data‘,0))
15 ax.spines[‘left‘].set_position((‘data‘,0))
16
17 ax.xaxis.set_ticks([-1.2,1.2])
18 ax.yaxis.set_ticks([-1.2,1.2])
19 plt.show()
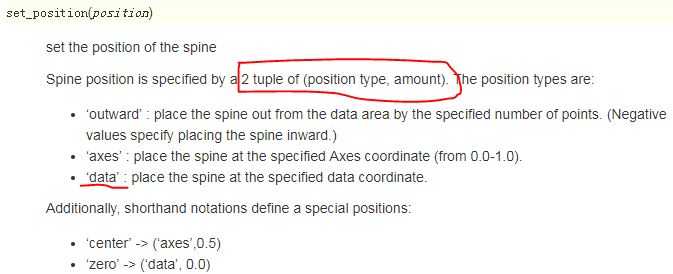
set_postion()函数 接收的参数是一个二元组tuple (postion type, amount) position type的取值可以有:‘outward‘, ‘axes‘,‘data‘三种。本例中选择了‘‘data‘ amount取的0 就是数据坐标为0的位置。官网的解释如下:
参考博客:
https://morvanzhou.github.io/tutorials/data-manipulation/plt/4-2-subplot2/
http://hyry.dip.jp/tech/book/page/scipy/matplotlib_fast_plot.html
标签:参考 for 隐藏 page splay 程序 查看 mount box
原文地址:http://www.cnblogs.com/min2day/p/7840458.html
