V-rep中显示激光扫描点
在VREP自带的场景中找到practicalPathPlanningDemo.ttt文件,删除场景中多余的物体只保留静态的地图。然后在Model browser→components→sensors中找到SICK TiM310 Fast激光雷达,拖入场景中:
打开脚本参数修改器,可以修改雷达扫描范围(默认为270°),是否显示雷达扫描线(true),以及最大探测距离(默认为4m)这三个参数。地图大小为5m×5m,我们将雷达最大探测距离改为2m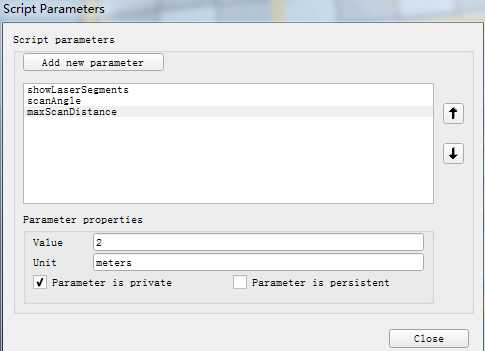
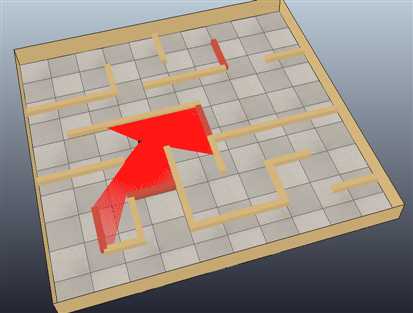
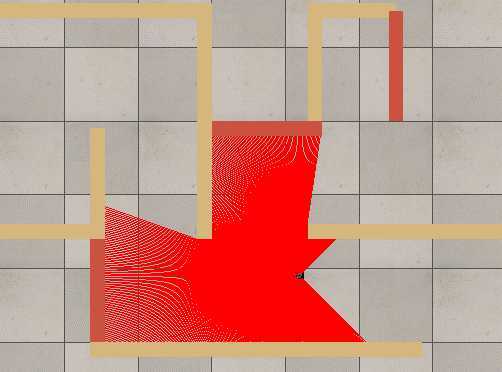
将激光雷达放到地图中任意位置,点击仿真按钮可以看到扫描光线(如果电脑比较卡可以将showLaserSegments这个参数设为false,就不会显示扫描线)如下图所示:
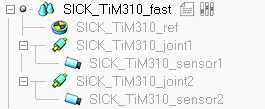
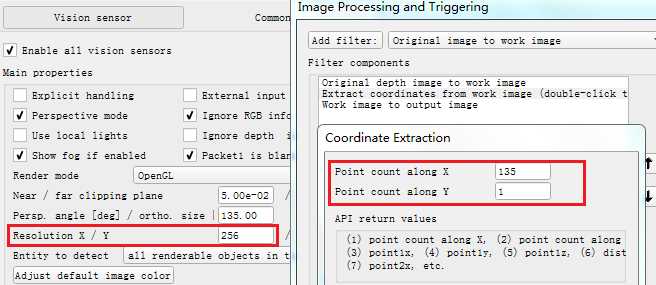
SICK_TiM310激光雷达在V-rep中是由两个视角为135°的视觉传感器模拟的,这两个视觉传感器可以探测深度信息:
双击视觉传感器图标,修改Filter中Coordinate Extraction的参数与传感器X/Y方向分辨率一致。X方向默认值为135,即会返回135个数据点,这里要改为256。
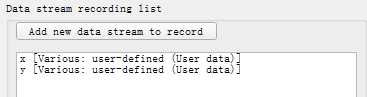
我们可以在V-rep中绘制出激光扫描图:在场景中添加一个Graph,将其设为显示处理(Explicit handling),然后添加用户自定义数据x和y:
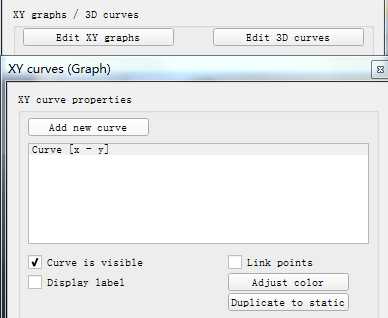
然后点击Edit XY graphs按钮,在弹出的对话框中添加一个新的曲线。X-value选择我们之前自定义的数据x,Y-value选择自定义的数据y,并去掉Link points选项:
将SICK_TiM310_fast的lua脚本代码修改如下:


if (sim_call_type==sim_childscriptcall_initialization) then
    visionSensor1Handle=simGetObjectHandle("SICK_TiM310_sensor1")
    visionSensor2Handle=simGetObjectHandle("SICK_TiM310_sensor2")
    joint1Handle=simGetObjectHandle("SICK_TiM310_joint1")
    joint2Handle=simGetObjectHandle("SICK_TiM310_joint2")
    sensorRefHandle=simGetObjectHandle("SICK_TiM310_ref")
    graphHandle = simGetObjectHandle("Graph")

    maxScanDistance=simGetScriptSimulationParameter(sim_handle_self,‘maxScanDistance‘)
    if maxScanDistance>1000 then maxScanDistance=1000 end
    if maxScanDistance<0.1 then maxScanDistance=0.1 end
    simSetObjectFloatParameter(visionSensor1Handle,sim_visionfloatparam_far_clipping,maxScanDistance)
    simSetObjectFloatParameter(visionSensor2Handle,sim_visionfloatparam_far_clipping,maxScanDistance)
    maxScanDistance_=maxScanDistance*0.9999

    scanningAngle=simGetScriptSimulationParameter(sim_handle_self,‘scanAngle‘)
    if scanningAngle>270 then scanningAngle=270 end
    if scanningAngle<2 then scanningAngle=2 end
    scanningAngle=scanningAngle*math.pi/180
    simSetObjectFloatParameter(visionSensor1Handle,sim_visionfloatparam_perspective_angle,scanningAngle/2)
    simSetObjectFloatParameter(visionSensor2Handle,sim_visionfloatparam_perspective_angle,scanningAngle/2)

    simSetJointPosition(joint1Handle,-scanningAngle/4)
    simSetJointPosition(joint2Handle,scanningAngle/4)
    red={1,0,0}
    lines=simAddDrawingObject(sim_drawing_lines,1,0,-1,1000,nil,nil,nil,red)

    if (simGetInt32Parameter(sim_intparam_program_version)<30004) then
        simDisplayDialog("ERROR","This version of the SICK sensor is only supported from V-REP V3.0.4 and upwards.&&nMake sure to update your V-REP.",sim_dlgstyle_ok,false,nil,{0.8,0,0,0,0,0},{0.5,0,0,1,1,1})
    end
end


if (sim_call_type==sim_childscriptcall_cleanup) then
    simRemoveDrawingObject(lines)
    simResetGraph(graphHandle)
end


if (sim_call_type==sim_childscriptcall_sensing) then
    measuredData={}

    if notFirstHere then
        -- We skip the very first reading
        simAddDrawingObjectItem(lines,nil)
        showLines=simGetScriptSimulationParameter(sim_handle_self,‘showLaserSegments‘)
        r,t1,u1=simReadVisionSensor(visionSensor1Handle)
        r,t2,u2=simReadVisionSensor(visionSensor2Handle)

        m1=simGetObjectMatrix(visionSensor1Handle,-1)
        m01=simGetInvertedMatrix(simGetObjectMatrix(sensorRefHandle,-1))
        m01=simMultiplyMatrices(m01,m1)
        m2=simGetObjectMatrix(visionSensor2Handle,-1)
        m02=simGetInvertedMatrix(simGetObjectMatrix(sensorRefHandle,-1))
        m02=simMultiplyMatrices(m02,m2)
        if u1 then
            p={0,0,0}
            p=simMultiplyVector(m1,p)
            t={p[1],p[2],p[3],0,0,0}
            for j=0,u1[2]-1,1 do
                for i=0,u1[1]-1,1 do
                    w=2+4*(j*u1[1]+i)
                    v1=u1[w+1]
                    v2=u1[w+2]
                    v3=u1[w+3]
                    v4=u1[w+4]
                    if (v4<maxScanDistance_) then
                        p={v1,v2,v3}
                        p=simMultiplyVector(m01,p)
                        table.insert(measuredData,p[1])
                        table.insert(measuredData,p[2])
                        table.insert(measuredData,p[3])
                    end
                    if showLines then
                        p={v1,v2,v3}
                        p=simMultiplyVector(m1,p)
                        t[4]=p[1]
                        t[5]=p[2]
                        t[6]=p[3]
                        simAddDrawingObjectItem(lines,t)
                    end
                end
            end
        end
        if u2 then
            p={0,0,0}
            p=simMultiplyVector(m2,p)
            t={p[1],p[2],p[3],0,0,0}
            for j=0,u2[2]-1,1 do
                for i=0,u2[1]-1,1 do
                    w=2+4*(j*u2[1]+i)
                    v1=u2[w+1]
                    v2=u2[w+2]
                    v3=u2[w+3]
                    v4=u2[w+4]
                    if (v4<maxScanDistance_) then
                        p={v1,v2,v3}
                        p=simMultiplyVector(m02,p)
                        table.insert(measuredData,p[1])
                        table.insert(measuredData,p[2])
                        table.insert(measuredData,p[3])
                    end
                    if showLines then
                        p={v1,v2,v3}
                        p=simMultiplyVector(m2,p)
                        t[4]=p[1]
                        t[5]=p[2]
                        t[6]=p[3]
                        simAddDrawingObjectItem(lines,t)
                    end
                end
            end
        end
    end
    notFirstHere=true

    --stringData = simPackFloatTable(measuredData) -- Packs a table of floating-point numbers into a string
    --simSetStringSignal("UserData", stringData)

    simResetGraph(graphHandle)
    for i=1,#measuredData/3,1 do
        simSetGraphUserData(graphHandle,‘x‘,measuredData[3*(i-1)+1])
        simSetGraphUserData(graphHandle,‘y‘,measuredData[3*(i-1)+2])
        simHandleGraph(graphHandle,0)
    end

end
点击仿真按钮,可以在X/Y graph窗口中看到激光扫描结果如下:
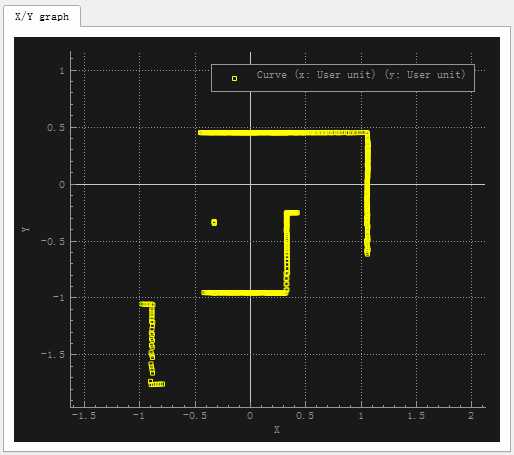
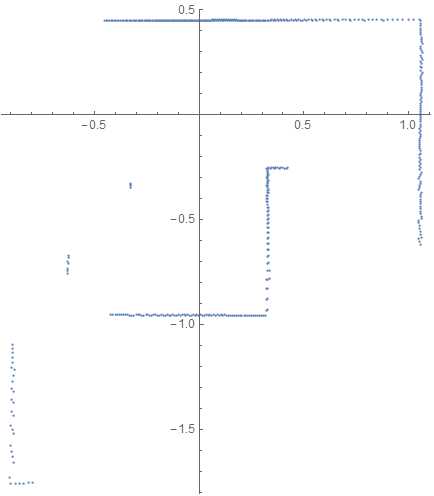
V-rep中的视觉传感器可以探测到障碍物的坐标以及与其距离,上面的X-Y图就是直接采用坐标点画出的。然而一般激光雷达只能探测障碍物距离,不能直接获取其坐标,我们可以将距离画成与角度对应的极坐标图。将距离数据保存为CSV文件,用Mathematica读入并画出极坐标图:
ranges = Flatten[Import["C:\\Users\\Administrator\\Desktop\\distance.csv"]];
ListPolarPlot[ranges, DataRange -> {-135 Degree, 135 Degree}]
发布LaserScan消息
下面的代码将激光雷达扫描数据按照LaserScan的消息格式发布出去:
if (sim_call_type==sim_childscriptcall_initialization) then
    visionSensor1Handle=simGetObjectHandle("SICK_TiM310_sensor1")
    visionSensor2Handle=simGetObjectHandle("SICK_TiM310_sensor2")
    joint1Handle=simGetObjectHandle("SICK_TiM310_joint1")
    joint2Handle=simGetObjectHandle("SICK_TiM310_joint2")
    sensorRefHandle=simGetObjectHandle("SICK_TiM310_ref")

    maxScanDistance=simGetScriptSimulationParameter(sim_handle_self,‘maxScanDistance‘)
    if maxScanDistance>1000 then maxScanDistance=1000 end
    if maxScanDistance<0.1 then maxScanDistance=0.1 end
    simSetObjectFloatParameter(visionSensor1Handle,sim_visionfloatparam_far_clipping,maxScanDistance)
    simSetObjectFloatParameter(visionSensor2Handle,sim_visionfloatparam_far_clipping,maxScanDistance)
    maxScanDistance_=maxScanDistance*0.9999

    scanningAngle=simGetScriptSimulationParameter(sim_handle_self,‘scanAngle‘)
    if scanningAngle>270 then scanningAngle=270 end
    if scanningAngle<2 then scanningAngle=2 end
    scanningAngle=scanningAngle*math.pi/180
    simSetObjectFloatParameter(visionSensor1Handle,sim_visionfloatparam_perspective_angle,scanningAngle/2)
    simSetObjectFloatParameter(visionSensor2Handle,sim_visionfloatparam_perspective_angle,scanningAngle/2)

    simSetJointPosition(joint1Handle,-scanningAngle/4)
    simSetJointPosition(joint2Handle,scanningAngle/4)
    red={1,0,0}
    lines=simAddDrawingObject(sim_drawing_lines,1,0,-1,1000,nil,nil,nil,red)

    if (simGetInt32Parameter(sim_intparam_program_version)<30004) then
        simDisplayDialog("ERROR","This version of the SICK sensor is only supported from V-REP V3.0.4 and upwards.&&nMake sure to update your V-REP.",sim_dlgstyle_ok,false,nil,{0.8,0,0,0,0,0},{0.5,0,0,1,1,1})
    end

    -- Enable an LaserScan publisher:
    pub = simExtRosInterface_advertise(‘/scan‘, ‘sensor_msgs/LaserScan‘)
    --After calling this function, this publisher will treat uint8 arrays as string. Using strings should be in general much faster that using int arrays in Lua.
    simExtRosInterface_publisherTreatUInt8ArrayAsString(pub) -- treat uint8 arrays as strings (much faster, tables/arrays are kind of slow in Lua)

    angle_min= -135 * (math.pi/180);        -- angle correspond to FIRST beam in scan ( in rad)
    angle_max= 135 * (math.pi/180)          -- angle correspond to LAST beam in scan ( in rad)
    angle_increment = 270*(math.pi/180)/512 -- Angular resolution i.e angle between 2 beams

    -- sensor scans every 50ms with 512 beams. Each beam is measured in  (50 ms/ 512 )
    time_increment  = (1 / 20) / 512

    range_min = 0.05
    range_max = maxScanDistance -- scan can measure upto this range
end

if (sim_call_type==sim_childscriptcall_cleanup) then
    simRemoveDrawingObject(lines)
    simExtRosInterface_shutdownPublisher(pub)
end

if (sim_call_type==sim_childscriptcall_sensing) then
    measuredData={}
    distanceData={}

    if notFirstHere then
        -- We skip the very first reading
        simAddDrawingObjectItem(lines,nil)
        showLines=simGetScriptSimulationParameter(sim_handle_self,‘showLaserSegments‘)
        r,t1,u1=simReadVisionSensor(visionSensor1Handle)
        r,t2,u2=simReadVisionSensor(visionSensor2Handle)

        m1=simGetObjectMatrix(visionSensor1Handle,-1)
        m01=simGetInvertedMatrix(simGetObjectMatrix(sensorRefHandle,-1))
        m01=simMultiplyMatrices(m01,m1)
        m2=simGetObjectMatrix(visionSensor2Handle,-1)
        m02=simGetInvertedMatrix(simGetObjectMatrix(sensorRefHandle,-1))
        m02=simMultiplyMatrices(m02,m2)
        if u1 then
            p={0,0,0}
            p=simMultiplyVector(m1,p)
            t={p[1],p[2],p[3],0,0,0}
            for j=0,u1[2]-1,1 do
                for i=0,u1[1]-1,1 do
                    w=2+4*(j*u1[1]+i)
                    v1=u1[w+1]
                    v2=u1[w+2]
                    v3=u1[w+3]
                    v4=u1[w+4]
                    table.insert(distanceData,v4)
                    if (v4<maxScanDistance_) then
                        p={v1,v2,v3}
                        p=simMultiplyVector(m01,p)
                        table.insert(measuredData,p[1])
                        table.insert(measuredData,p[2])
                        table.insert(measuredData,p[3])
                    end
                    if showLines then
                        p={v1,v2,v3}
                        p=simMultiplyVector(m1,p)
                        t[4]=p[1]
                        t[5]=p[2]
                        t[6]=p[3]
                        simAddDrawingObjectItem(lines,t)
                    end
                end
            end
        end
        if u2 then
            p={0,0,0}
            p=simMultiplyVector(m2,p)
            t={p[1],p[2],p[3],0,0,0}
            for j=0,u2[2]-1,1 do
                for i=0,u2[1]-1,1 do
                    w=2+4*(j*u2[1]+i)
                    v1=u2[w+1]
                    v2=u2[w+2]
                    v3=u2[w+3]
                    v4=u2[w+4]
                    table.insert(distanceData,v4)
                    if (v4<maxScanDistance_) then
                        p={v1,v2,v3}
                        p=simMultiplyVector(m02,p)
                        table.insert(measuredData,p[1])
                        table.insert(measuredData,p[2])
                        table.insert(measuredData,p[3])
                    end
                    if showLines then
                        p={v1,v2,v3}
                        p=simMultiplyVector(m2,p)
                        t[4]=p[1]
                        t[5]=p[2]
                        t[6]=p[3]
                        simAddDrawingObjectItem(lines,t)
                    end
                end
            end
        end
    end
    notFirstHere=true

    -- populate the LaserScan message
    scan={}
    scan[‘header‘]={seq=0,stamp=simExtRosInterface_getTime(), frame_id="SICK_TiM310_ref"}
    scan[‘angle_min‘]=angle_min
    scan[‘angle_max‘]=angle_max
    scan[‘angle_increment‘]=angle_increment
    scan[‘time_increment‘]=time_increment
    scan[‘scan_time‘]=simExtRosInterface_getTime() -- Return the current ROS time i.e. the time returned by ros::Time::now()
    scan[‘range_min‘]=range_min
    scan[‘range_max‘]=range_max
    scan[‘ranges‘] = distanceData
    scan[‘intensities‘]={}

    simExtRosInterface_publish(pub, scan)
end
注意代码中发布的距离是相对于视觉传感器坐标系的,因为模型中视觉传感器坐标系与激光雷达坐标系(SICK_TiM310_ref)在X、Y方向的位置是一致的,而Z坐标只存在一点高度差异,并不会影响X-Y平面内障碍物相对于SICK_TiM310_ref参考坐标系的位置坐标。如果这两个坐标系在X、Y方向存在偏差,就需要将采集到的数据点转换到SICK_TiM310_ref坐标系中。
另外代码中变量v4为激光雷达探测到的距物体的距离,如果在最大扫描范围内没有探测到物体,则会返回最大值。由于这个距离与扫描角度是一一对应的,因此要注意table.insert函数的使用,不能放在下一句的if语句之中,否则在超过最大扫描范围的地方不会向列表内插入距离数据,这样会造成距离与角度不匹配,可能导致激光图像出现歪斜。
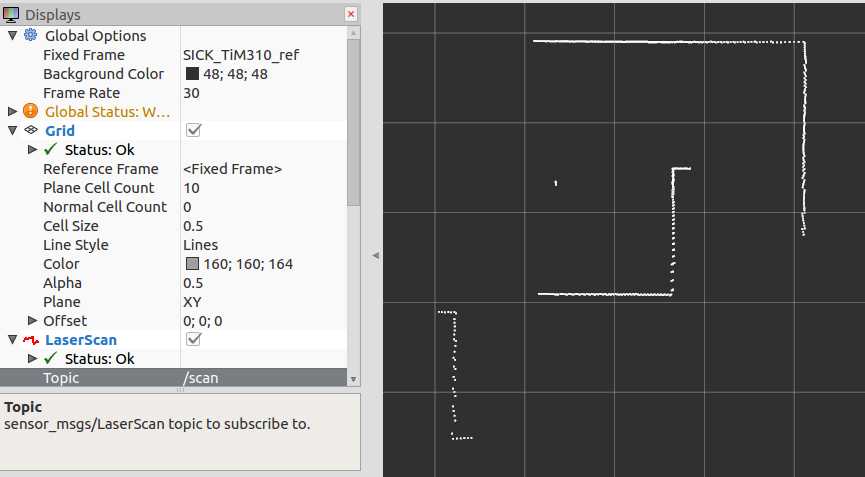
点击仿真按钮,程序运行没问题后在rviz中可以添加LaserScan进行查看:
输入rostopic hz /scan可以查看消息发布的频率:
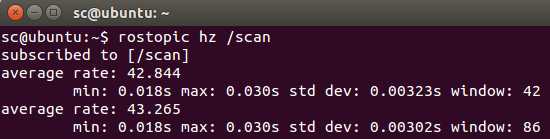
这里有一个小问题,从上图可以看出激光雷达信息发布的频率约为43Hz,但是V-rep仿真的时间步长为50ms,消息发布的频率应该为20Hz。这是因为V-rep中默认情况下仿真并不是以实际时间在运行,在工具栏上点击real-time mode按钮,开始实时模式:

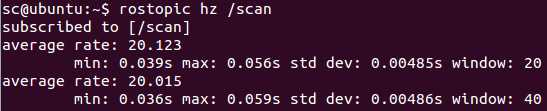
现在再查看消息发布的频率,可以看到频率和我们设定的一样了:
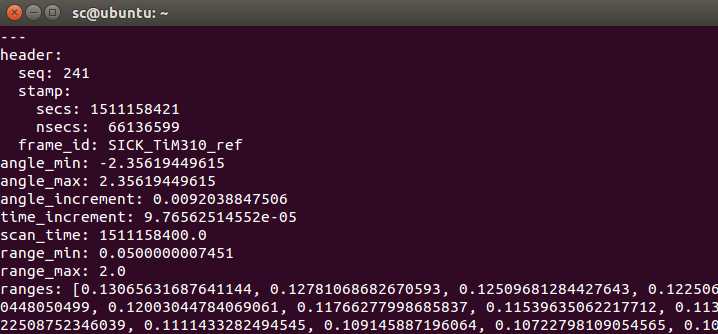
另外,通过rostopic echo /scan命令可以查看消息的具体内容(方便我们检查出可能存在的错误:我在虚拟机下运行得到的数据很奇怪,但是换到实体系统上就没有问题):
发布nav_msgs/Odometry里程计信息及tf变换
在V-rep中进行地图构建仿真时可以用键盘控制机器人的位置(这里直接简化为控制激光雷达),那么机器人相对于初始时刻odom坐标系的位置和姿态等信息可以通过航迹推算(使用里程计或惯性传感器根据机器人运动学模型计算)获得。然后需要将其按照nav_msgs/Odometry消息的格式包装好,发布到/odom话题上;并且还要发布机器人坐标系base_link相对于odom坐标系的tf变换。The nav_msgs/Odometry message stores an estimate of the position and velocity of a robot in free space. The "tf" software library is responsible for managing the relationships between coordinate frames relevant to the robot in a transform tree. Therefore, any odometry source must publish information about the coordinate frame that it manages.
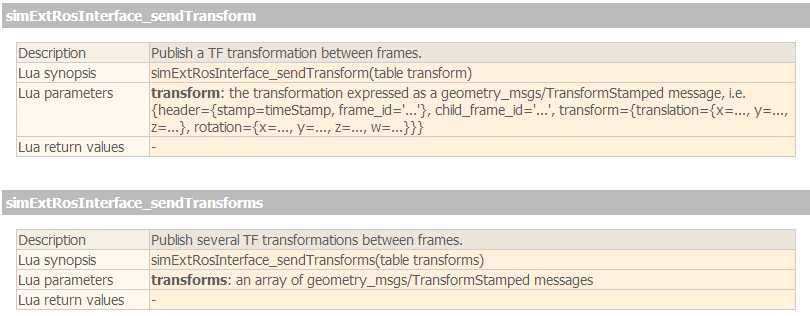
V-rep脚本中发布tf变换主要用下面这两个函数,区别在于simExtRosInterface_sendTransform调用一次只能发送一对变换,而simExtRosInterface_sendTransforms则可以一次发送多对变换,函数参数是变换的列表:
根据V-rep中物体的句柄和名称发布坐标系变换的代码如下:
function getTransformStamped(objHandle, name, relTo, relToName)
  -- This function retrieves the stamped transform for a specific object
  t = simExtRosInterface_getTime()
  p = simGetObjectPosition(objHandle, relTo)
  o = simGetObjectQuaternion(objHandle, relTo)
  return {
      header = {stamp=t, frame_id=relToName},
      child_frame_id = name,
      transform = {
        translation={x=p[1],y=p[2],z=p[3]},
        rotation={x=o[1],y=o[2],z=o[3],w=o[4]}
              }
      }
end

----------------------------------------------------------------------------------------------------------------------
 simExtRosInterface_sendTransforms({getTransformStamped(sensorRefHandle,‘SICK_TiM310_ref‘,baseLinkHandle,‘base_link‘),
                                      getTransformStamped(baseLinkHandle,‘base_link‘,odomHandle,‘odom‘)})
--simExtRosInterface_sendTransform(getTransformStamped(sensorRefHandle,‘SICK_TiM310_ref‘,baseLinkHandle,‘base_link‘)
--simExtRosInterface_sendTransform(getTransformStamped(baseLinkHandle,‘base_link‘,odomHandle,‘odom‘))
我们在V-rep的脚本程序中向ros系统发布了坐标系之间的变换,有时可能会出现许多错误。为了方便排查错误,ros提供了一系列tf调试工具。下面两种命令都可以以图形化的方式查看坐标系之间的tf关系:
$ rosrun tf view_frames
$ rosrun rqt_tf_tree rqt_tf_tree
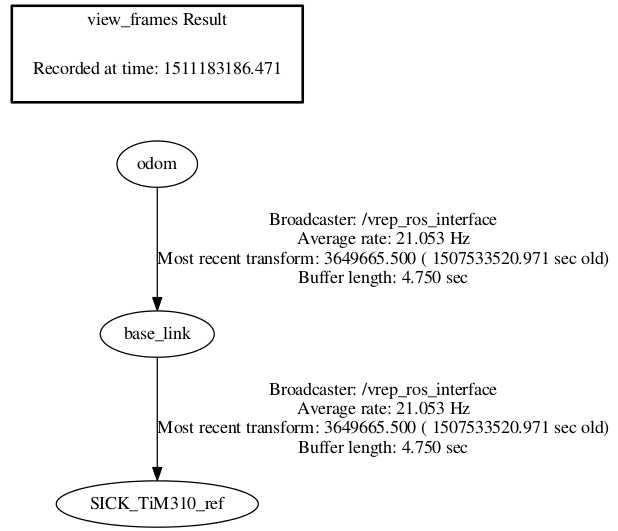
打开生成的pdf文件或在弹出的rqt窗口中,可以很清楚的看出里程计坐标系odom,机器人坐标系base_link,以及激光雷达坐标系SICK_TiM310_ref之间的关系:
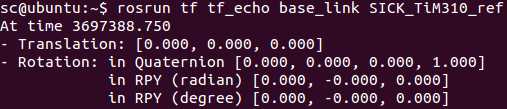
tf_echo命令可以用于查看两个坐标系之间具体的变换关系(注意输出的是target_frame相对于reference_frame的关系):
$ rosrun tf tf_echo reference_frame target_frame
如下图所示,会输出激光传感器坐标系SICK_TiM310_ref相对于机器人坐标系base_link的变换(V-rep模型中这两个坐标系是重合的):
在/odom话题上发布nav_msgs/Odometry消息的代码如下(注意这里直接调用函数获取到相对于odom的位置和姿态,省去了航迹推算的过程。如果在真实的小车上进行测试,就需要根据里程计数据来推算小车的位置和姿态等信息,然后再发送出去):
odomPub = simExtRosInterface_advertise(‘/odom‘, ‘nav_msgs/Odometry‘)

local pos = simGetObjectPosition(baseLinkHandle,  odomHandle)
local ori = simGetObjectQuaternion(baseLinkHandle, odomHandle)

odom = {}
odom.header = {seq=0,stamp=simExtRosInterface_getTime(), frame_id="odom"}
odom.child_frame_id = ‘base_link‘
odom.pose = { pose={position={x=pos[1],y=pos[2],z=pos[3]}, orientation={x=ori[1],y=ori[2],z=ori[3],w=ori[4]} } }

simExtRosInterface_publish(odomPub, odom)
使用gmapping构建地图
gmaping包是用来生成地图的,它需要从ROS系统监听多个Topic,并输出map。The slam_gmapping node takes in sensor_msgs/LaserScan messages and builds a map (nav_msgs/OccupancyGrid)
- Subscribed Topics:
- tf (tf/tfMessage):Transforms necessary to relate frames for laser, base, and odometry
- scan (sensor_msgs/LaserScan):Laser scans to create the map from
- Required tf Transforms:
- <the frame attached to incoming scans> → base_link:usually a fixed value, broadcast periodically by a robot_state_publisher, or a tf static_transform_publisher.
- base_link → odom:usually provided by the odometry system (e.g., the driver for the mobile base)
- Provided tf Transforms:
map → odom:the current estimate of the robot‘s pose within the map frame
使用记录下的tf以及laser scan data构建地图的步骤如下:
1. 键盘或手柄控制机器人在空间中运动时,使用rosbag记录激光及tf数据包,记录完成后按Ctrl+C键结束。
$ rosbag record -O my_scan_data /scan /tf
2. 设置参数,确保在任何节点使用前use_sim_time参数为true。我们重播一个记录历史文件时,里面记录的是历史时间,所以我们需要告诉ROS从现在起开始启用模拟时间。This basically tells nodes on startup to use simulated time (ticked here by rosbag) instead of wall-clock time (as in a live system). It avoids confusing time-dependent components like tf, which otherwise would wonder why messages are arriving with timestamps far in the past. 关于时钟问题可以参考http://wiki.ros.org/Clock.
Normally, the ROS client libraries will use your computer‘s system clock as a time source, also known as the "wall-clock" or "wall-time" (like the clock on the wall of your lab). When you are running a simulation or playing back logged data, however, it is often desirable to instead have the system use a simulated clock so that you can have accelerated, slowed, or stepped control over your system‘s perceived time. For example, if you are playing back sensor data into your system, you may wish to have your time correspond to the timestamps of the sensor data.
$ rosparam set use_sim_time true
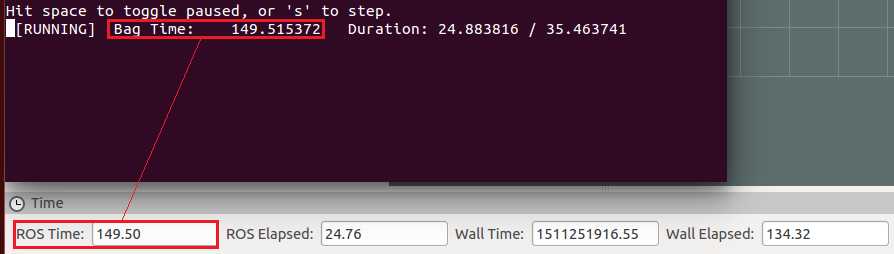
下图是use_sim_time参数为false时的情况:

设置use_sim_time为true,rosbag回放开始后ROS Time与Bag Time一致:
3. 运行slam_gmapping节点,它将在scan主题上监听激光扫描数据并创建地图(可以在命令行中设置建图参数:比如地图分辨率、粒子数目、迭代次数、地图更新间隔等参数)
$ rosrun gmapping slam_gmapping scan:=scan _xmin:=-2.5 _xmax:=2.5 _ymin:=-2.5 _ymax:=2.5 ...
比较重要的几个参数有:
- particles (int, default: 30) gmapping算法中的粒子数,因为gmapping使用的是粒子滤波算法,粒子在不断地迭代更新,所以选取一个合适的粒子数可以让算法在保证比较准确的同时有较高的速度。
- minimumScore (float, default: 0.0) 最小匹配得分,这个参数很重要,它决定了对激光的一个置信度,越高说明对激光匹配算法的要求越高,激光的匹配也越容易失败而转去使用里程计数据,而设的太低又会使地图中出现大量噪声,所以需要权衡调整。在V-rep仿真中里程计数据是直接通过函数获取的,没有误差,因此可以将这个值调高一点,让地图的匹配更多依赖里程计数据。
- lskip(int, default: 0)的值如果为0,则所有的激光数据帧都会用来进行scan matching,如果lskip的值大于0则会跳过几帧来进行scan matching。有时激光数据的噪声会比较大,对所有数据帧进行匹配的效果可能会不好,这时可以加大lskip的值。
xmin,xmax,ymin和ymax这4个参数设定了地图的初始尺寸,但并非最终尺寸(参考Gmapping does not correctly set up map size parameters )- ...
slam_gmapping节点用到的参数相当多,有很多参数需要在实际中测试多次来确定其值。如果参数太多在命令行中输入会不太方便,可以写成launch文件来运行:
<launch>
    <arg name="scan_topic"  default="scan" />              <!-- laser的topic名称,与自己的激光的topic相对应  -->
    <arg name="base_frame"  default="base_link"/>          <!-- 机器人基坐标系 -->
    <arg name="odom_frame"  default="odom"/>               <!-- 里程计坐标系 -->
    <arg name="map_frame"   default="map" />               <!-- 地图坐标系 -->

    <!-- 启动slam_gmapping节点 -->
    <node pkg="gmapping" type="slam_gmapping" name="slam_gmapping" output="screen" clear_params="true">   <!-- clear_params: Delete all parameters in the node‘s private namespace before launch -->

      <!-- Parameters used by gmapping wrapper -->
        <param name="base_frame" value="$(arg base_frame)"/>   <!-- The frame attached to the mobile base -->
        <param name="odom_frame" value="$(arg odom_frame)"/>   <!-- The frame attached to the odometry system -->
        <param name="map_frame"  value="$(arg map_frame)" />   <!-- The frame attached to the map -->
        <param name="map_update_interval" value="0.5"/>        <!-- 地图更新时间间隔 Lowering this number updates the occupancy grid more often, at the expense of greater computational load. -->
        <param name="throttle_scans" value="1"/>               <!-- throw away every nth laser scan. set it to a higher number to skip more scans -->

        <!-- Parameters used by gmapping itself -->
        <!-- Laser Parameters -->
        <param name="maxUrange" value="1.8"/>    <!-- maximum range of the laser scanner that is used for map building. set maxUrange < maximum range of the real sensor <= maxRange -->
        <param name="maxRange" value="2.0"/>     <!-- maximum range of the laser scans. Rays beyond this range get discarded completely -->
        <param name="sigma" value="0.05"/>       <!-- standard deviation for the scan matching process -->
        <param name="kernelSize" value="3"/>     <!-- search window for the scan matching process -->
        <param name="lstep" value="0.05"/>       <!-- The optimization step in translation 平移优化步长 -->
        <param name="astep" value="0.05"/>       <!-- The optimization step in rotation    旋转优化步长-->
        <param name="iterations" value="5"/>     <!-- number of refinement steps in the scan matching 扫描匹配迭代步数-->
        <param name="lsigma" value="0.075"/>     <!-- standard deviation for the scan matching process -->
        <param name="ogain" value="3.0"/>        <!-- gain for smoothing the likelihood -->
        <param name="lskip" value="5"/>          <!-- 0表示所有的激光都处理,如果计算压力过大可以将该值调大。 take only every (n+1)th laser ray for computing a match (0 = take all rays) -->
        <param name="minimumScore" value="80"/>  <!-- 判断scanmatch是否成功的阈值,过高的话会使scanmatch失败,从而影响地图更新速率 -->

        <!-- Motion Model Parameters (all standard deviations of a gaussian noise model). 运动模型的噪声参数 -->
        <param name="srr" value="0.01"/>  <!-- linear noise component (x and y) -->
        <param name="stt" value="0.02"/>  <!-- angular noise component (theta) -->
        <param name="srt" value="0.02"/>  <!-- linear -> angular noise component -->
        <param name="str" value="0.01"/>  <!-- angular -> linear noise component -->

        <!-- Initial map dimensions and resolution -->
        <param name="xmin" value="-2.5"/>   <!-- minimum x position in the map [m] -->
        <param name="xmax" value="2.5"/>    <!-- maximum x position in the map [m] -->
        <param name="ymin" value="-2.5"/>   <!-- minimum y position in the map [m] -->
        <param name="ymax" value="2.5"/>    <!-- maximum y position in the map [m] -->
        <param name="delta" value="0.05"/>  <!-- size of one pixel [m], 地图分辨率 -->

        <!-- Likelihood sampling (used in scan matching) -->
        <param name="llsamplerange" value="0.01"/>    <!-- linear range -->
        <param name="lasamplerange" value="0.005"/>   <!-- linear step size -->
        <param name="llsamplestep" value="0.01"/>     <!-- linear range -->
        <param name="lasamplestep" value="0.005"/>    <!-- angular step size -->

        <!-- Others -->
        <param name="linearUpdate" value="0.05"/>     <!-- 机器人移动linearUpdate距离,进行scanmatch -->
        <param name="angularUpdate" value="0.0436"/>  <!-- 机器人选装angularUpdate角度,进行scanmatch -->
        <param name="resampleThreshold" value="0.5"/> <!-- 重采样门限Neff. threshold at which the particles get resampled. Higher means more frequent resampling -->
        <param name="particles" value="100"/>         <!-- 滤波器中粒子数目  Each particle represents a possible trajectory that the robot has traveled -->

        <remap from="scan" to="$(arg scan_topic)"/>
    </node>
</launch>
4. 在新终端中启动bag包回放,将数据提供给slam_gmapping节点
$ rosbag play my_scan_data.bag
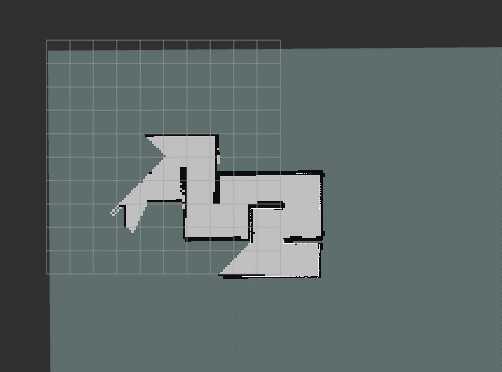
在数据回放过程中也可以打开rviz进行查看:启动rviz,在左下方点击add按钮,然后选择map,创建一副空地图;接着制定rviz的topic为/map可以监听到地图数据。下图是rosbag回放过程中建图的动态过程:
5. 使用map_server生成地图
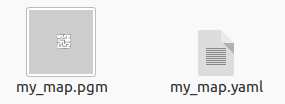
$ rosrun map_server map_saver -f my_map
使用map_saver命令后会生成两个文件。my_map.pgm是地图的PGM格式的图片,PGM格式是便携式灰度图像格式(portable graymap file format)。my_map.yaml文件描述地图元数据。
my_map.yaml文件内容如下:
image: my_map.pgm
resolution: 0.050000
origin: [-12.200000, -12.200000, 0.000000]
negate: 0
occupied_thresh: 0.65
free_thresh: 0.196
- image:图像文件的路径;可以是绝对的,或相对于YAML文件的位置
- resolution:地图的分辨率,米/像素
- origin:地图中左下角像素的位置和姿态(x,y,yaw),偏航为逆时针旋转(yaw = 0表示无旋转)
- occupancy_thresh:概率大于该阈值的像素被认为完全占用
- free_thresh:概率小于该阈值的像素被认为是完全自由的
- negate:“白/黑”对应“自由/占用”语义是否应该被反转
最终生成的地图如下图所示,图中越亮/白的像素表示没有障碍物(free)的概率越大,越暗/黑的像素表示被障碍物占据(occupied)的概率越大,灰色表示状态未知。
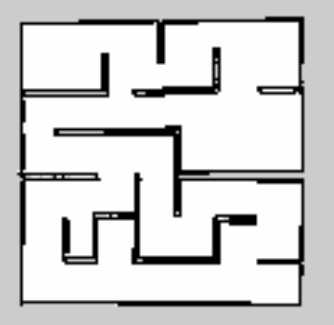
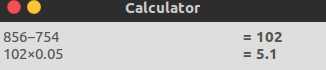
用屏幕测量工具测量图片上的像素间的距离,再乘以分辨率可以得到实际尺寸。例如,左下角点和右下角点的像素间距测量结果为102(可能点取的不精确),对应的实际距离为5.1m,这与真实地图大小一致。
6. 在建图结束后不要忘记重置use_sim_time参数
$ rosparam set use_sim_time false
参考:
Learning about tf and time (C++)
Publishing Odometry Information over ROS