标签:无效 个数 程序 高度 type png element 相交 etc
最近想在小程序做股票K线图,于是尝试用Canvas实现股票K线图。第一步,我们先定义K线类:
function Bar(open,high,low,close,width){
    this.open = open;
    this.high = high;
    this.low = low;
    this.close = close;
    this.width = width | 5;
}
输入参数分别表示开盘价,最高价,最低价,收盘价,K线宽度。
K线类定义一个绘制函数:
Bar.prototype.draw = function(pen,x,base,frag,screen){
    //根据base,frag计算坐标
    var _open = screen - (this.open - base)*frag - 10;
    var _high = screen - (this.high - base)*frag - 10;
    var _low = screen - (this.low - base)*frag - 10;
    var _close = screen - (this.close - base)*frag - 10;
    //根据base,frag画K线
    pen.save();
    if(this.close >= this.open){
        pen.fillStyle = "#FF0000";
        pen.strokeStyle = "#FF0000";
    }else{
        pen.fillStyle = "#00FF00";
        pen.strokeStyle = "#00FF00";
    }
    pen.beginPath();
    pen.moveTo(30 + x * this.width*2 + this.width,_high);
    pen.lineTo(30 + x * this.width*2 + this.width,_low);
    pen.stroke();
    var y = ((_open > _close)?_open:_close);
    if(Math.abs(_open - _close) == 0 ){
        pen.moveTo(35 + x * this.width*2,y);
        pen.lineTo(30 + (x+1) * this.width*2,y);
        pen.stroke();
    }else{
        pen.fillRect(35 + x * this.width*2,((_open < _close)?_open:_close),2*(this.width-5),Math.abs(_open - _close));
    }
    pen.restore();
}
pen为画布的上下文,x为该K线的X位置,base为整个数据中最小坐标对应的价格,frag是单位价格对应的高度,screen为画布的整体高度,由于Canvas是左上角为坐标点(0,0),所以需要screen做坐标转换。
绘制流程大致为:
1、将价格转换为画布上相应的坐标
2、根据收盘价和开盘价确定阴柱与阳柱,设置相应的颜色
3、根据最高价与最低价画线,根据开盘价与收盘价画矩形
至此,K线已经绘制代码已经结束。
第二步,实现坐标系
首先先创建一个图表类
function chart(dom){
    var width = parseFloat(dom.style.width.replace("px",""));
    var height = parseFloat(dom.style.height.replace("px",""));
    var canvas = document.createElement("canvas");
    canvas.style.width = width + "px";
    canvas.style.height = height + "px";
    canvas.width = width;
    canvas.height = height;

    dom.appendChild(canvas);
    var context = canvas.getContext("2d");
    this.width = width;
    this.height = height;
    this.pen = context;
}
根据传入的div节点,创建Canvas,这里需要注意
canvas.width = width;
canvas.height = height;
两行代码的必要性,这两行保证了绘制内容与实际设置的大小相符,这里不能带“px”,否则无效。
坐标轴的实质就是两个相交的直线,对于刻度,需要根据数据进行设置,实现代码如下:
chart.prototype.drawBar = function(date,data){
    //计算价格最大值与最小值
    var maxPrice = -1,minPrice = 999999;
    for(var i = 0;i < data.length;i++){
        if(data[i][1] > maxPrice){
            maxPrice = data[i][1];
        }
        if(data[i][2] < minPrice){
            minPrice = data[i][2];
        }
    }
    var frag = (this.height-20)/(maxPrice - minPrice);
    var kwidth = Math.round((this.width-30)/(date.length+2));

    //清屏
    this.pen.save();
    this.pen.fillStyle = "#FFFFFF";
    this.pen.fillRect(0,0,this.width,this.height);
    this.pen.restore();
    //画坐标轴
    this.pen.save();
    this.pen.beginPath();
    this.pen.lineWidth = 1;
    this.pen.strokeStyle = "#888888";
    this.pen.moveTo(30,this.height - 10);
    this.pen.lineTo(this.width-30,this.height - 10);
    this.pen.stroke();
    this.pen.moveTo(30,this.height - 10);
    this.pen.lineTo(30,10);
    this.pen.stroke();
    for(var i = 0;i < 5;i++){
        this.pen.moveTo(30,(this.height - (10 + i*(this.height-20)/5)));
        this.pen.lineTo(35,(this.height - (10 + i*(this.height-20)/5)));
        this.pen.stroke();
        this.pen.fillText((i*(this.height-20)/5/frag + minPrice).toFixed(2),0,(this.height - (10 + i*(this.height-20)/5)));
    }

    for(var i = 0;i < data.length;i++){
        var bar = new Bar(data[i][0],data[i][1],data[i][2],data[i][3],kwidth/2);
        bar.draw(this.pen,i,minPrice,frag,this.height);
        //绘制日期
        //this.pen.save();

        //this.pen.restore();
    }
    for(var i = 0;i < date.length;i++){
        this.pen.moveTo(30 + (i+1) * kwidth,this.height - 10);
        this.pen.lineTo(30 + (i+1) * kwidth,this.height - 15);
        this.pen.stroke();
        this.pen.fillText(date[i],30 + (i + 1/2) * kwidth,this.height);
    }
}
以上,K线绘制组件已经实现,接下来查看应用:
<script src = "http://data.gtimg.cn/flashdata/hushen/daily/18/sz002578.js"></script>
<script src = "stock.js"></script>
<div id = "canvas" style = "width:600px;height:400px;"></div>
<script>
var ev_data = daily_data_18.split("\n");
var date = [],data = [];
for(var i = 1;i < ev_data.length - 1;i++){
    var es = ev_data[i].split(" ");
    date.push(es[0]);
    data.push([parseFloat(es[1]),parseFloat(es[3]),parseFloat(es[4]),parseFloat(es[2])]);
}
var canvas = document.getElementById("canvas");
var chart = new chart(canvas);
chart.drawBar(date,data);
</script>
效果如图: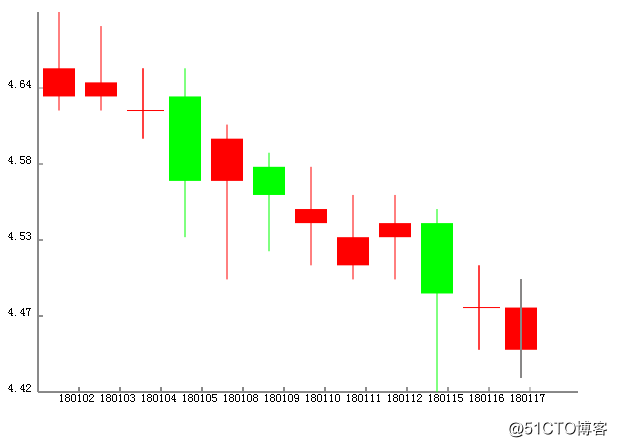
标签:无效 个数 程序 高度 type png element 相交 etc
原文地址:http://blog.51cto.com/janwool/2062279