使用matplotlib模拟下e^x的麦克劳林展开式,用plt画图一开始觉得还是挺有意思的。
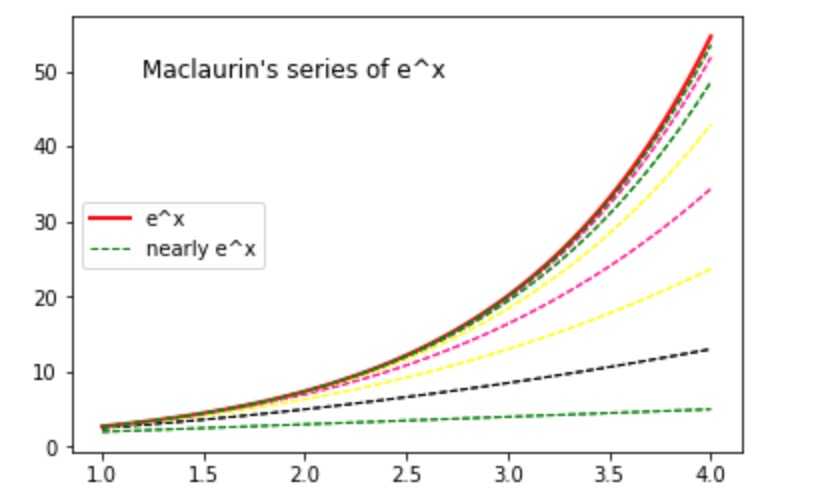
import matplotlib.pyplot as plt
import numpy as np
import random

‘‘‘
e^x的麦克劳林展开式:
e^x= f(0)+ f′(0)x+ f″(0)x 2/ 2!+...+ f?(0)x^n/n!+Rn(x)
=1+x+x^2/2!+x^3/3!+...+x^n/n!+Rn(x)
‘‘‘


# 阶乘函数
def factorial(n):
    x = 1
    for i in range(1,n+1):
        x = x * i
    return x

# y值函数
def consY(n,x):
    y = 1
    for i in range(1,n):
        y += x**i/factorial(i)
    return y

# 生成图像
def moniPlot(n,x):
    # 定义一个颜色集合
    colors = [‘g‘,‘b‘,‘black‘,‘cyan‘,‘lightgreen‘,‘yellow‘,‘deeppink‘,‘darkorchid‘]
    plt.figure()

    # 原函数
    y = np.e**x
    # 画原函数图像并进行标记
    plt.plot(x,y,‘r-‘,linewidth=2,label=‘e^x‘)

    # 麦克劳林展开添加到图像上
    for i in range(2,n):
        y = consY(i,x)
        # 随机选择颜色
        color = colors[random.randint(0,len(colors)-1)]
        linestyle = ‘--‘
        # 画图像,并对最后一个进行标记
        if i == n:
            plt.plot(x,y,color=color,linewidth=1,linestyle=linestyle,label="nearly e^x")
        else:
            plt.plot(x,y,color=color,linewidth=1,linestyle=linestyle)
        plt.plot(x,y,color=color,linewidth=1,linestyle=linestyle)
    #添加注释
    plt.text(1.2, consY(10,3.9),"Maclaurin‘s series of e^x ",size=12)

    # 将标记绘制图例,位置为于中间左侧
    plt.legend([‘e^x‘,"nearly e^x"], loc = ‘center left‘)

    plt.show()


# 定义 x , y
x = np.linspace(1,4,80)
# 原函数
# y = np.e**x
# Maclaurin展开 3项
# y1 = consY(2,x)
# 展开 4项
# y2 = consY(3,x)
# tylor 5项
# y3 = consY(4,x)

# 调用生成图像
moniPlot(10,x)

# 关闭图
plt.close()
运行代码,plt展示的结果如下(展开式的项数越多,越接近原函数):