码迷,mamicode.com
首页 > 其他好文 > 详细

matlab 画图

时间:2018-03-19 23:31:48      阅读:223      评论:0      收藏:0      [点我收藏+]

标签:width   art   .com   axis   mod   log   blog   bubuko   div   

图像为仿真http://blog.csdn.net/dymodi/article/details/46411301

subpolt 在一幅图里画多个图像

plot3,画三维线

mesh画三维曲面

meshc带等高线,meshz带curtain

colormap负责改颜色

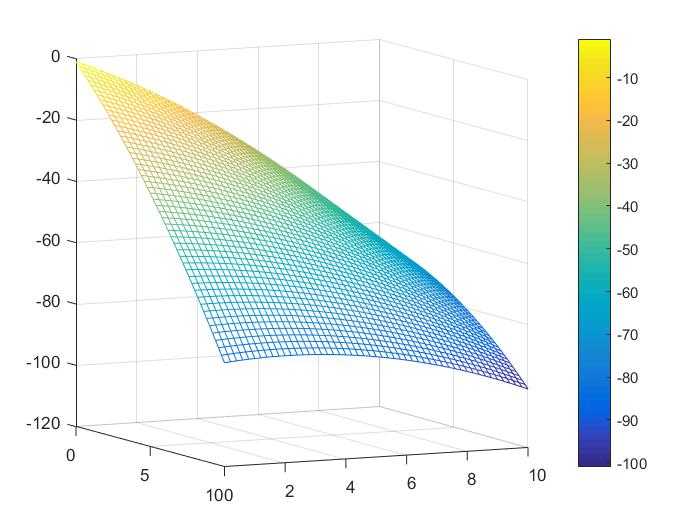
[a,b]=meshgrid([0:0.2:10],[0:0.2:10]);
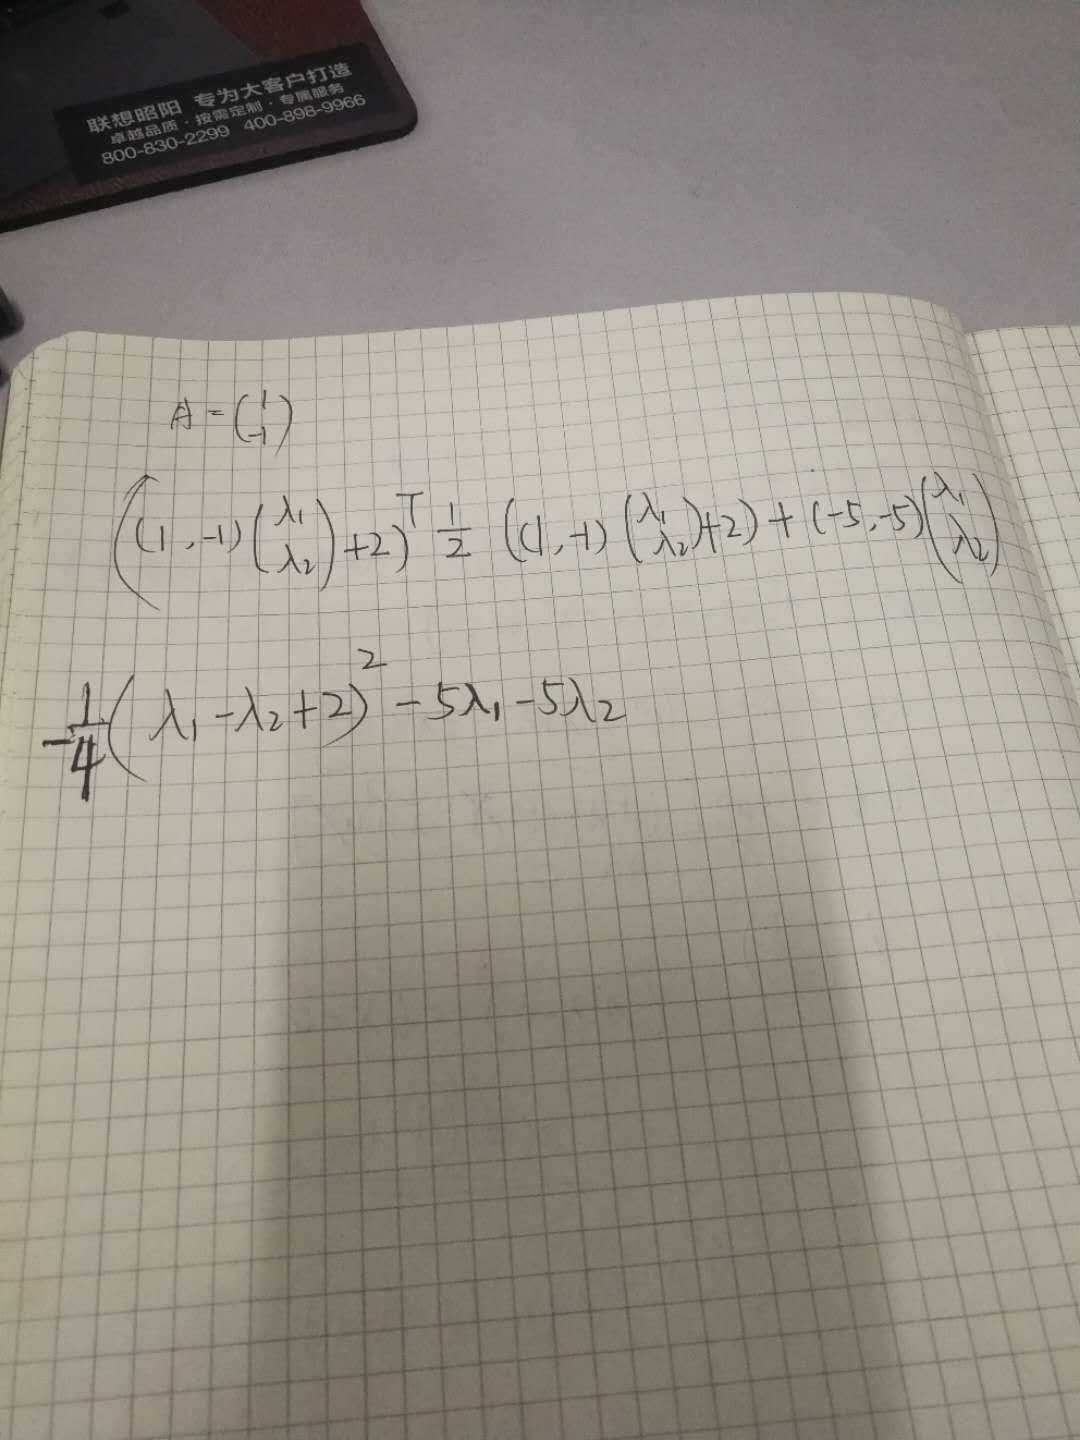
c=-0.25*(a-b+2).^2-5*(a+b);

%colormap(gray(50));
figure(1);
mesh(a,b,c);
axis([0 10 10 0 -120 0]);

技术分享图片

技术分享图片

matlab 画图

标签:width   art   .com   axis   mod   log   blog   bubuko   div   

原文地址:https://www.cnblogs.com/xiaoxuesheng993/p/8605577.html

(0)
(0)
   
举报
评论 一句话评论(0
登录后才能评论!
© 2014 mamicode.com 版权所有  联系我们:gaon5@hotmail.com
迷上了代码!