本文的目的在于,尽可能用简单的代码,让大家了解内存监控的原理,及思想。更容易去理解Nagios、Zabbix、Ganglia监控原理,文章最后还有视频教程链接哦,从零敲出来的全过程
思路分为下面几块:
1.获取内存监控信息
2.存储监控信息
3.数据展现
4.后续扩展
1.加主机名,monitor部署在多台机器,不直接插入数据库
2. 增加CPU,Disk监控
3. 通过HTTP请求的方式,启用一个单独的Flask专门存储monitor数据
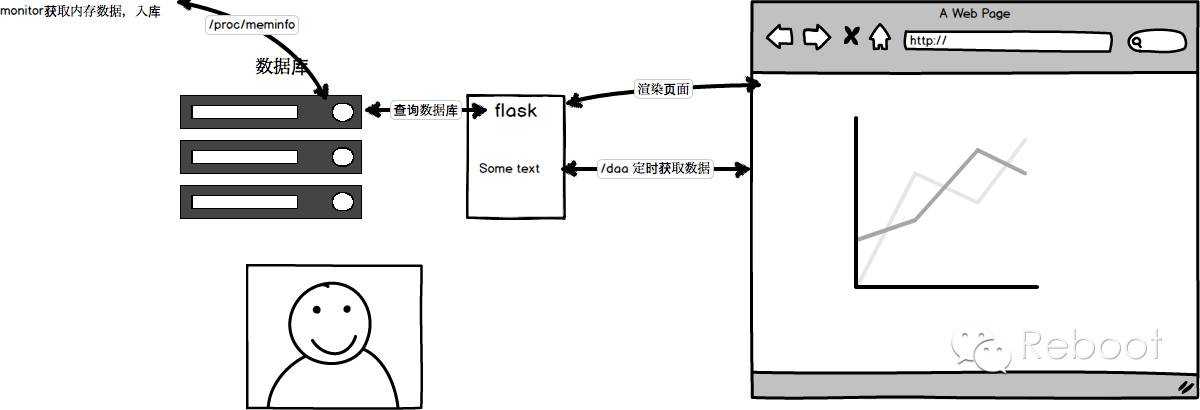
第一步:获取内存信息
我们通过读取 /proc/meminfo获取监控数据MemTotal、MemFree、Buffers、Cached,咱们常用free -m 其实也是读取的/pro/meminfo的数据,顺便说一下
对于操作系统来说,Buffers、Cached是已经被使用的
MemFree=total-used
对于应用程序来说
MemFree=buffers+cached+free
监控物理内存使用
内存使用=MemTotal-MemFree-Buffers-Cached
开撸:monitor.py获取监控数据
def getMem():
with open(‘/proc/meminfo‘) as f:
total = int(f.readline().split()[1])
free = int(f.readline().split()[1])
buffers = int(f.readline().split()[1])
cache = int(f.readline().split()[1])
mem_use = total-free-buffers-cache
print mem_use/1024
while True:
time.sleep(1)
getMem()
测试:每秒打印一条数据
[www.51reboot.com@teach memory]$ python mointor.py 2920
2919
2919
2919
2919
希望内存多变好一些,写了一个很挫的测试代码
# test.py
s = ‘www.51reboot.com‘*1000000
for i in s:
for j in s:
s.count(j)
执行python test.py,会发现内存占用多了几M,说明咱们的代码是OK的
第二步:存储监控信息(我们用MySQL)
我们需要两个字段,内存和时间 sql呼之欲出,简单粗暴
create database memory;

create memory(memory int,time int)
接下来我们把monitor.py的数据存储到数据库中,这用到了Python MySQLdb模块
import time
import MySQLdb as mysql

db = mysql.connect(user="reboot",passwd="reboot123",db="memory",host="localhost")
db.autocommit(True)
cur = db.cursor()

def getMem():
with open(‘/proc/meminfo‘) as f:
total = int(f.readline().split()[1])
free = int(f.readline().split()[1])
buffers = int(f.readline().split()[1])
cache = int(f.readline().split()[1])
mem_use = total-free-buffers-cache
t = int(time.time())
sql = ‘insert into memory (memory,time) value (%s,%s)‘%(mem_use/1024,t)
cur.execute(sql)
print mem_use/1024

while True:
time.sleep(1)
getMem()
暂时告一段落
第三步:数据展现(Flask框架)
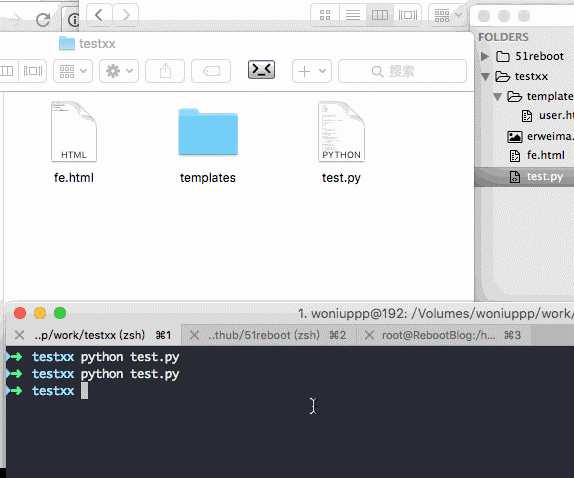
代码结构
├── flask_web.py web后端代码
├── mointor.py 监控数据获取
├── static 静态文件,第三方图表库
│ ├── exporting.js
│ ├── highstock.js
│ └── jquery.js
├── templates
│ └── index.html 展示前端页面
└── test.py 占用内存的测试代码
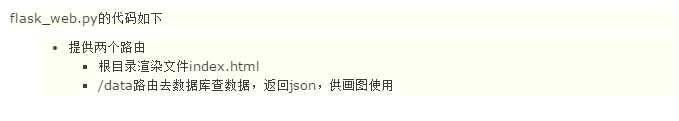
from flask import Flask,render_template,request
import MySQLdb as mysql

con = mysql.connect(user=‘reboot‘,passwd=‘reboot123‘,host=‘localhost‘,db=‘memory‘)

con.autocommit(True)
cur = con.cursor()
app = Flask(__name__)
import json

@app.route(‘/‘)
def index():
return render_template(‘index.html‘)

@app.route(‘/data‘)
def data():
sql = ‘select * from memory‘
cur.execute(sql)
arr = []
for i in cur.fetchall():
arr.append([i[1]*1000,i[0]])
return json.dumps(arr)

if __name__==‘__main__‘:
app.run(host=‘0.0.0.0‘,port=9092,debug=True)
前端index.html
<div id="container" style="height: 400px; min-width: 310px"></div>
<script>
$(function () {
// 使用当前时区,否则东八区会差八个小时
Highcharts.setOptions({
global: {
useUTC: false
}
});
$.getJSON(‘/data‘, function (data) {
// Create the chart
$(‘#container‘).highcharts(‘StockChart‘, {
rangeSelector : {
selected : 1
},
title : {
text : ‘内存数据‘
},
series : [{
name : ‘本机内存‘,
data : data,
tooltip: {
valueDecimals: 2
}
}]
});
});
});
</script>
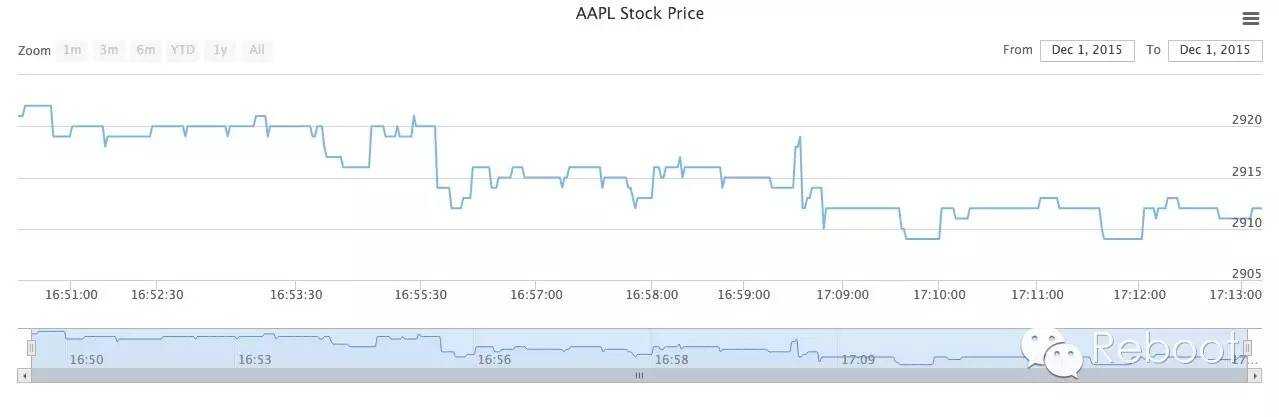
执行python flask_web.py,浏览器看数据www.51reboot.com:9092,出图了
我们并不仅限于此,如果想实时的看到内存,应该怎么搞
1.查询数据时候增加一个时间戳当限制条件,只返回两次查询之间的增量数据
2.前端动态添加增量结点数据到图表中
修改flask_web.py
tmp_time = 0

@app.route(‘/data‘)
def data():
global tmp_time
if tmp_time>0:
sql = ‘select * from memory where time>%s‘ % (tmp_time/1000)
else:
sql = ‘select * from memory‘
cur.execute(sql)
arr = []
for i in cur.fetchall():
arr.append([i[1]*1000,i[0]])
if len(arr)>0:
tmp_time = arr[-1][0]
return json.dumps(arr)
前端,3秒查一次增量数据,根据自己需求调整,修改index.html
$.getJSON(‘/data‘, function (data) {

// Create the chart
$(‘#container‘).highcharts(‘StockChart‘, {
chart:{
events:{
load:function(){
var series = this.series[0]
setInterval(function(){
$.getJSON(‘/data‘,function(res){
$.each(res,function(i,v){
series.addPoint(v)
})
})
},3000)
}
}
},
rangeSelector : {
selected : 1
},
title : {
text : ‘AAPL Stock Price‘
},
series : [{
name : ‘AAPL‘,
data : data,
tooltip: {
valueDecimals: 2
}
}]
});
});
done!两个文件都搞定,double kill! 效果
后边改了这么多,大家可能糊涂了,现在给出完整代码:
完整代码大家可以从Github下载
https://github.com/shengxinjing/my_blog/issues/1
视频下载地址:http://pan.baidu.com/s/1i4acpP7
Python学习交流群:238757010