标签:aliyun 技术分享 分享 delete repr mail for ant sla
 1 #!/usr/bin/env python3
 2 #-*- coding:utf-8 -*-
 3 ############################
 4 #File Name: polar.py
 5 #Author: frank
 6 #Mail: frank0903@aliyun.com
 7 #Created Time:2018-05-22 22:08:01
 8 ############################
 9
10 import matplotlib.pyplot as plt
11 import numpy as np
12 import matplotlib as mpl
13
14 plt.subplot(111, polar=True)
15 plt.savefig(‘create_polar.jpg‘)
16 plt.show()
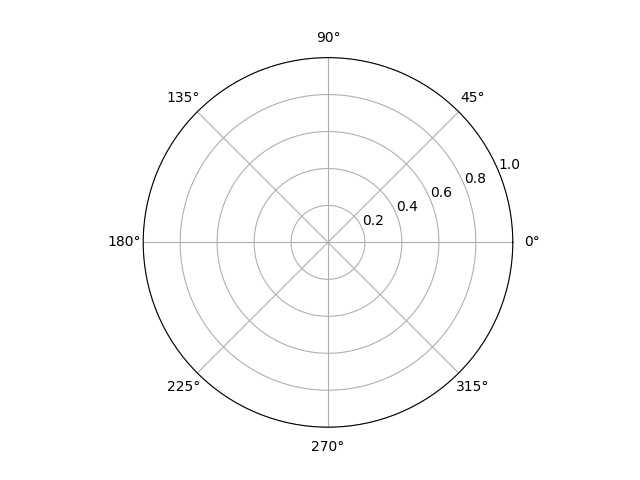
从上图可以看出,默认极坐标系的 极角显示刻度为(0, 360,45),极径显示刻度为(0,1.0,0.2),0度的方向为“E”,默认极坐标的方向是逆时针方向。
那么,
1. 怎么设置极坐标系的方向?
2. 怎么设置极坐标(ρ, 0)的起始位置?
3. 怎样设置极坐标系 的极角网格线(thetagrids)上的 显示刻度?
4. 怎样设置极坐标系 的极径网格线上(rgrids)的 显示刻度?
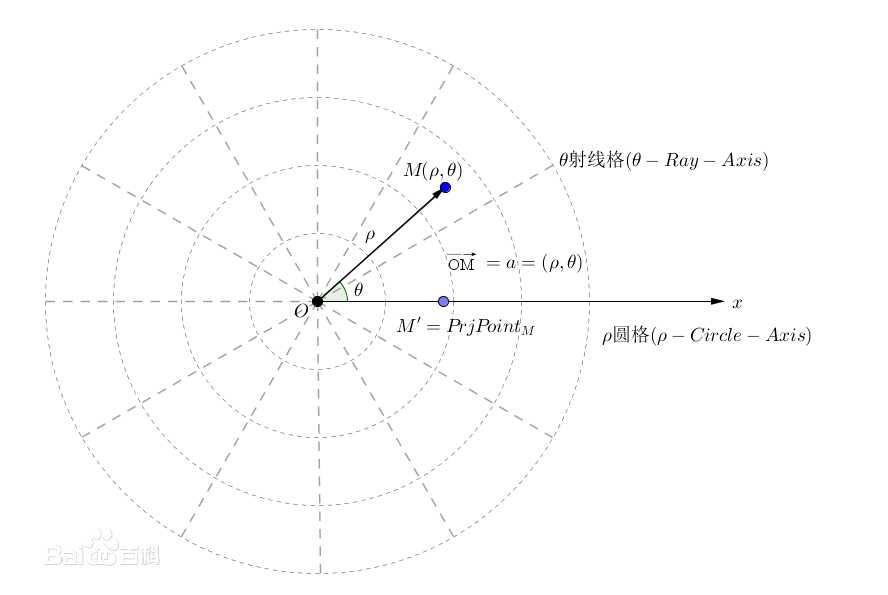
在平面内取一个定点O,叫极点,引一条射线Ox,叫做极轴,再选定一个长度单位和角度的正方向(通常取逆时针方向)。对于平面内任何一点M,用ρ表示线段OM的长度(有时也用r表示),θ表示从Ox到OM的角度,ρ叫做点M的极径,θ叫做点M的极角,有序数对 (ρ,θ)就叫点M的极坐标,这样建立的坐标系叫做极坐标系。通常情况下,M的极径坐标单位为1(长度单位),极角坐标单位为rad(或°)。(reference:https://baike.baidu.com/item/%E6%9E%81%E5%9D%90%E6%A0%87/7607962?fr=aladdin)
matplotlib.pyplot.subplot(*args, **kwargs)
Return a subplot axes at the given grid position.
subplot(nrows, ncols, index, **kwargs)
In the current figure, create and return an Axes, at position index of a (virtual) grid of nrows by ncols axes. Indexes go from 1 to nrows *ncols, incrementing in row-major order.
If nrows, ncols and index are all less than 10, they can also be given as a single, concatenated, three-digit number.
For example, subplot(2, 3, 3) and subplot(233) both create an Axes at the top right corner of the current figure, occupying half of the figure height and a third of the figure width.
nrows, ncols, index表示在当前figure中,每个subplot的位置。
如果nrows,ncols and index 都小于10,那么可以将 nrow,ncols,index三个数组合成一个数来表示subplot的位置。例如subplot(2,3,3)等价于subplot(233),这个subplot位于当前figure的右上角,其高度占整个figure的一半,其宽度占整个figure的三分之一。
Note:
Creating a subplot will delete any pre-existing subplot that overlaps with it beyond sharing a boundary:
import matplotlib.pyplot as plt
# plot a line, implicitly creating a subplot(111)
plt.plot([1,2,3])
# now create a subplot which represents the top plot of a grid
# with 2 rows and 1 column. Since this subplot will overlap the
# first, the plot (and its axes) previously created, will be removed
plt.subplot(211)
plt.plot(range(12))
plt.subplot(212, facecolor=‘y‘) # creates 2nd subplot with yellow background
If you do not want this behavior, use the add_subplot() method or the axes() function instead.
在同一个figure中,如果之前已经创建了一个subplot0(如plt.plot([1,2,3])),然后有创建另一个subplot1(如plt.subplot(211)),那么sunplot1会将subplot0覆盖掉。
如果想避免这种情况发生,可以使用add_subplot()函数或axes()函数。
Keyword arguments:
facecolor: The background color of the subplot, which can be any valid color specifier. See matplotlib.colors for more information.
指定subplot的背景颜色。
polar: A boolean flag indicating whether the subplot plot should be a polar projection. Defaults to False.
指定subplot是否为极坐标
projection: A string giving the name of a custom projection to be used for the subplot. This projection must have been previously registered. See matplotlib.projections.
参考资料:https://matplotlib.org/api/_as_gen/matplotlib.pyplot.subplot.html?highlight=subplot#matplotlib.pyplot.subplot
标签:aliyun 技术分享 分享 delete repr mail for ant sla
原文地址:https://www.cnblogs.com/black-mamba/p/9076237.html