ELK搭建文档
环境准备
系统:Centos6.8
ip: 192.168.137.52 node1
192.168.137.48 node2
[root@node2 ~]# cat /etc/hosts
127.0.0.1 localhost localhost.localdomain localhost4 localhost4.localdomain4
::1 localhost localhost.localdomain localhost6 localhost6.localdomain6
192.168.137.48 node2
192.168.137.52 node1
node1同上操作步骤
elk准备环境俩台完全相同
一.elasticsearch安装
[root@node2 ~]# rpm --import https://packages.elastic.co/GPG-KEY-elasticsearch
添加yum源
[root@node2 ~]# vim /etc/yum.repos.d/elasticsearch.repo
[elasticsearch-2.x]
name=Elasticsearch repository for 2.x packages
baseurl=http://packages.elastic.co/elasticsearch/2.x/centos
gpgcheck=1
gpgkey=http://packages.elastic.co/GPG-KEY-elasticsearch
enabled=1
1.安装elasticsearch
[root@node2 ~]# yum install -y elasticsearch
2.logstash
下载并安装GPG key
[root@node2 ~]# rpm --import https://packages.elastic.co/GPG-KEY-elasticsearch
添加yum源
[root@node2 ~]# vim /etc/yum.repos.d/logstash.repo
[logstash-2.1]
name=Logstash repository for 2.1.x packages
baseurl=http://packages.elastic.co/logstash/2.1/centos
gpgcheck=1
gpgkey=http://packages.elastic.co/GPG-KEY-elasticsearch
enabled=1
3.安装logstash
[root@node2 ~]# yum install -y logstash
4.安装kibana
[root@node2 ~]# cd /usr/local/src
[root@node2 src]# wget https://download.elastic.co/kibana/kibana/kibana-4.3.1-linux-x64.tar.gz
[root@node2 src]# tar zxf kibana-4.3.1-linux-x64.tar.gz
[root@node2 src]# mv kibana-4.3.1-linux-x64 /usr/local/
[root@node2 src]# ln -s /usr/local/kibana-4.3.1-linux-x64/ /usr/local/kibana
5.安装Redis,nginx和java
[root@node2 src]# yum install epel-release -y
[root@node2 src]# yum install -y redis nginx java
二.配置管理 elasticsearch
配置node1的elasticsearch,并授权
[root@node1 ~]# grep -n ‘^[a-Z]‘ /etc/elasticsearch/elasticsearch.yml
17:cluster.name: check-cluster #判别节点是否是统一集群
23:node.name: node1 #节点的hostname
33:path.data: /data/es-data #数据存放路径
37:path.logs: /var/log/elasticsearch/ #日志路径
43:bootstrap.memory_lock: true #锁住内存,使内存不会再swap中使用
54:network.host: 0.0.0.0 #允许访问的ip
58:http.port: 9200 #端口
[root@node1 ~]# mkdir -p /data/es-data
[root@node1 ~]# chown elasticsearch.elasticsearch /data/es-data/
[root@node1 ~]# /etc/init.d/elasticsearch start
[root@node1 ~]# chkconfig elasticsearch on
[root@node1 ~]# netstat -lntup|grep 9200
tcp 0 0 :::9200 :::* LISTEN 2443/java
访问 ip+9200端口就显示出信息,如果不行检查防火墙是否放通9200,例如: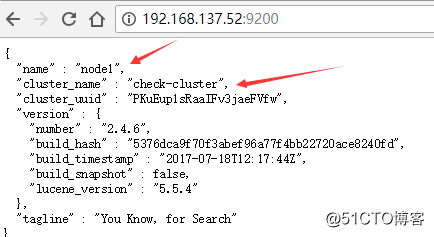
elasticsearch进行交互,使用restful apj进行交互,查看当前索引和分片情况,稍后会有插件表示,如下:
[root@node1 ~]# curl -i -XGET ‘http://192.168.137.52:9200/_count?pretty‘ -d ‘{
"query" {
"match_all": {}
}
}‘
HTTP/1.1 200 OK
Content-Type: application/json; charset=UTF-8
Content-Length: 95
{
"count" : 0, #索引0个
"_shards" : { #分区0个
"total" : 0,
"successful" : 0, #成功0个
"failed" : 0 #失败0个
}
}
使用head插件显示索引和分片情况
[root@node1 ~]# /usr/share/elasticsearch/bin/plugin install mobz/elasticsearch-head
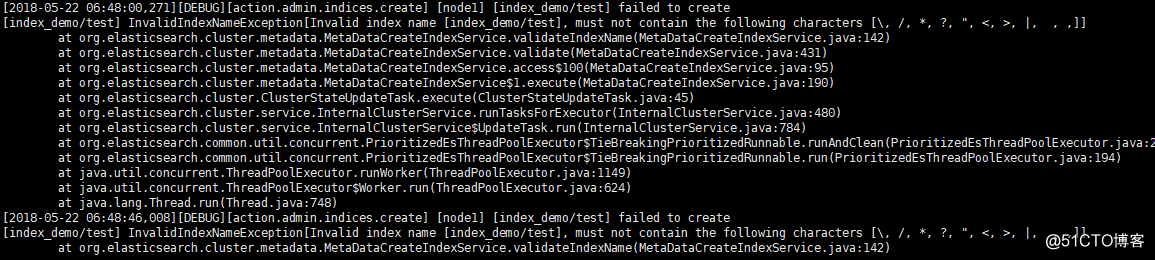
在插件中添加一个index-demo/test的索引,提交请求?
http://192.168.137.52:9200/_plugin/head/
点击复合索引 在下方第二行写上index_demo/test 索引 ,空白出填写输出信息,如下: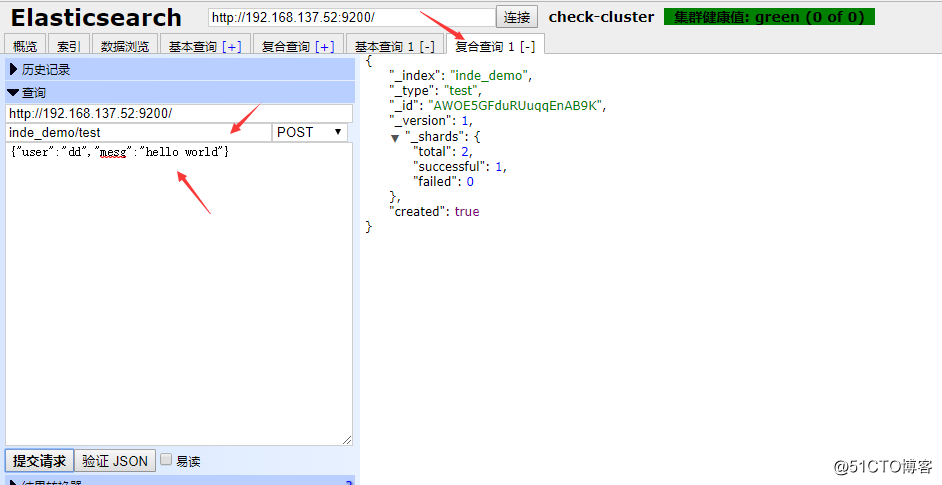
发送一个GET(当然可以使用其他类型请求)请求,查询上述索引id填写在索引行的类型后面,选择get,提交请求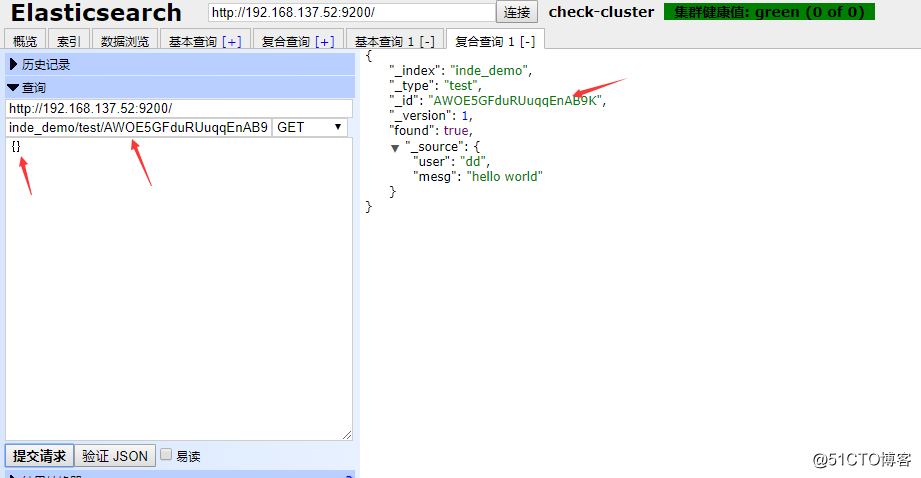
在基本查询中查看所建索引?,点击基本查询,点击搜素,就会信息信息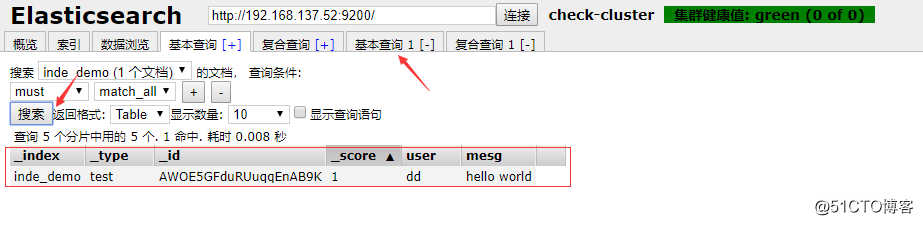
三.管理node2的elasticsearch
将node1的配置文件拷贝到node2中,并修改配置文件node.name并授权?
配置文件中cluster.name的名字一定要一致,当集群内节点启动的时候,默认使用组播(多播),寻找集群中的节点
root@node1 ~]# scp /etc/elasticsearch/elasticsearch.yml 192.168.137.48:/etc/elasticsearch/elasticsearch.yml
[root@node2 ~]# grep -n ‘^[a-Z]‘ /etc/elasticsearch/elasticsearch.yml
17:cluster.name: check-cluster
23:node.name: node2
33:path.data: /data/es-data
37:path.logs: /var/log/elasticsearch/
43:bootstrap.memory_lock: true
54:network.host: 0.0.0.0
58:http.port: 9200
[root@node2 ~]# mkdir -p /data/es-data
[root@node2 ~]# chown elasticsearch.elasticsearch /data/es-data/
启动elasticsearch
[root@node2 ~]# /etc/init.d/elasticsearch start
[root@node2 ~]# chkconfig elasticsearch on
在node2配置中添加如下内容,使用单播模式(尝试了使用组播,但是不生效)
[root@node1 ~]# grep -n "^discovery" /etc/elasticsearch/elasticsearch.yml
68:discovery.zen.ping.unicast.hosts: ["node1", "node2"]
[root@node2 ~]# grep -n "^discovery" /etc/elasticsearch/elasticsearch.yml
68:discovery.zen.ping.unicast.hosts: ["node1", "node2"]
[root@node2 ~]# /etc/init.d/elasticsearch restart
[root@node1 ~]# /etc/init.d/elasticsearch restart
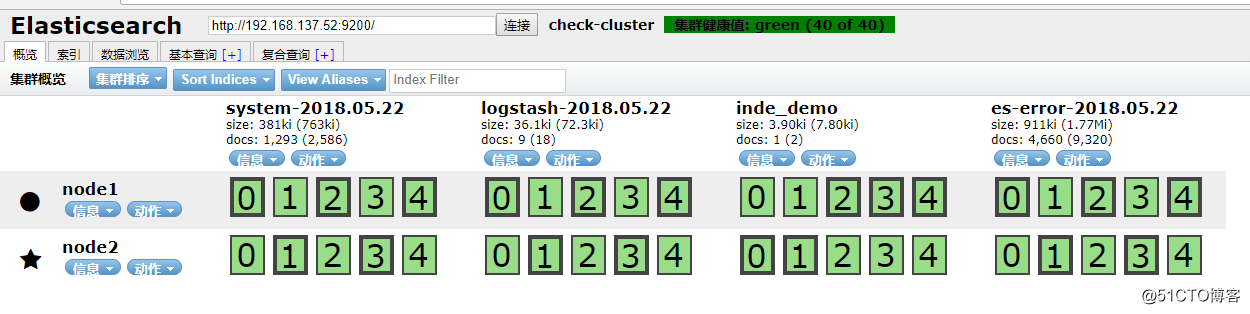
在浏览器中查看分片信息,一个索引默认被分成了5个分片,每份数据被分成了五个分片(可以调节分片数量),下图中外围带绿色框的为主分片,不带框的为副本分片,主分片丢失,副本分片会复制一份成为主分片,起到了高可用的作用,主副分片也可以使用负载均衡加快查询速度,但是如果主副本分片都丢失,则索引就是彻底丢失。
http://192.168.137.52:9200/_plugin/head/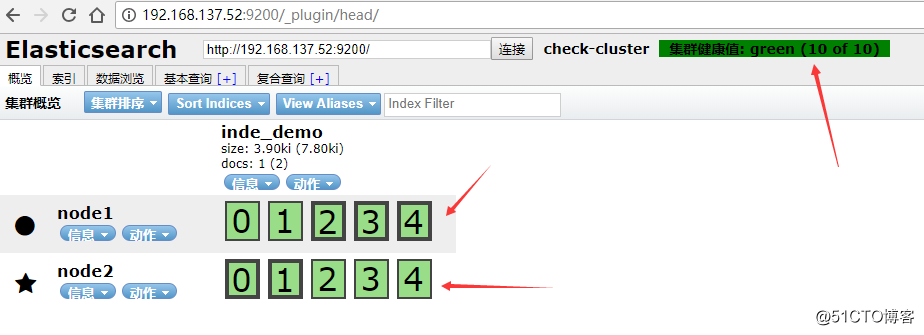
使用kopf插件监控elasticsearch
http://192.168.137.52:9200/_plugin/kopf/#!/cluster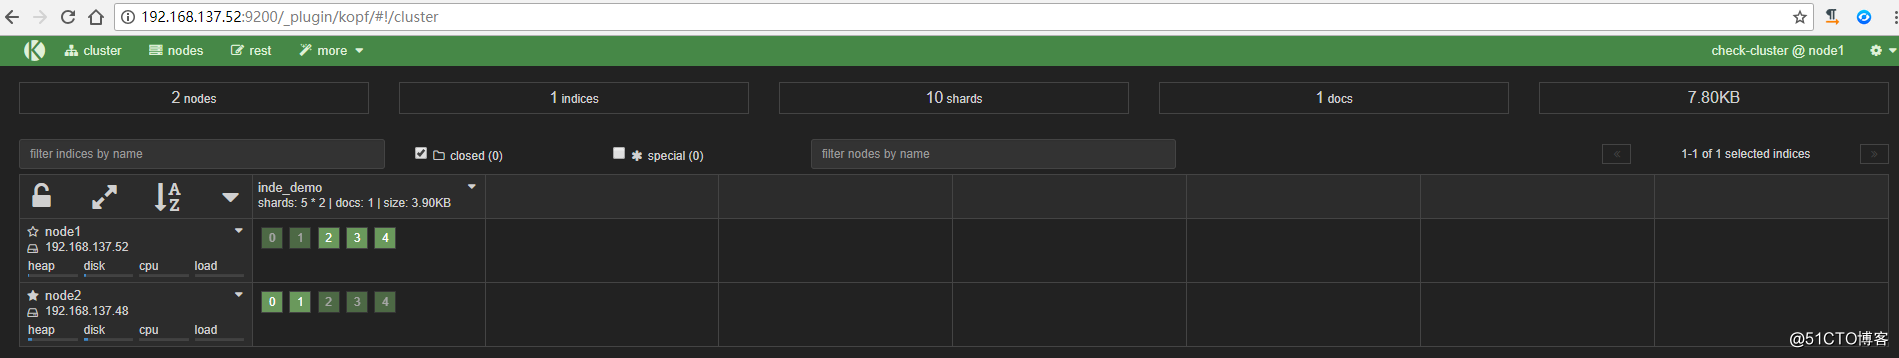
[root@node1 ~]# /usr/share/elasticsearch/bin/plugin install lmenezes/elasticsearch-kopf
点击nodes,从下图可以看出节点的负载,cpu适应情况,java对内存的使用(heap usage),磁盘使用,启动时间?
http://192.168.137.52:9200/_plugin/kopf/#!/nodes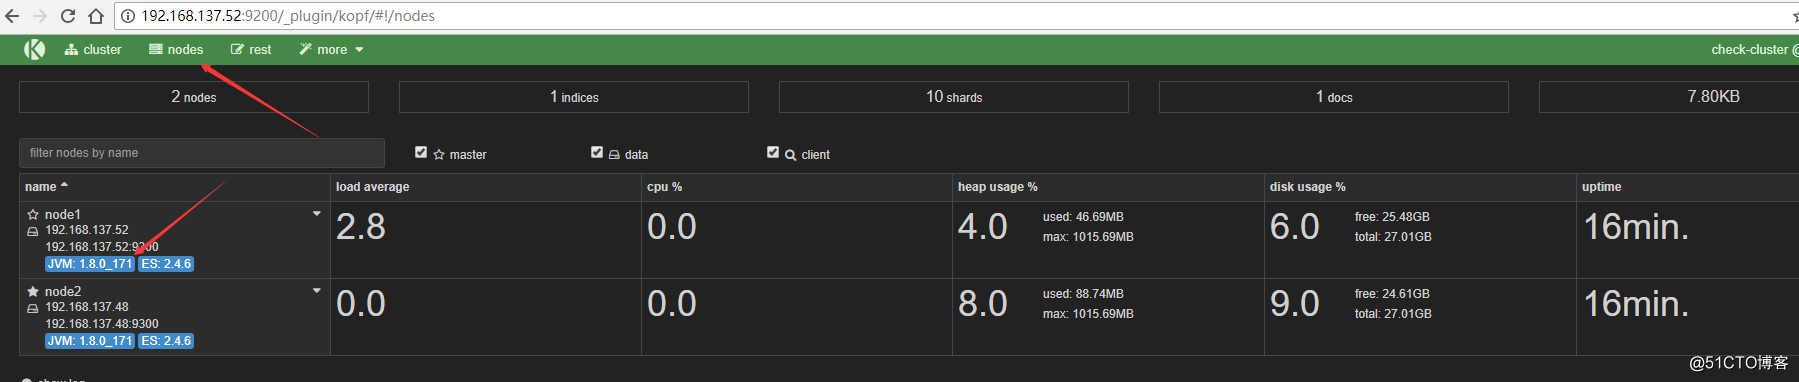
除此之外,kopf插件还提供了REST API 等,类似kopf插件的还有bigdesk,但是bigdesk目前还不支持2.1!!!安装bigdesk的方法如下
[root@node1 ~]# /usr/share/elasticsearch/bin/plugin install hlstudio/bigdesk
http://192.168.137.52:9200/_plugin/bigdesk/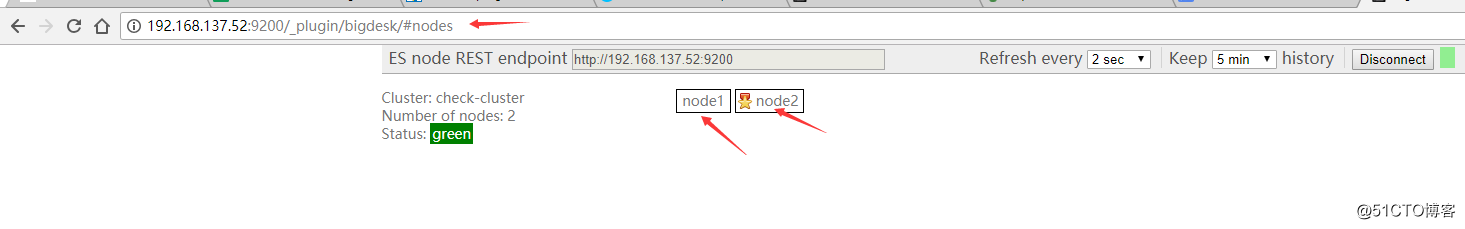
四.配置logstash
启动一个logstash,-e:在命令行执行;input输入,stdin标准输入,是一个插件;output输出,stdout:标准输出
[root@node1 ~]# /opt/logstash/bin/logstash -e ‘input { stdin{} } output { stdout{} }‘
OpenJDK 64-Bit Server VM warning: If the number of processors is expected to increase from one, then you should configure the number of parallel GC threads appropriately using -XX:ParallelGCThreads=N
Settings: Default filter workers: 1
Logstash startup completed
check #输入
2018-05-22T12:43:12.064Z node1 check #自动输出
www.baidu.com #输入
2018-05-22T12:43:27.696Z node1 www.baidu.com #输出
使用rubudebug显示详细输出,codec为一种编×××
[root@node1 ~]# /opt/logstash/bin/logstash -e ‘input { stdin{} } output { stdout{ codec => rubydebug} }‘
OpenJDK 64-Bit Server VM warning: If the number of processors is expected to increase from one, then you should configure the number of parallel GC threads appropriately using -XX:ParallelGCThreads=N
Settings: Default filter workers: 1
Logstash startup completed
check #输入
{
"message" => "check",
"@version" => "1",
"@timestamp" => "2018-05-22T12:50:07.161Z",
"host" => "node1"
}
上述每一条输出的内容称为一个事件,多个相同的输出的内容合并到一起称为一个事件(举例:日志中连续相同的日志输出称为一个事件)!?
使用logstash将信息写入到elasticsearch
[root@node1 ~]# /opt/logstash/bin/logstash -e ‘input { stdin{} } output { elasticsearch { hosts => ["192.168.137.52:9200"] } }‘
OpenJDK 64-Bit Server VM warning: If the number of processors is expected to increase from one, then you should configure the number of parallel GC threads appropriately using -XX:ParallelGCThreads=N
Settings: Default filter workers: 1
Logstash startup completed
maliang
check
baidu.com
www.baidu.com
在elasticsearch中查看logstash新加的索引?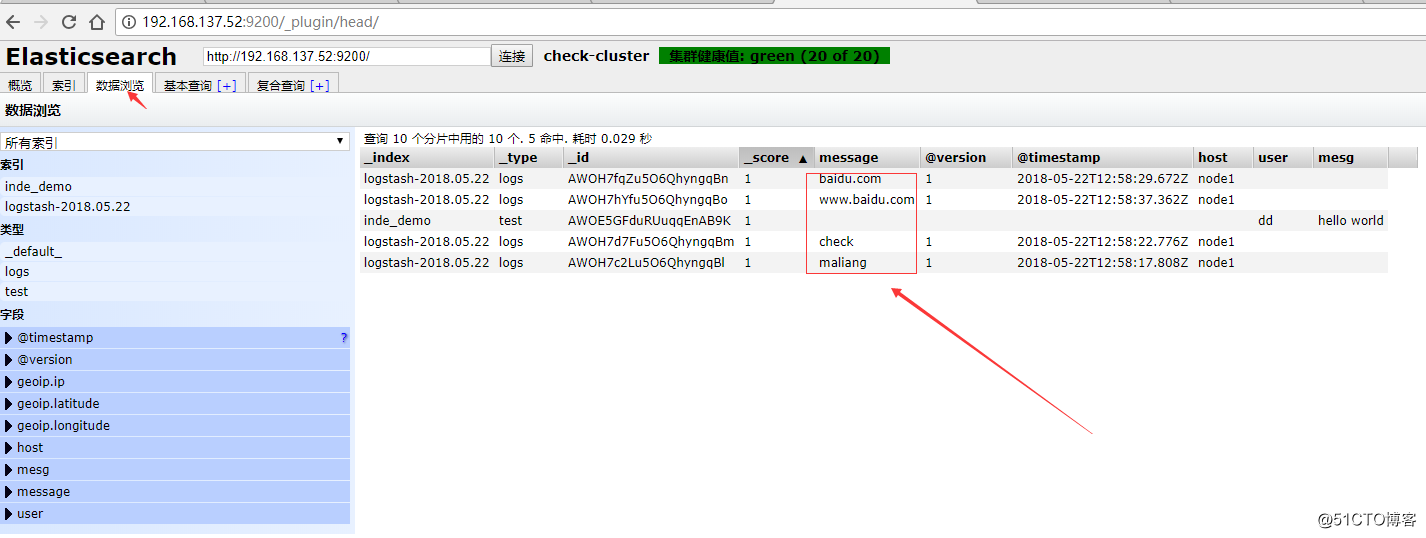
在elasticsearch中写一份,同时在本地输出一份,也就是在本地保留一份文本文件,也就不用在elasticsearch中再定时备份到远端一份了。此处使用的保留文本文件三大优势:1)文本最简单 2)文本可以二次加工 3)文本的压缩比最高
[root@node1 ~]# /opt/logstash/bin/logstash -e ‘input { stdin{} } output { elasticsearch { hosts => ["192.168.137.52:9200"] } stdout{ codec => rubydebug } }‘
OpenJDK 64-Bit Server VM warning: If the number of processors is expected to increase from one, then you should configure the number of parallel GC threads appropriately using -XX:ParallelGCThreads=N
Settings: Default filter workers: 1
Logstash startup completed
www.google.com
{
"message" => "www.google.com",
"@version" => "1",
"@timestamp" => "2018-05-22T13:03:48.940Z",
"host" => "node1"
}
www.elastic.co
{
"message" => "www.elastic.co",
"@version" => "1",
"@timestamp" => "2018-05-22T13:04:06.880Z",
"host" => "node1"
}
#使用logstash启动一个配置文件,会在elasticsearch中写一份
[root@node1 ~]# vim normal.conf
[root@node1 ~]# cat normal.conf
input { stdin { } }
output {
elasticsearch { hosts => ["localhost:9200"] }
stdout { codec => rubydebug }
}
[root@node1 ~]# /opt/logstash/bin/logstash -f normal.conf
OpenJDK 64-Bit Server VM warning: If the number of processors is expected to increase from one, then you should configure the number of parallel GC threads appropriately using -XX:ParallelGCThreads=N
Settings: Default filter workers: 1
Logstash startup completed
123 #输入
{
"message" => "123",
"@version" => "1",
"@timestamp" => "2018-05-22T13:33:38.994Z",
"host" => "node1"
}
学习编写conf格式
输入插件配置,此处以file为例,可以设置多个
input {
file {
path => "/var/log/messages"
type => "syslog"
}
file {
path => "/var/log/apache/access.log"
type => "apache"
}
}
介绍几种收集文件的方式,可以使用数组方式或者用匹配,也可以写多个path
path => ["/var/log/messages","/var/log/.log"]
path => ["/data/mysql/mysql.log"]
?设置boolean值
ssl_enable => true
?文件大小单位
my_bytes => "1113" # 1113 bytes
my_bytes => "10MiB" # 10485760 bytes
my_bytes => "100kib" # 102400 bytes
my_bytes => "180 mb" # 180000000 bytes
?jason收集?
codec => “json”
?hash收集
match => {
"field1" => "value1"
"field2" => "value2"
...
}
?端口
port => 33
?密码
my_password => "password"
收集系统日志的conf
通过input和output插件编写conf文件
[root@node1 ~]# cat system.conf
input {
file {
path => "/var/log/messages"
type => "system"
start_position => "beginning"
}
}
output {
elasticsearch {
hosts => ["192.168.137.52:9200"]
index => "system-%{+YYYY.MM.dd}"
}
}
点击数据浏览就看到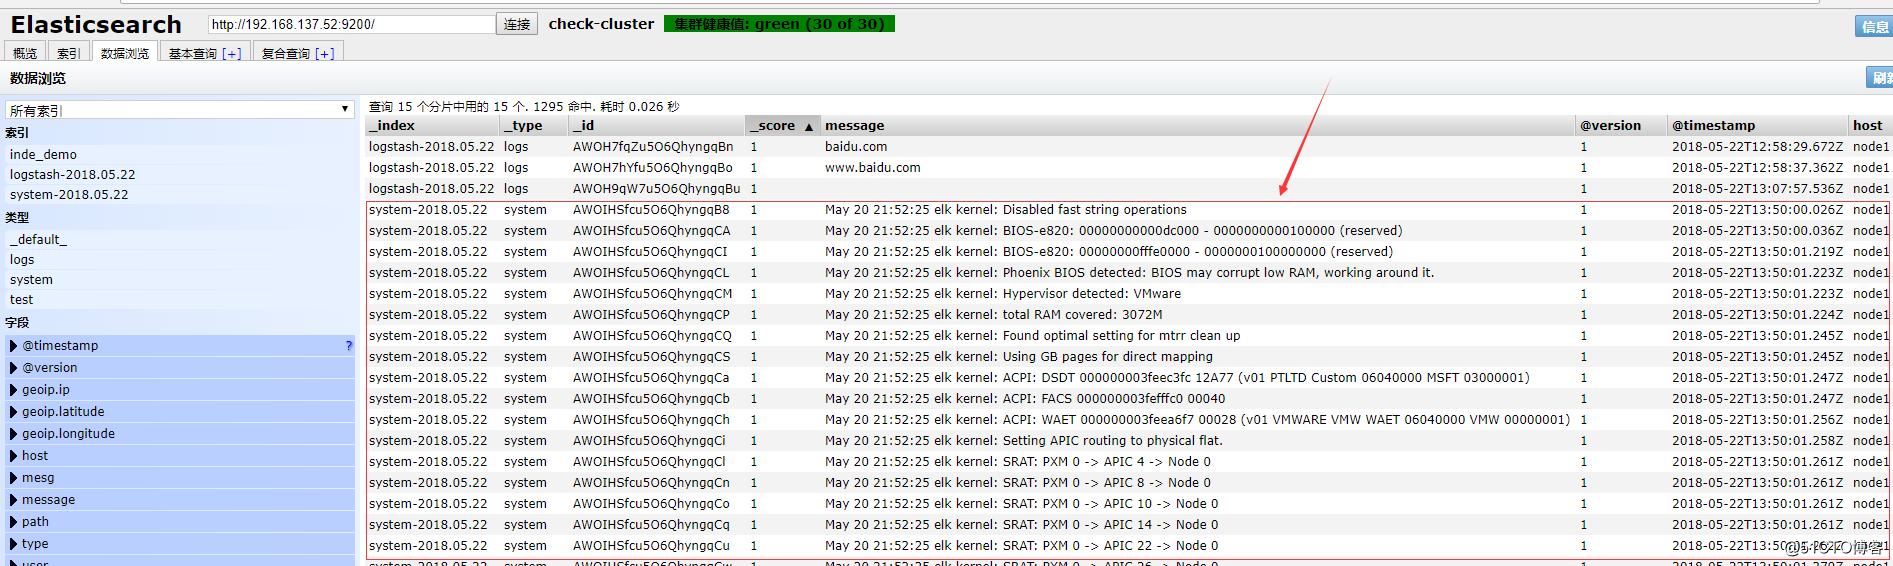
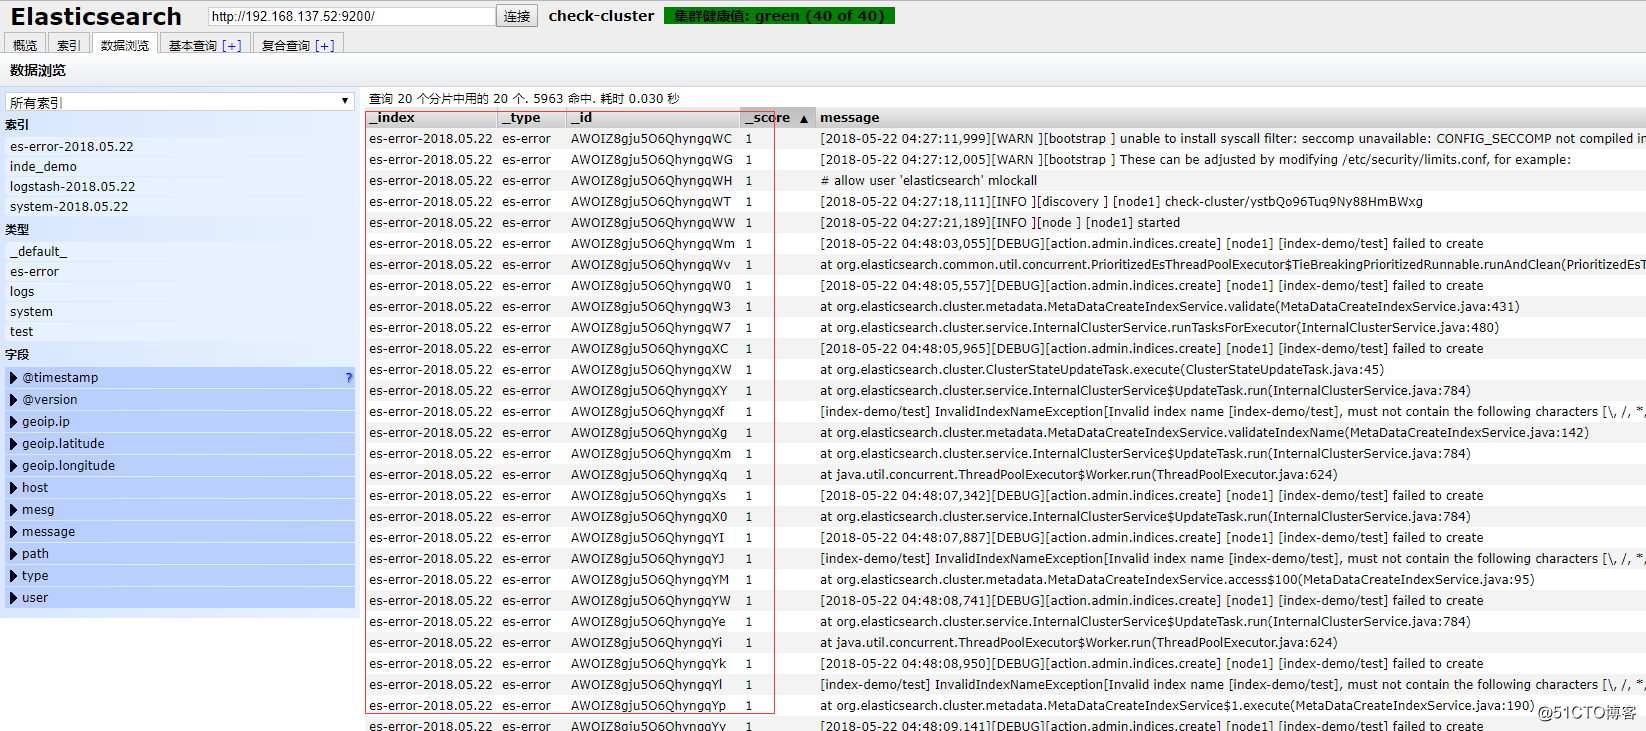
收集elasticsearch的error日志
此处把上个system日志和这个error(java程序日志)日志,放在一起。使用if判断,两种日志分别写到不同索引中.此处的type(固定的就是type,不可更改)不可以和日志格式的任何一个域(可以理解为字段)的名称重复,也就是说日志的域不可以有type这个名称
[root@node1 ~]# cat all.conf
input {
file {
path => "/var/log/messages"
type => "system"
start_position => "beginning"
}
file {
path => "/var/log/elasticsearch/check-cluster.log"
type => "es-error"
start_position => "beginning"
}
}
output {
if [type] == "system" {
    elasticsearch {
        hosts => ["192.168.137.52:9200"]
        index => "system-%{+YYYY.MM.dd}"
    }
}

if [type] == "es-error" {
    elasticsearch {
        hosts => ["192.168.137.52:9200"]
        index => "es-error-%{+YYYY.MM.dd}"
    }
}
}
把多行整个报错收集到一个事件中,举例说明
以at.org开头的内容都属于同一个事件,但是显示在不同行,这样的日志格式看起来很不方便,所以需要把他们合并到一个事件中,引入codec的multiline插件
官方文档提供
input {
stdin {
codec => multiline {pattern => "pattern, a regexp"<br/>negate => "true" or "false"<br/>what => "previous" or "next"
}
}
}
regrxp:使用正则,什么情况下把多行合并起来?
negate:正向匹配和反向匹配?
what:合并到当前行还是下一行?
在标准输入和标准输出中测试以证明多行收集到一个日志成功
[root@node1 ~]# cat muliline.conf
input {
stdin {
codec => multiline {
pattern => "^["
negate => true
what => "previous"
}
}
}
output {
stdout {
codec => "rubydebug"
}
}
[root@node1 ~]# /opt/logstash/bin/logstash -f muliline.conf
OpenJDK 64-Bit Server VM warning: If the number of processors is expected to increase from one, then you should configure the number of parallel GC threads appropriately using -XX:ParallelGCThreads=N
Settings: Default filter workers: 1
Logstash startup completed
[1
[2
{
"@timestamp" => "2018-05-22T15:53:07.756Z",
"message" => "[1",
"@version" => "1",
"host" => "node1"
}
[3
{
"@timestamp" => "2018-05-22T15:53:14.942Z",
"message" => "[2",
"@version" => "1",
"host" => "node1"
}
继续将上述实验结果放到all.conf的es-error索引中
[root@node1 ~]# cat all.conf
input {
file {
path => "/var/log/messages"
type => "system"
start_position => "beginning"
}
file {
    path => "/var/log/elasticsearch/check-cluster.log"
    type => "es-error"
    start_position => "beginning"
    codec => multiline {
        pattern => "^\["
        negate => true
        what => "previous"
    }
}
}
output {
if [type] == "system" {
    elasticsearch {
        hosts => ["192.168.137.52:9200"]
        index => "system-%{+YYYY.MM.dd}"
    }
}

if [type] == "es-error" {
    elasticsearch {
        hosts => ["192.168.137.52:9200"]
        index => "es-error-%{+YYYY.MM.dd}"
    }
}
}
[root@node1 ~]# /opt/logstash/bin/logstash -f all.conf
五.熟悉kibana
编辑kibana配置文件使其生效
[root@node1 ~]# vim /usr/local/kibana/config/kibana.yml
[root@node1 ~]# grep ‘^[a-Z]‘ /usr/local/kibana/config/kibana.yml
server.port: 5601 #端口
server.host: "0.0.0.0" #开启对外服务主机ip
elasticsearch.url: "http://192.168.137.52:9200" #填写浏览器访问elasticsearch的url
kibana.index: ".kibana" #在elasticsearch中添加.kibana索引
[root@node1 ~]# screen
[root@node1 ~]# /usr/local/kibana/bin/kibana
使用crtl +a+d退出screen
使用浏览器打开192.168.137.52:5601
验证logstash的muliline插件生效,在kibana中添加一个logstash索引,如果添加索引后,discover现在不了,删除新建索引,重新添加索引,并把前面俩个√都去掉就行了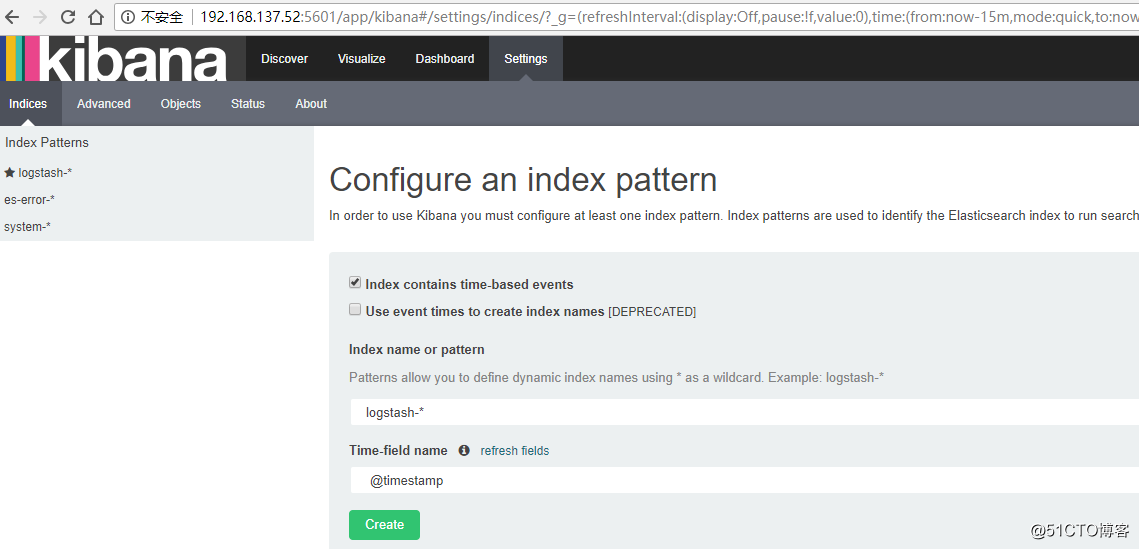
可以看到默认的字段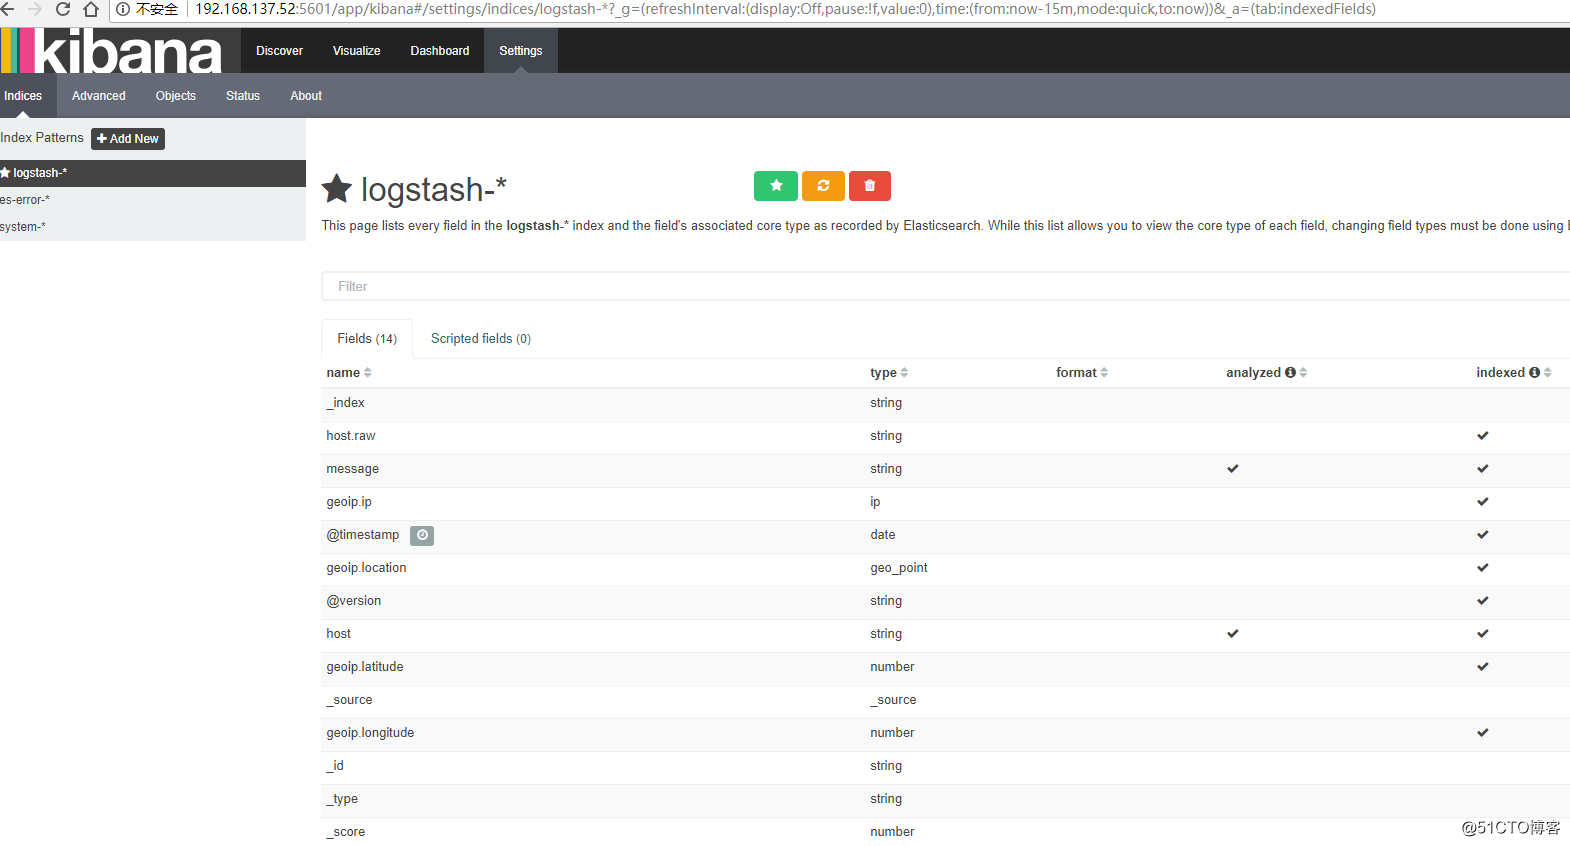
选择discover查看?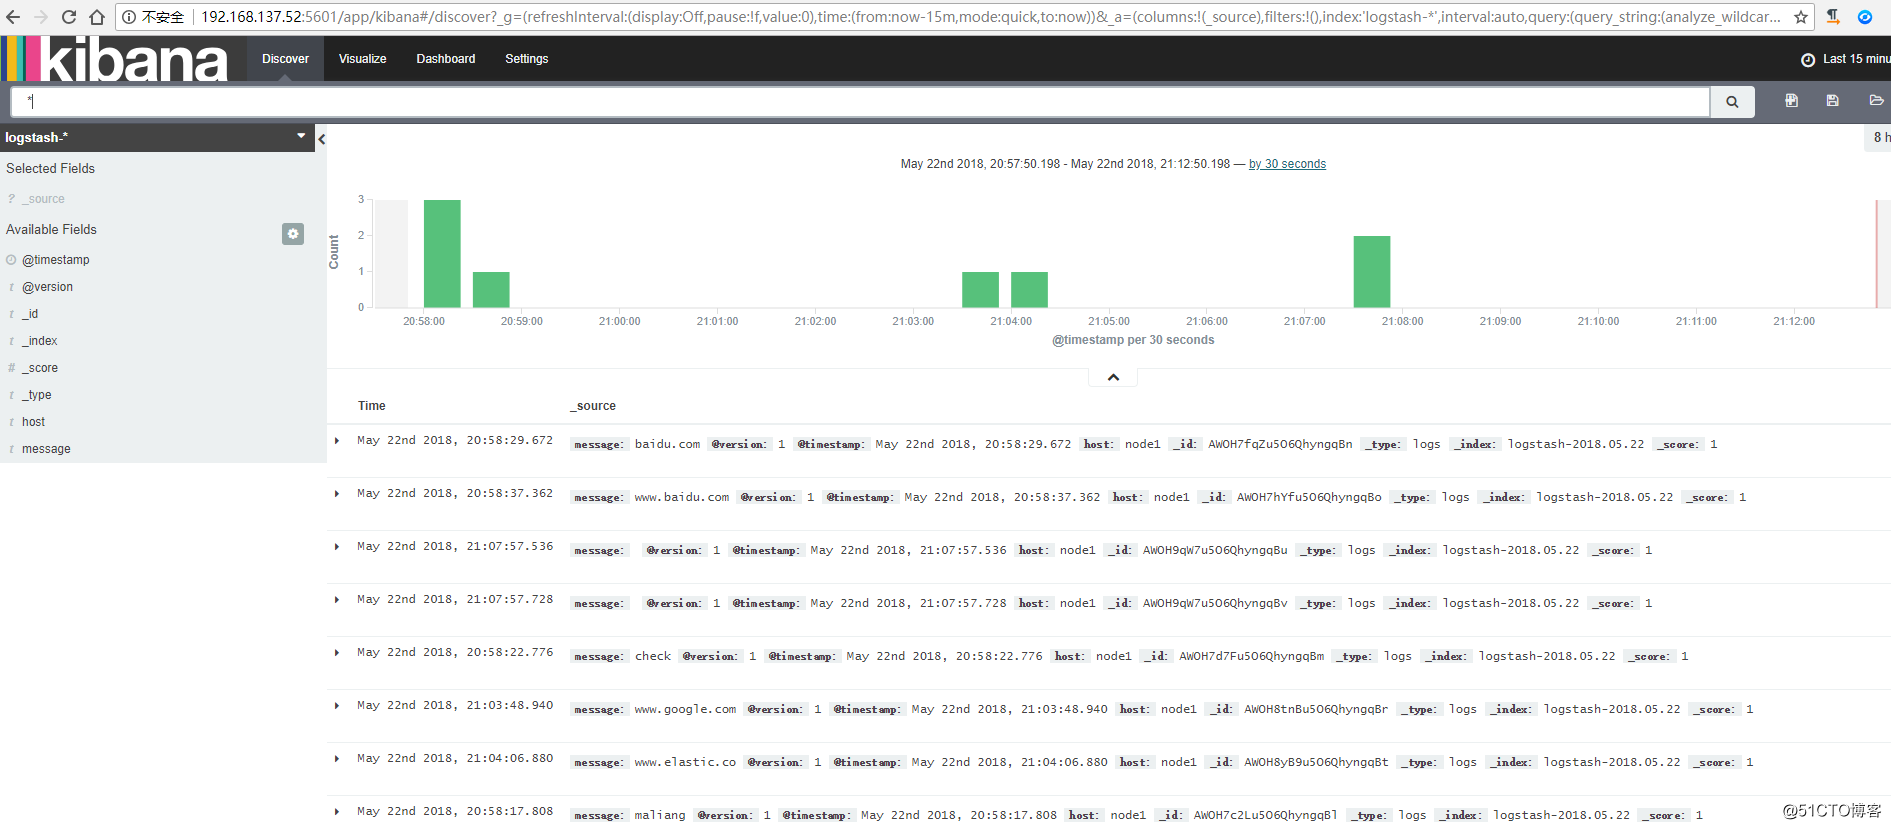
logstash收集nginx、syslog和tcp日志
收集nginx的访问日志
在这里使用codec的json插件将日志的域进行分段,使用key-value的方式,使日志格式更清晰,易于搜索,还可以降低cpu的负载?
更改nginx的配置文件的日志格式,使用json
[root@node1 ~]# sed -n ‘19,37p‘ /etc/nginx/nginx.conf
log_format main ‘$remote_addr - $remote_user [$time_local] "$request" ‘
‘$status $body_bytes_sent "$http_referer" ‘
‘"$http_user_agent" "$http_x_forwarded_for"‘;
log_format json ‘{ "@timestamp": "$time_local", ‘
‘"@fields": { ‘
‘"remote_addr": "$remote_addr", ‘
‘"remote_user": "$remote_user", ‘
‘"body_bytes_sent": "$body_bytes_sent", ‘
‘"request_time": "$request_time", ‘
‘"status": "$status", ‘
‘"request": "$request", ‘
‘"request_method": "$request_method", ‘
‘"http_referrer": "$http_referer", ‘
‘"body_bytes_sent":"$body_bytes_sent", ‘
‘"http_x_forwarded_for": "$http_x_forwarded_for", ‘
‘"http_user_agent": "$http_user_agent" } }‘;
access_log /var/log/nginx/access.log json;
[root@node1 ~]# nginx -t
nginx: the configuration file /etc/nginx/nginx.conf syntax is ok
nginx: configuration file /etc/nginx/nginx.conf test is successful
[root@node1 ~]# service nginx restart
[root@node1 ~]# netstat -ntupl |grep nginx
tcp 0 0 0.0.0.0:80 0.0.0.0: LISTEN 4091/nginx
tcp 0 0 :::80 ::: LISTEN 4091/nginx
日志格式显示如下:
浏览器输入:192.168.137.52 连续刷新就有日志出现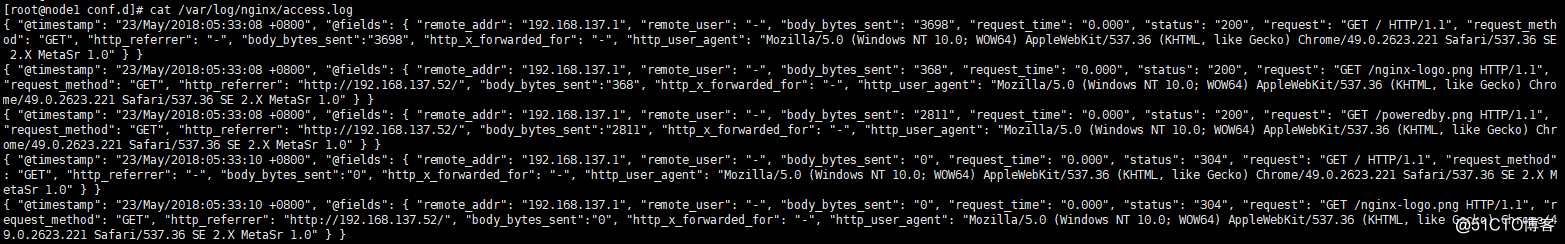
使用logstash将nginx访问日志收集起来,继续写到all.conf中
[root@node1 ~]# cat all.conf
input {
file {
path => "/var/log/messages"
type => "system"
start_position => "beginning"
}
file {
    path => "/var/log/elasticsearch/check-cluster.log"
    type => "es-error"
    start_position => "beginning"
    codec => multiline {
        pattern => "^\["
        negate => true
        what => "previous"
    }
}
   file {
    path => "/var/log/nginx/access_json.log"
    codec => json
    start_position => "beginning"
    type => "nginx-log"
}
}
output {
if [type] == "system" {
    elasticsearch {
        hosts => ["192.168.137.52:9200"]
        index => "system-%{+YYYY.MM.dd}"
    }
}

if [type] == "es-error" {
    elasticsearch {
        hosts => ["192.168.137.52:9200"]
        index => "es-error-%{+YYYY.MM.dd}"
    }
}
 if [type] == "nginx-log" {
    elasticsearch {
        hosts => ["192.168.137.52:9200"]
        index => "nginx-log-%{+YYYY.MM.dd}"
    }
}
}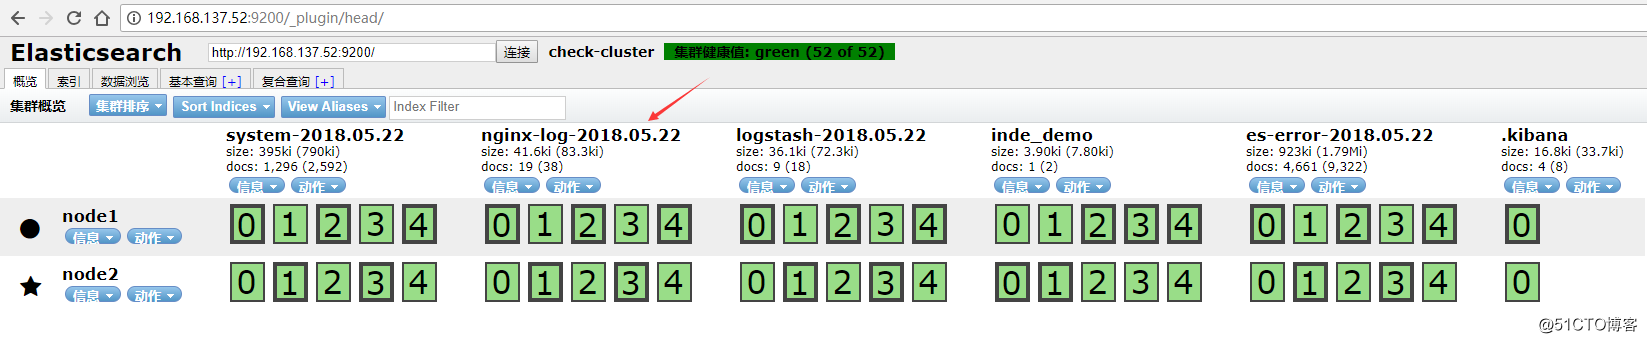
将nginx-log加入kibana中并显示?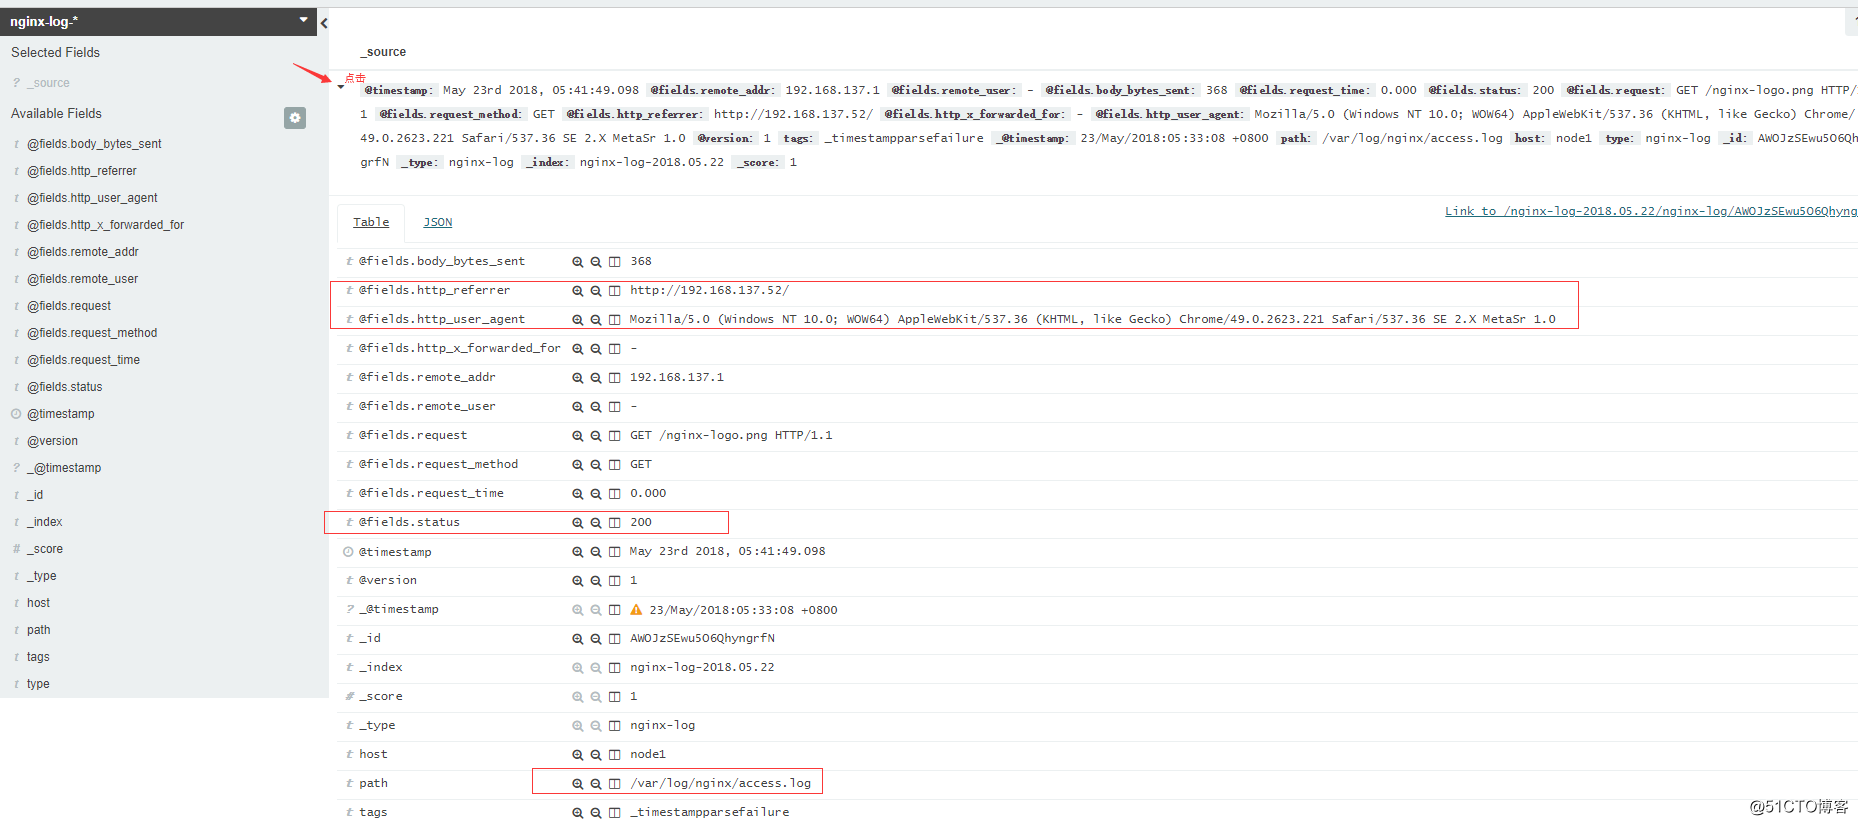
收集系统syslog日志,前文中已经使用文件file的形式收集了系统日志/var/log/messages,但是实际生产环境是需要使用syslog插件直接收集?,修改syslog的配置文件,把日志信息发送到514端口上
[root@node1 ~]# vim /etc/rsyslog.conf
. @@192.168.137.52:514
[root@node1 ~]# /etc/init.d/rsyslog restart
[root@node1 ~]# cat all.conf
input {
syslog {
type => "system-syslog"
host => "192.168.137.52"
port => "514"
}
file {
path => "/var/log/messages"
type => "system"
start_position => "beginning"
}
file {
    path => "/var/log/elasticsearch/check-cluster.log"
    type => "es-error"
    start_position => "beginning"
    codec => multiline {
        pattern => "^\["
        negate => true
        what => "previous"
    }
}
   file {
    path => "/var/log/nginx/access_json.log"
    codec => json
    start_position => "beginning"
    type => "nginx-log"
}
}
output {
if [type] == "system" {
    elasticsearch {
        hosts => ["192.168.137.52:9200"]
        index => "system-%{+YYYY.MM.dd}"
    }
}

if [type] == "es-error" {
    elasticsearch {
        hosts => ["192.168.137.52:9200"]
        index => "es-error-%{+YYYY.MM.dd}"
    }
}
 if [type] == "nginx-log" {
    elasticsearch {
        hosts => ["192.168.137.52:9200"]
        index => "nginx-log-%{+YYYY.MM.dd}"
    }
}
   if [type] == "system-syslog" {
    elasticsearch {
        hosts => ["192.168.137.52:9200"]
        index => "system-syslog-%{+YYYY.MM.dd}"
    }
}
}
[root@node1 ~]# /opt/logstash/bin/logstash -f all.conf
在elasticsearch插件中就可见到增加的system-syslog索引?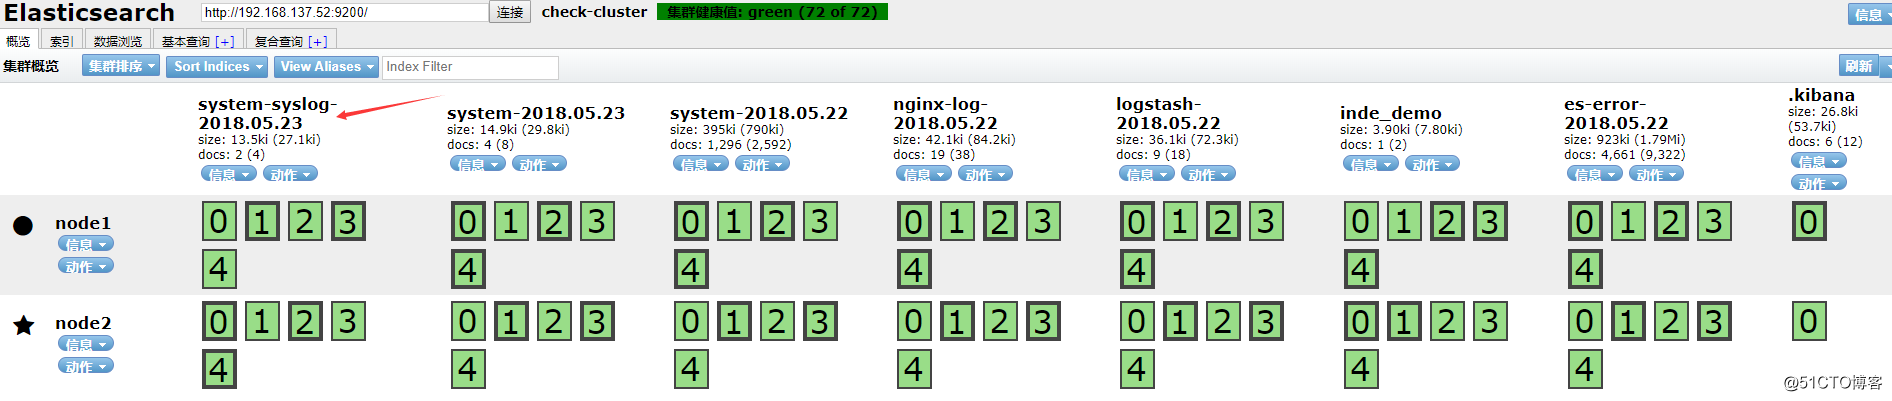
使用redis收集logstash的信息,修改redis的配置文件并启动redis
[root@node1 ~]# vim /etc/redis.conf
bind 192.168.137.52
daemonize yes
[root@node1 ~]# /etc/init.d/redis start
[root@node1 ~]# netstat -ntupl|grep redis
tcp 0 0 192.168.137.52:6379 0.0.0.0: LISTEN 5031/redis-server 1
编写redis.conf
[root@node1 ~]# cat redis-out.conf
input{
stdin{
}
}
output{
redis{
host => "192.168.137.52"
port => "6379"
db => "6"
data_type => "list" # 数据类型为list
key => "demo"
}
}
启动配置文件输入信息
[root@node1 ~]# /opt/logstash/bin/logstash -f redis-out.conf
OpenJDK 64-Bit Server VM warning: If the number of processors is expected to increase from one, then you should configure the number of parallel GC threads appropriately using -XX:ParallelGCThreads=N
Settings: Default filter workers: 1
Logstash startup completed
check
www.uc123.com
使用redis-cli连接到redis并查看输入的信息
[root@node1 ~]# redis-cli -h 192.168.137.52
192.168.137.52:6379> select 6
OK
192.168.137.52:6379[6]> keys
1) "demo"
192.168.137.52:6379[6]> keys *
1) "demo"
192.168.137.52:6379[6]> lindex demo -2br/>"{\"message\":\"check\",\"@version\":\"1\",\"@timestamp\":\"2018-05-24T00:15:25.758Z\",\"host\":\"node1\"}"
192.168.137.52:6379[6]> lindex demo -1br/>"{\"message\":\"www.uc123.com\",\"@version\":\"1\",\"@timestamp\":\"2018-05-24T00:15:31.878Z\",\"host\":\"node1\"}"
192.168.137.52:6379[6]>
为了下一步写input插件到把消息发送到elasticsearch中,多在redis中写入写数据
[root@node1 ~]# /opt/logstash/bin/logstash -f redis-out.conf
OpenJDK 64-Bit Server VM warning: If the number of processors is expected to increase from one, then you should configure the number of parallel GC threads appropriately using -XX:ParallelGCThreads=N
Settings: Default filter workers: 1
Logstash startup completed
check
www.uc123.com
a
b
c
d
e
f
g
h
i
j
k
l
m
n
o
p
q
r
s
t
u
v
w
x
y
z
查看redis中名字为demo的key长度
192.168.137.52:6379[6]> llen demo
(integer) 28
使用redis发送消息到elasticsearch中,编写redis-in.conf
[root@node1 ~]# cat redis-in.conf
input{
redis {
host => "192.168.137.52"
port => "6379"
db => "6"
data_type => "list"
key => "demo"
}
}
output{
elasticsearch {
hosts => ["192.168.137.52:9200"]
index => "redis-demo-%{+YYYY.MM.dd}"
}
}
启动配置文件
[root@node1 ~]# /opt/logstash/bin/logstash -f redis-in.conf
OpenJDK 64-Bit Server VM warning: If the number of processors is expected to increase from one, then you should configure the number of parallel GC threads appropriately using -XX:ParallelGCThreads=N
Settings: Default filter workers: 1
Logstash startup completed
不断刷新demo这个key的长度(读取很快,刷新一定要速度)
192.168.137.52:6379[6]> llen demo
(integer) 24
192.168.137.52:6379[6]> llen demo
(integer) 24
192.168.137.52:6379[6]> llen demo
(integer) 23
192.168.137.52:6379[6]> llen demo
(integer) 3
192.168.137.52:6379[6]> llen demo
(integer) 3
192.168.137.52:6379[6]> llen demo
(integer) 3
192.168.137.52:6379[6]> llen demo
(integer) 3
192.168.137.52:6379[6]> llen demo
(integer) 0
192.168.137.52:6379[6]> llen demo
(integer) 0
在elasticsearch中查看增加了redis-demo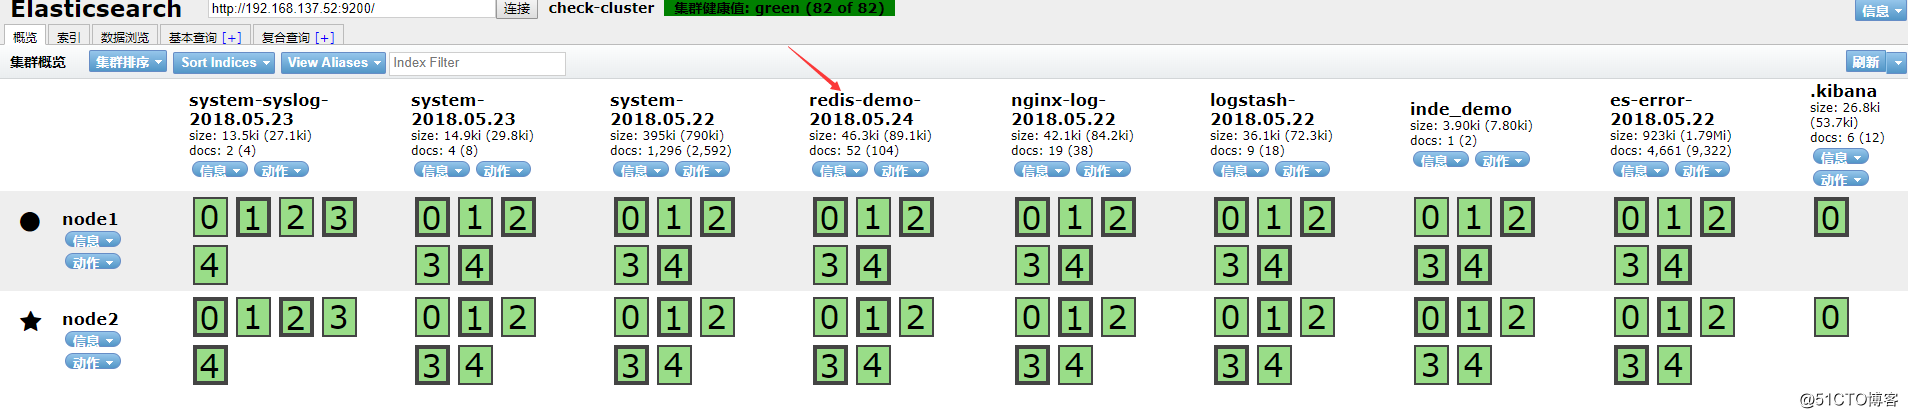
将all.conf的内容改为经由redis,编写shipper.conf作为redis收集logstash配置文件
[root@node1 ~]# cp all.conf shipper.conf
[root@node1 ~]# vim shipper.conf
input {
syslog {
type => "system-syslog"
host => "192.168.137.52"
port => "514"
}
tcp {
type => "tcp-6666"
host => "192.168.137.52"
port => "6666"
}
file {
path => "/var/log/messages"
type => "system"
start_position => "beginning"
}
file {
path => "/var/log/nginx/access_json.log"
codec => json
start_position => "beginning"
type => "nginx-log"
}
file {
path => "/var/log/elasticsearch/check-cluster.log"
type => "es-error"
start_position => "beginning"
codec => multiline {
pattern => "^["
negate => true
what => "previous"
}
}
}
output {
if [type] == "system" {
redis {
host => "192.168.137.52"
port => "6379"
db => "6"
data_type => "list"
key => "system"
}
}
if [type] == "es-error" {
redis {
host => "192.168.137.52"
port => "6379"
db => "6"
data_type => "list"
key => "es-error"
}
}
if [type] == "nginx-log" {
redis {
host => "192.168.137.52"
port => "6379"
db => "6"
data_type => "list"
key => "nginx-log"
}
}
if [type] == "system-syslog" {
redis {
host => "192.168.137.52"
port => "6379"
db => "6"
data_type => "list"
key => "system-syslog"
}
}
if [type] == "tcp-6666" {
redis {
host => "192.168.137.52"
port => "6379"
db => "6"
data_type => "list"
key => "tcp-6666"
}
}
}
在redis中查看keys
[root@node1 ~]# redis-cli -h 192.168.137.52
192.168.137.52:6379> select 6
OK
192.168.137.52:6379[6]> keys *
1) "system-syslog"
2) "es-error"
3) "system"
编写indexer.conf作为redis发送elasticsearch配置文件
[root@node1 ~]# cat indexer.conf
input {
redis {
type => "system-syslog"
host => "192.168.137.52"
port => "6379"
db => "6"
data_type => "list"
key => "system-syslog"
}
redis {
type => "tcp-6666"
host => "192.168.137.52"
port => "6379"
db => "6"
data_type => "list"
key => "tcp-6666"
}
redis {
type => "system"
host => "192.168.137.52"
port => "6379"
db => "6"
data_type => "list"
key => "system"
}
redis {
type => "nginx-log"
host => "192.168.137.52"
port => "6379"
db => "6"
data_type => "list"
key => "nginx-log"
}
redis {
type => "es-error"
host => "192.168.137.52"
port => "6379"
db => "6"
data_type => "list"
key => "es-error"
}
}
output {
if [type] == "system" {
elasticsearch {
hosts => "192.168.137.52"
index => "system-%{+YYYY.MM.dd}"
}
}
if [type] == "es-error" {
elasticsearch {
hosts => "192.168.137.52"
index => "es-error-%{+YYYY.MM.dd}"
}
}
if [type] == "nginx-log" {
elasticsearch {
hosts => "192.168.137.52"
index => "nginx-log-%{+YYYY.MM.dd}"
}
}
if [type] == "system-syslog" {
elasticsearch {
hosts => "192.168.137.52"
index => "system-syslog-%{+YYYY.MM.dd}"
}
}
if [type] == "tcp-6666" {
elasticsearch {
hosts => "192.168.137.52"
index => "tcp-6666-%{+YYYY.MM.dd}"
}
}
}
启动shipper.conf
[root@node1 ~]# /opt/logstash/bin/logstash -f shipper.conf
Settings: Default filter workers: 1
由于日志量小,很快就会全部被发送到elasticsearch,key也就没了,所以多写写数据到日志中
[root@node1 ~]# for n in seq 10000 ;do echo $n >>/var/log/elasticsearch/check-cluster.log;done
[root@node1 ~]# for n in seq 10000 ;do echo $n >>/var/log/nginx/access.log;done
access.log
[root@node1 ~]# for n in seq 10000 ;do echo $n >>/var/log/nginx/access.log;done
[root@node1 ~]# for n in seq 10000 ;do echo $n >>/var/log/messages;done
查看key的长度看到key在增长
192.168.137.52:6379[6]> llen system
(integer) 24546
192.168.137.52:6379[6]> llen system
(integer) 30001
启动indexer.conf
[root@node1 ~]# /opt/logstash/bin/logstash -f indexer.conf
#查看key的长度看到key在减小
192.168.137.52:6379[6]> llen system
(integer) 29990
192.168.137.52:6379[6]> llen system
(integer) 29958
192.168.137.52:6379[6]> llen system
(integer) 29732
学习logstash的fliter插件, 熟悉grok
filter插件有很多,在这里就学习grok插件,使用正则匹配日志里的域来拆分。在实际生产中,apache日志不支持jason,就只能使用grok插件匹配;mysql慢查询日志也是无法拆分,只能使用grok正则表达式匹配拆分。?
在如下链接,github上有很多写好的grok模板,可以直接引用?
https://github.com/logstash-plugins/logstash-patterns-core/blob/master/patterns/grok-patterns?
在装好的logstash中也会有grok匹配规则,直接可以引用,路径如下
[root@node1 patterns]# pwd
/opt/logstash/vendor/bundle/jruby/1.9/gems/logstash-patterns-core-2.0.2/patterns
根据官方文档提供的编写grok.conf
[root@node1 ~]# cat grok.conf
input {
stdin {}
}
filter {
grok {
match => { "message" => "%{IP:client} %{WORD:method} %{URIPATHPARAM:request} %{NUMBER:bytes} %{NUMBER:duration}" }
}
}
output {
stdout {
codec => "rubydebug"
}
}
启动logstash,并根据官方文档提供输入,可得到拆分结果如下显示?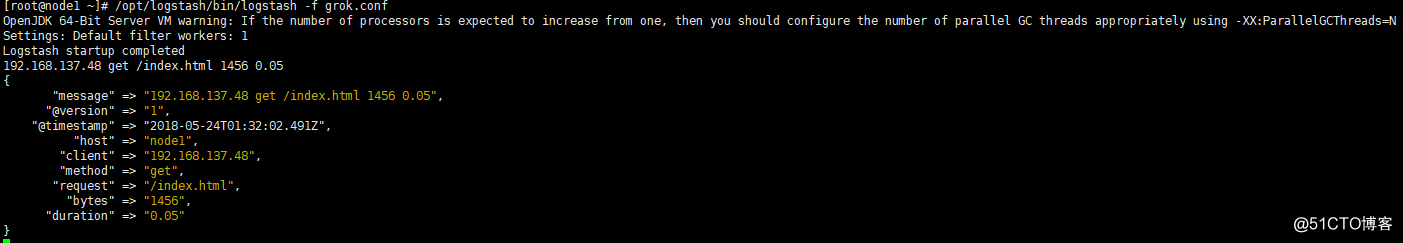
使用logstash收集mysql慢查询日志
开启慢查询日志
mysql> set global slow_query_log=ON;
mysql> set global slow_query_time=2;
查看
show variables like "%slow%";
倒入生产中mysql的slow日志,示例格式如下:
SET timestamp=1527172087;
select sleep(20);
使用multiline处理,并编写slow.conf
[root@node1 ~]# cat mysql-slow.conf
input{
file {
path => "/var/lib/mysql/node1-slow.log"
type => "mysql-slow-log"
start_position => "beginning"
codec => multiline {
pattern => "^# User@Host:"
negate => true
what => "previous"
}
}
}
filter {
grok {
match => { "message" =>"SELECT SLEEP" }
add_tag => [ "sleep_drop" ]
tag_on_failure => [] # prevent default _grokparsefailure tag on real records
}
if "sleep_drop" in [tags] {
drop {}
}
grok {
match => [ "message", "(?m)^# User@Host: %{USER:user}[[^]]+] @ (?:(?<clienthost>\S) )?[(?:%{IP:clientip})?]\s+Id: %{NUMBER:row_id:int}\s# Query_time: %{NUMBER:query_time:float}\s+Lock_time: %{NUMBER:lock_time:float}\s+Rows_sent: %{NUMBER:rows_sent:int}\s+Rows_examined: %{NUMBER:rows_examined:int}\s(?:use %{DATA:database};\s)?SET timestamp=%{NUMBER:timestamp};\s(?<query>(?<action>\w+)\s+.)\n#\s*" ]
}
date {
match => [ "timestamp", "UNIX" ]
remove_field => [ "timestamp" ]
}
}
output {
stdout{
codec => "rubydebug"
}
}
执行该配置文件,查看grok正则匹配结果?
[root@node1 ~]# /opt/logstash/bin/logstash -f mysql-slow.conf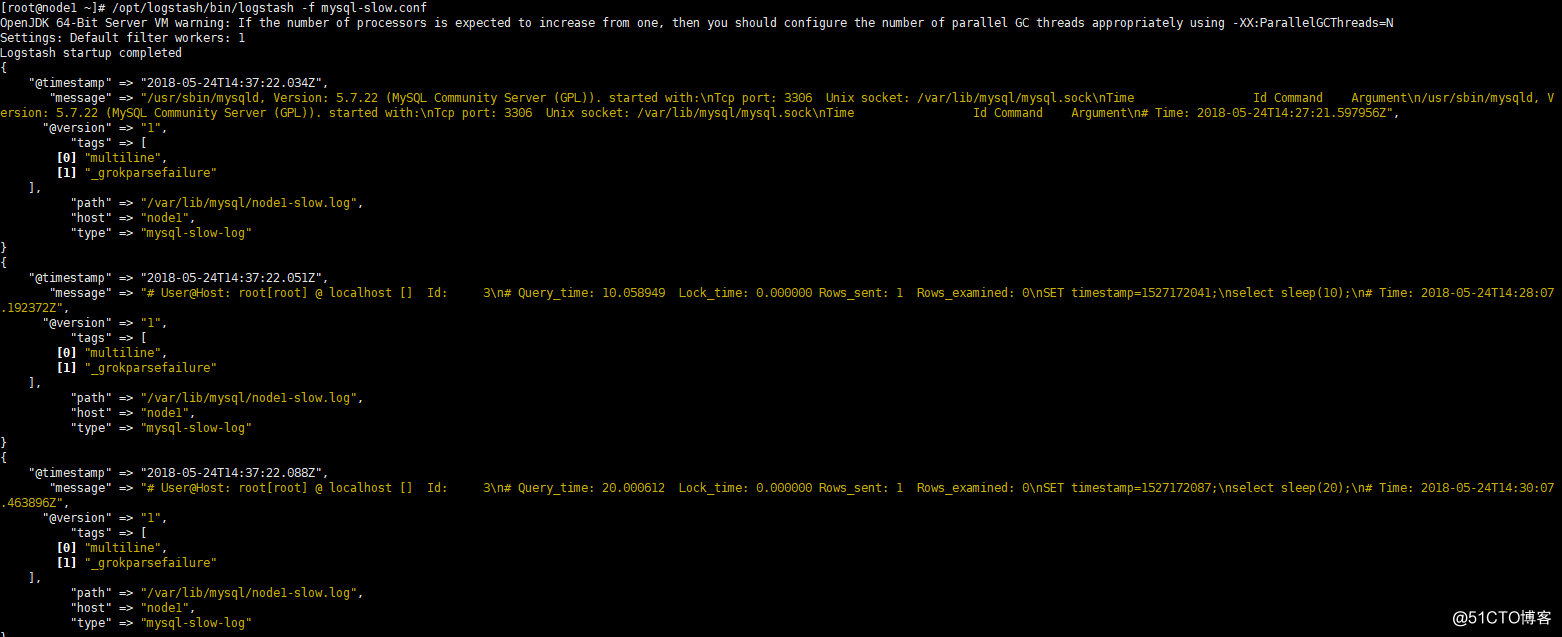
生产如何上线ELK。
日志分类
系统日志 rsyslog logstash syslog插件
访问日志 nginx logstash codec json
错误日志 file logstash file+ mulitline
运行日志 file logstash codec json
设备日志 syslog logstash syslog插件
debug日志 file logstash json or mulitline
日志标准化
1)路径固定标准化
2)格式尽量使用json
日志收集步骤
系统日志开始->错误日志->运行日志->访问日志?
注意
logstash 配置文件里不能有特殊符号
原文地址:http://blog.51cto.com/8999a/2119865