标签:port plt 根据 and print lag 随机数 取数 随机数组
import numpy as np x=np.random.randint(1,100,[20,1]) #在1-100范围中产生20行1列的随机数组 y=np.zeros(20) k=3
#取数据中k个对象为初始中心,每个对象代表一个聚类中心 def initcenter(x,k): return x[:k] kc=initcenter(x,k) kc
#对于样本中的数据对象,根据它们与这些聚类中心的欧氏距离,按距离最近的准则将它们分到距离它们最近的聚类中心(最相似)所对应的类; def nearest(kc,i): #数组中的值,与聚类中心最小距离所在类别的索引号 d=(abs(kc-i)) w=np.where(d==np.min(d)) return w[0][0] def xclassify(x,y,kc): #对每个数据进行循环,将分类的结果放进对应y位置中 for i in range(x.shape[0]): y[i]=nearest(kc,x[i]) return y
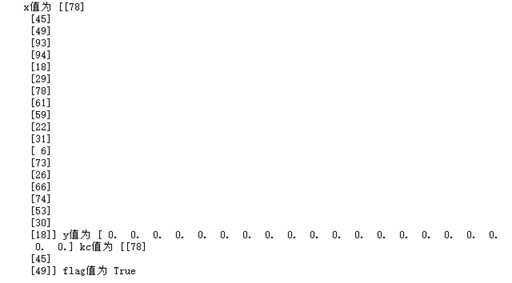
#更新聚类中心:将每个类别中所有对象所对应的均值作为该类别的聚类中心,计算目标函数的值; def kcmean(x,y,kc,k): l=list(kc) flag=False for c in range(k): print(c) m=np.where(y==c) print(m,x[m]) n=np.mean(x[m]) print(kc[c],n) if l[c]!=n: kc[c]=n #这个值没赋上 print(type(kc),kc[c]) l[c]=n flag=True #聚类中心发生变化 print(l,flag) return(np.array(l),flag) flag=True print("x值为",x,"y值为",y,"kc值为",kc,"flag值为",flag)
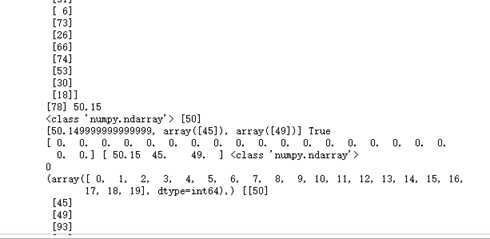
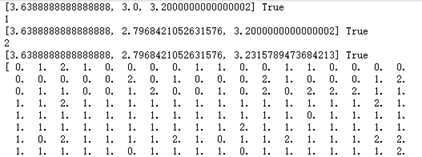
#判断聚类中心和目标函数的值是否发生改变,若不变,则输出结果,若改变,则返回2) while flag: y = xclassify(x,y,kc) kc, flag = kcmean(x,y,kc,k) print(y,kc,type(kc)) print(x,y)
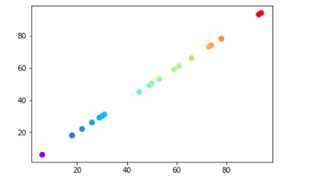
#鸢尾花花瓣长度数据做聚类并用散点图显示 import matplotlib.pyplot as plt plt.scatter(x,x,c=x,s=50,cmap="rainbow"); plt.show()
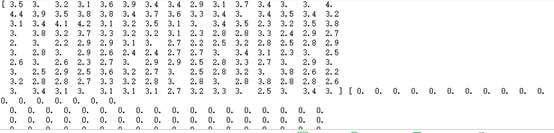
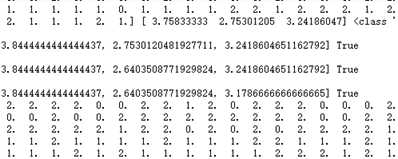
#鸢尾花花瓣长度数据做聚类并用散点图显示。 import numpy as np from sklearn.datasets import load_iris iris=load_iris() x=iris.data[:,1] y=np.zeros(150) def initcenter(x,k): #初始聚类中心数组 return x[0:k].reshape(k) def nearest(kc,i): #数组中的值,与聚类中心最小距离所在类别的索引号 d = (abs(kc-i)) w = np.where(d == np.min(d)) return w[0][0] def xclassify(x,y,kc): for i in range(x.shape[0]): #对数组的每个值进行分类,shape[0]读取矩阵第一维度的长度 y[i] = nearest(kc,x[i]) return y def kcmean(x,y,kc,k): #计算各聚类新均值 l = list(kc) flag = False for c in range(k): print(c) m = np.where(y == c) n=np.mean(x[m]) if l[c] != n: l[c] = n flag = True #聚类中心发生变化 print(l,flag) return (np.array(l),flag) k = 3 kc = initcenter(x,k) flag = True print(x,y,kc,flag)
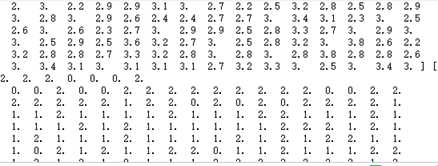
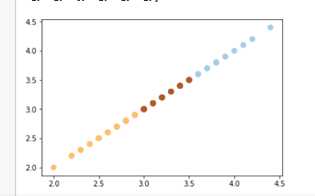
#判断聚类中心和目标函数的值是否发生改变,若不变,则输出结果,若改变,则返回2 while flag: y = xclassify(x,y,kc) kc, flag = kcmean(x,y,kc,k) print(y,kc,type(kc)) print(x,y) import matplotlib.pyplot as plt plt.scatter(x,x,c=y,s=50,cmap="Paired"); plt.show()
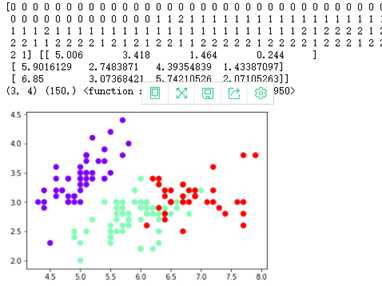
#用sklearn.cluster.KMeans,鸢尾花花瓣长度数据做聚类并用散点图显示 import matplotlib.pyplot as plt import numpy as np from sklearn.datasets import load_iris iris = load_iris() X = iris.data X from sklearn.cluster import KMeans est = KMeans(n_clusters = 3) est.fit(X) kc = est.cluster_centers_ y_kmeans = est.predict(X) #预测每个样本的聚类索引 print(y_kmeans,kc) print(kc.shape,y_kmeans.shape,np.shape) plt.scatter(X[:,0],X[:,1],c=y_kmeans,s=50,cmap=‘rainbow‘); plt.show()
聚类--K均值算法:自主实现与sklearn.cluster.KMeans调用
标签:port plt 根据 and print lag 随机数 取数 随机数组
原文地址:https://www.cnblogs.com/h000/p/9865044.html