标签:dll show rac storm out 通过 profiler struct collect
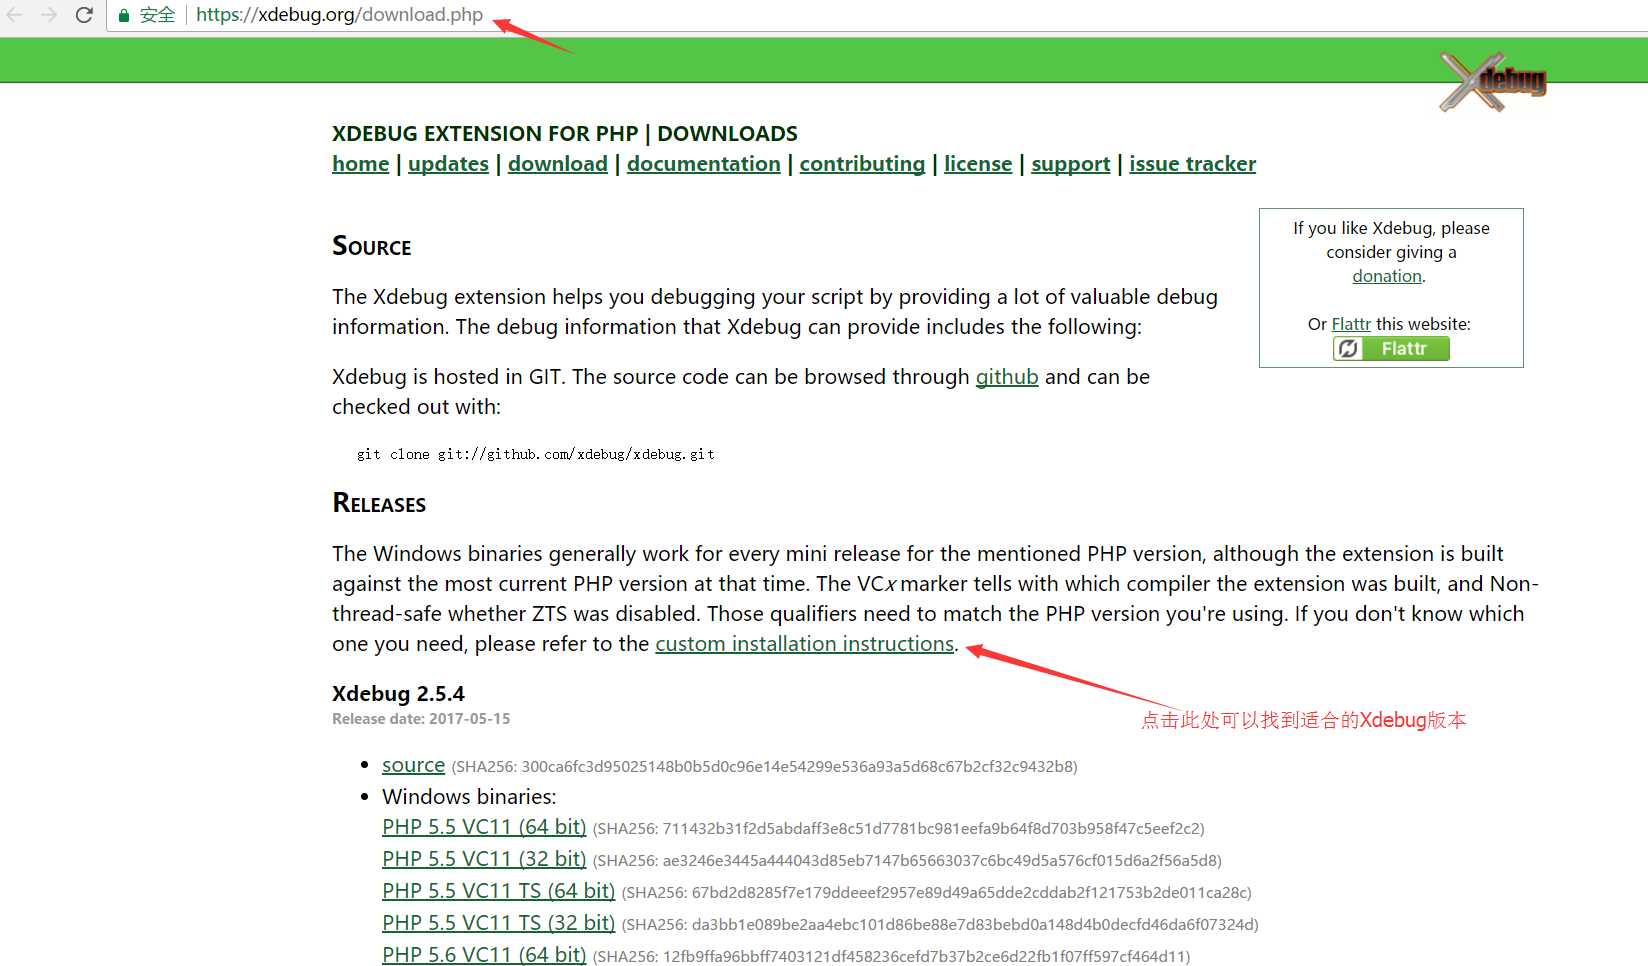
Xdebug安装地址https://xdebug.org/download.php,进入下载页面后点击custom installation instructions,可以找到适合的Xdebug版本。
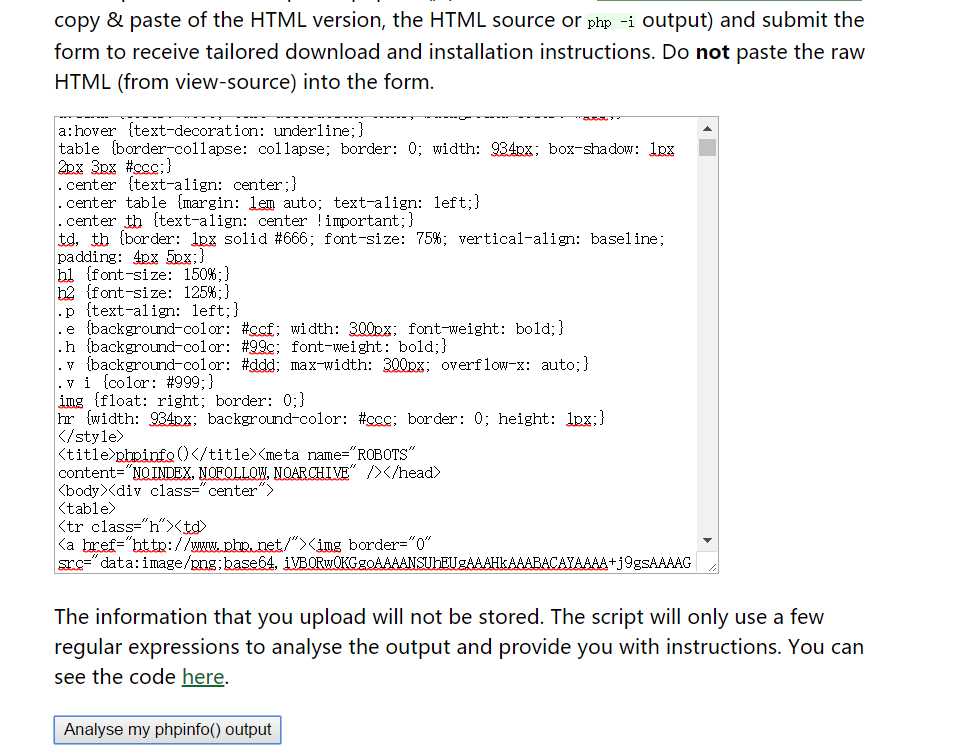
如果你点击了custom installation instructions,会进入下面的页面,把本地运行phpinfo()后的页面的html源代码复制粘贴到输入框,点击下面的Analyse my phpinfo() output提交即可。
会跳到类似这样的页面,因为我已经安装,所以显示XDEBUG版本
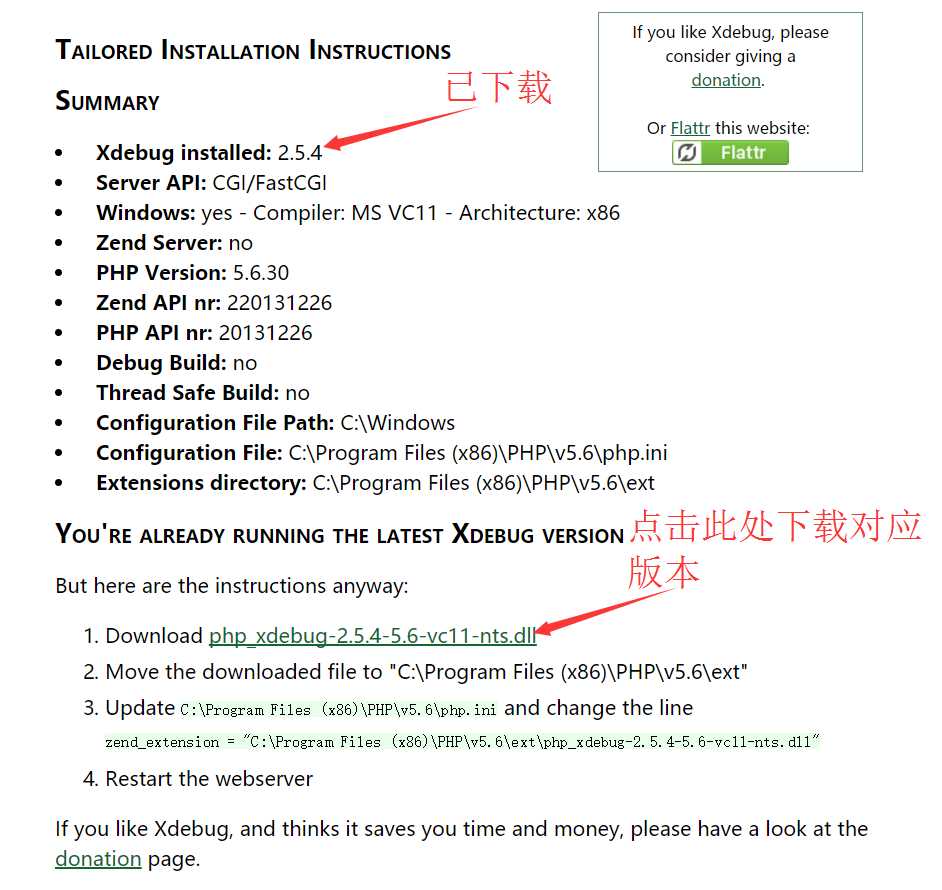
1.下载php_xdebug-2.5.4-5.6-vc11-nts.dll
2.将下载的文件移动到“C:\ Program Files(x86)\ PHP \ v5.6 \ ext”
3.更新C:\Program Files (x86)\PHP\v5.6\php.ini并更改行zend_extension = "C:\Program Files (x86)\PHP\v5.6\ext\php_xdebug-2.5.4-5.6-vc11-nts.dll"
4.重新启动网络服务器
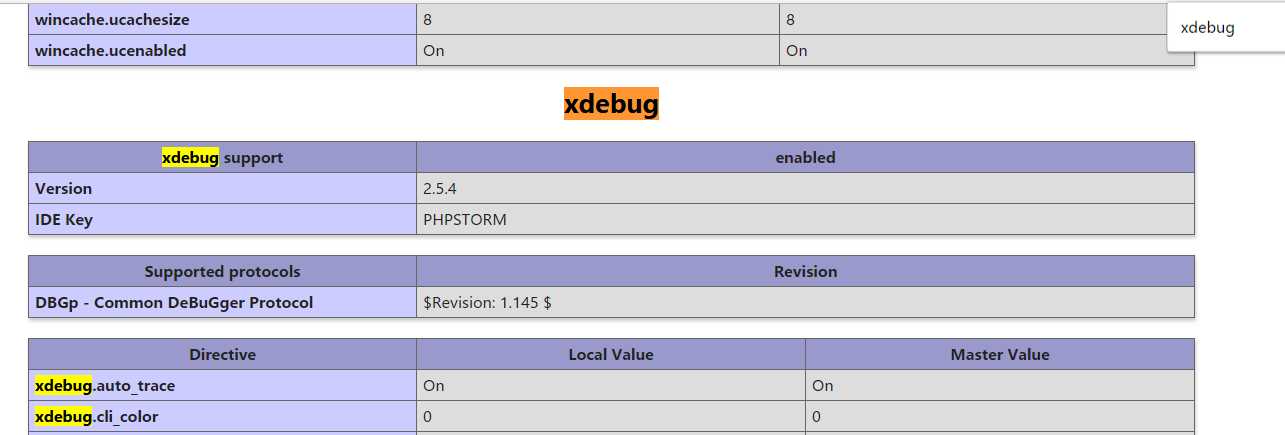
通过phpinfo()可以看到xdebug已安装!!!
附上本人在php.ini的XDebug的配置信息
|
1
2
3
4
5
6
7
8
9
10
11
12
13
14
15
16
17
18
19
20
21
22
23
24
25
26
27
28
29
30
31
|
[XDebug];调试功能模块儿;extension=php_xdebug-2.2.5-5.3-vc9.dllzend_extension = "C:\Program Files (x86)\PHP\v5.6\ext\php_xdebug-2.5.4-5.6-vc11-nts.dll"xdebug.remote_handler=dbgpxdebug.idekey=PHPSTORM;开启远程调试xdebug.remote_enable = On;远程主机xdebug.remote_host=localhost;主机端口xdebug.remote_port=9001;开启自动跟踪xdebug.auto_trace = On;开启异常跟踪xdebug.show_exception_trace = On;开启远程调试自动启动xdebug.remote_autostart = On;收集变量xdebug.collect_vars = On;收集返回值xdebug.collect_return = On;收集参数xdebug.collect_params = On;临时跟踪信息输出;xdebug.trace_output_dir="d:/PHP/php-5.3.28/temp";显示局部变量xdebug.show_local_vars = Onxdebug.profiler_enable = On;xdebug.profiler_output_dir ="d:/PHP/php-5.3.28/temp"xdebug.trace_enable_trigger =On |
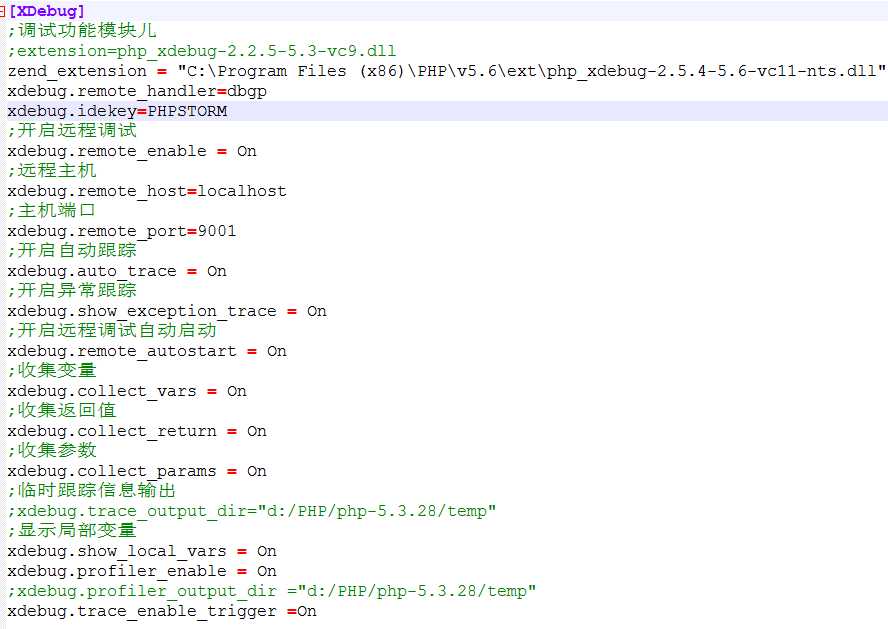
主机端口 xdebug.remote_port=9001
编辑器key xdebug.idekey=PHPSTORM
这两个这么配置是为了避免与fpm冲突和后面与phpstorm一同使用
phpstorm配置Xdebug链接:http://www.cnblogs.com/cxscode/p/7045944.html
版权声明:本文为博主原创文章,未经博主允许不得转载。
Xdebug安装对应版本与配置 - cxscode - 博客园
标签:dll show rac storm out 通过 profiler struct collect
原文地址:https://www.cnblogs.com/wzjwffg/p/9883790.html