标签:app dde linu ppm 额外 path conf host port
Prometheus对Windows有相关的支持 下载地址:https://prometheus.io/download/
wget https://github.com/prometheus/prometheus/releases/download/v2.5.0/prometheus-2.5.0.linux-amd64.tar.gz
如果需要也可以下载其他组件支持
解压安装:
tar -xvf prometheus-2.5.0.linux-amd64.tar.gz
查看配置:cd /目录查看配置
cd prometheus-2.5.0.linux-amd64
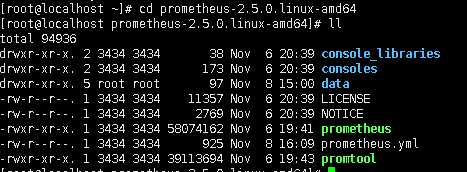
配置如下:
# my global config
global:
  scrape_interval:    15s # Set the scrape interval to every 15 seconds. Default is every 1 minute.
  evaluation_interval: 15s # Evaluate rules every 15 seconds. The default is every 1 minute.
  # scrape_timeout is set to the global default (10s).

# Alertmanager configuration
alerting:
  alertmanagers:
  - static_configs:
    - targets:
      # - alertmanager:9093

# Load rules once and periodically evaluate them according to the global ‘evaluation_interval‘.
rule_files:
  # - "first_rules.yml"
  # - "second_rules.yml"

# A scrape configuration containing exactly one endpoint to scrape:
# Here it‘s Prometheus itself.
scrape_configs:
  # The job name is added as a label `job=<job_name>` to any timeseries scraped from this config.
  - job_name: ‘prometheus‘

    # metrics_path defaults to ‘/metrics‘
    # scheme defaults to ‘http‘.

    static_configs:
    - targets: [‘localhost:9090‘]
~
~
~
~
"prometheus.yml" 29L, 925C
scrape_interval:收集频率
evaluation_interval:分析评率
alerting:预警相关设置
scrape_configs:分析配置,static_configs中要特别说明下收集目标,targets:[localhost:9090] 这里是数组 可以配置多个
注意:这里跟前面的 InfluxDB+AppMetrics 不一样,AppMetrics是在应用程序中去主动推送分析数据到 InfluxDB,而Prometheus是通过targets配置的地址去获取,但是在应用程序端也需要使用客户端中间件处理下
这里默认收集localhost:9090
下面我们后台启动下Prometheus,可以指定配置启动
./prometheus --config.file=prometheus.yml &
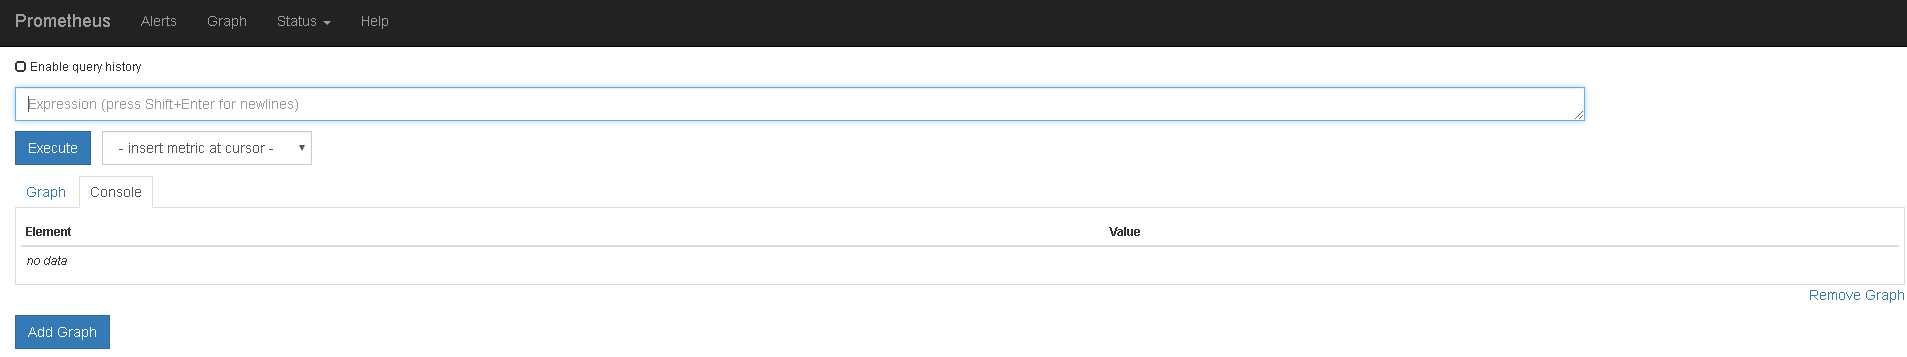
在打开9090端口测试下:
firewall-cmd --zone=public --add-port=9090/tcp --permanent
firewall-cmd --reload
浏览下
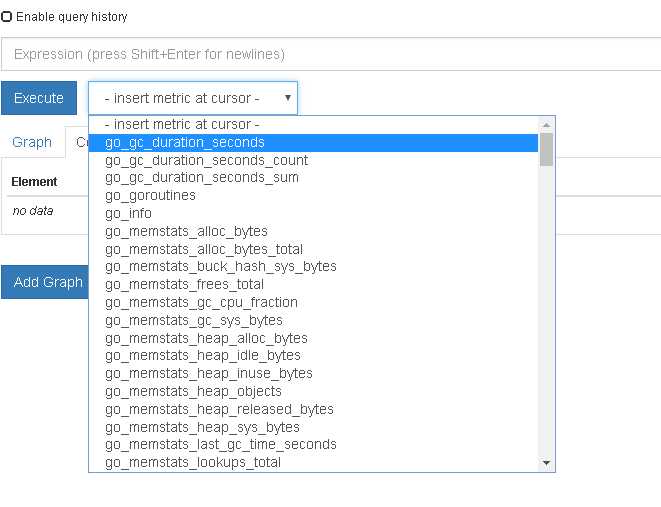
可以选择指定的分析指标
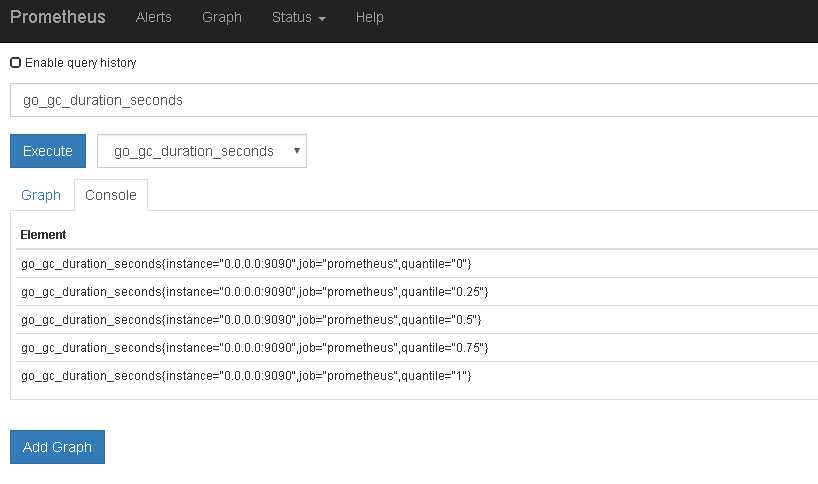
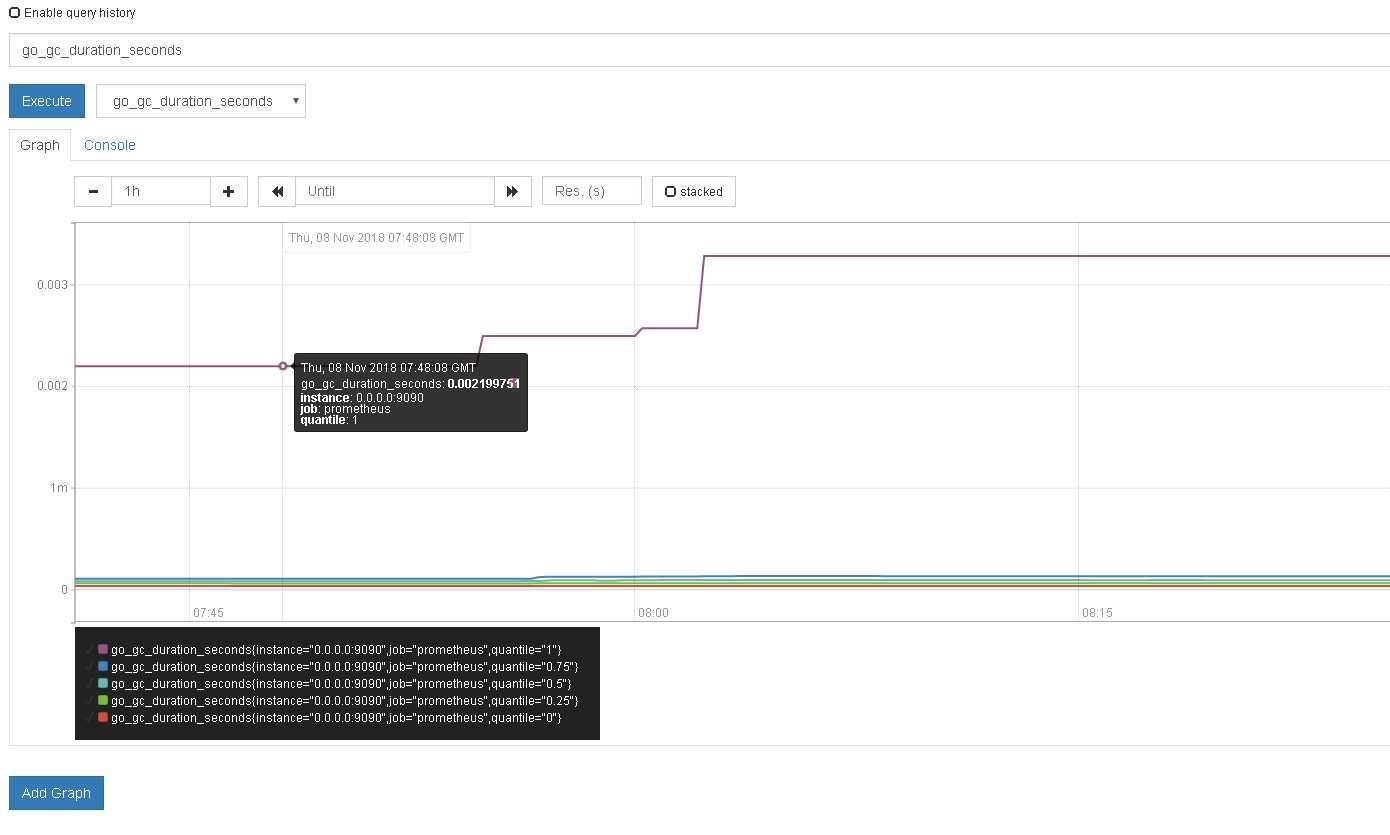
选择一个指标查询看下
我们也可以通过图表看查看分析情况,并添加添加多个图表分析
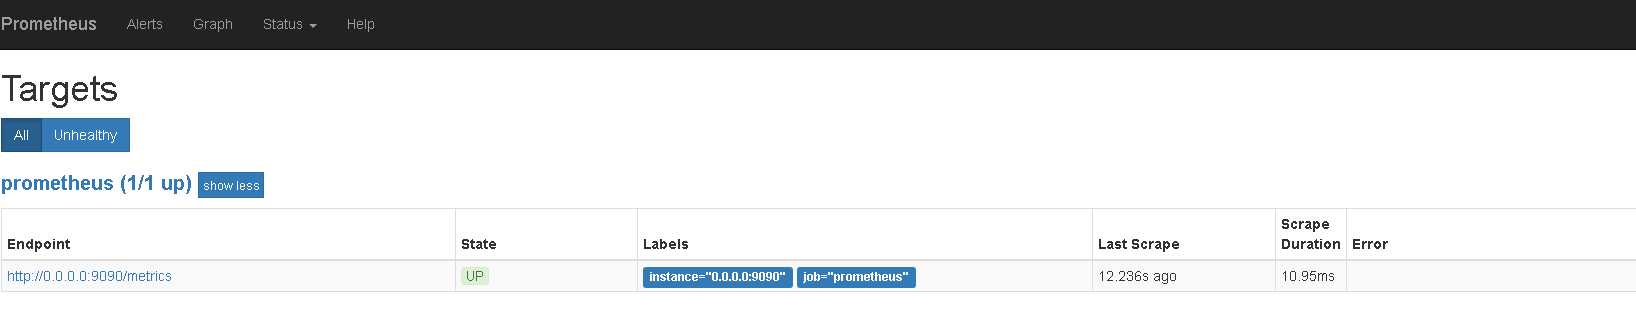
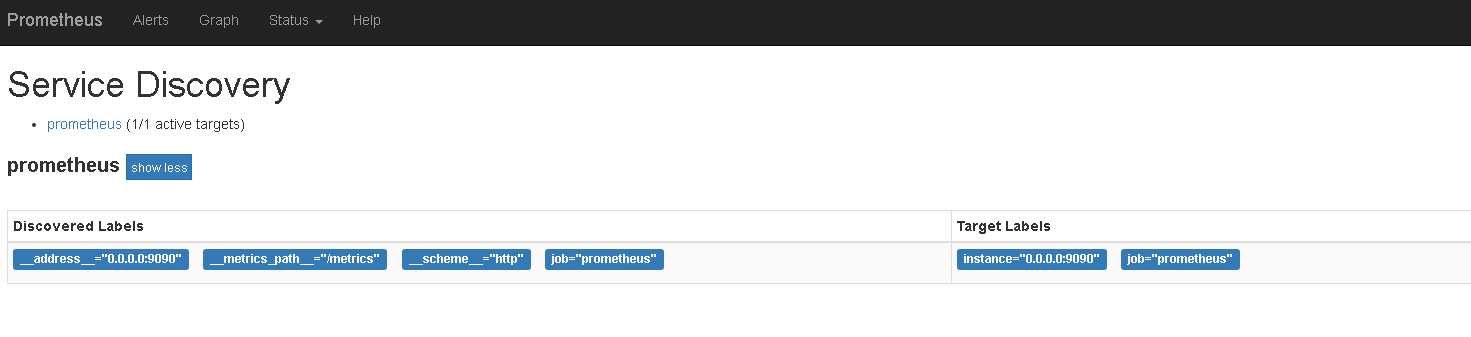
当然还有一些额外的处理,比如监控节点展示、服务发现等其他细节用法参考官方文档
.NetCore下使用Prometheus实现系统监控和警报 (二)Linux安装
标签:app dde linu ppm 额外 path conf host port
原文地址:https://www.cnblogs.com/liyouming/p/9930055.html