标签:Collector 访问 defaults 通知 lua 灵活 export rap 状态
Docker常用的监控方案
Prometheus
Prometheus架构
Prometheus是一种很不错的监控方案,它提供了监控数据搜集、存储、处理、可视化和警告一套完整的解决方案,下面是Prometheus的架构
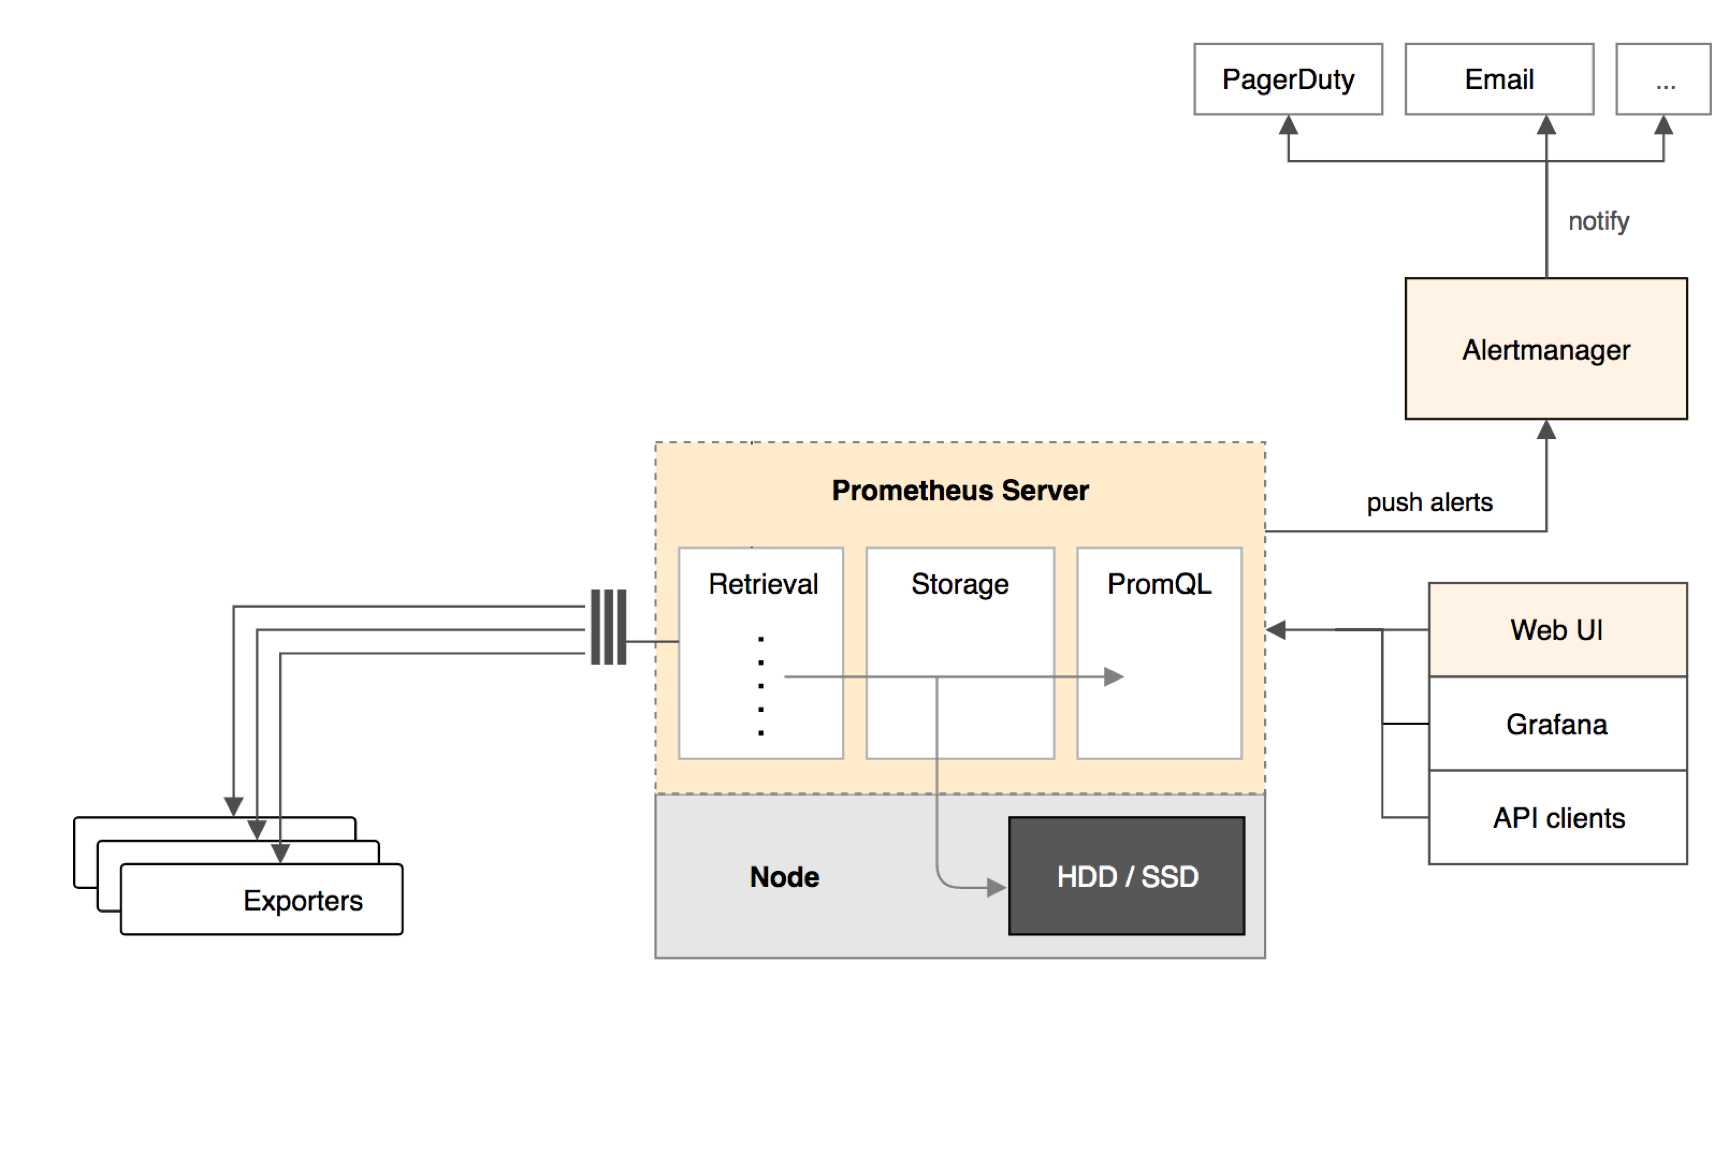
Prometheus Server
Prometheus Server负责从Exporter拉取和存储监控数据,并提供一套灵活的查询语言(PromQL)供用户使用
Exporter
Exporter负责收集目标对象(host,container...)的性能数据,并通过HTTP接口提供Prometheus Server获取
Alertmanager
用户可以定义基于监控数据的告警规则,规则会触发告警。一旦Alertmanager收到告警,会通过预定义的方式发出告警通知。支持的方式包括Email、PagerDuty、Webhook等
Prometheus的优势
(1)通过维度对数据进行说明,附加更多的业务信息,进而满足不同业务的需求。同时维度是可以动态添加的,比如再给数据加上一个user维度,就可以按用户来统计容器内存使用量了
(2)Prometheus丰富的查询语言能够灵活、充分地挖掘数据的价值
部署Prometheus
环境说明
我们将通过Prometheus监控两台Docker Host:10.211.55.17和10.211.55.21,监控host和容器两个层次的数据,按照构架图,我们需要运行如下组件
Prometheus Server
Prometheus Server本身也将以容器的方式运行在host 10.211.55.21上
Exporter
Prometheus有很多现成的Exporter,完整列表可参照https://prometheus.io/docs/instrumenting/exporters/
这里将使用
(1)Node Exporter,负责收集host硬件和操作系统数据。它将以容器方式运行在所有host上
(2)cAdvisor,负责收集容器数据。它将以容器的方式运行在所有host上
Grafana
显示多维数据,Grafana本身也将以容器方式运行在host 10.211.55.21上
运行Node Exporter
在两台主机上执行如下命令
sudo docker run -d -p 9100:9100 -v "/proc:/host/proc" -v "/sys:/host/sys" -v "/:/rootfs" --net=host prom/node-exporter --path.procfs /host/proc --path.sysfs /host/sys --collector.filesystem.ignored-mount-points "/(sys|proc|dev|host|etc)($|/)"
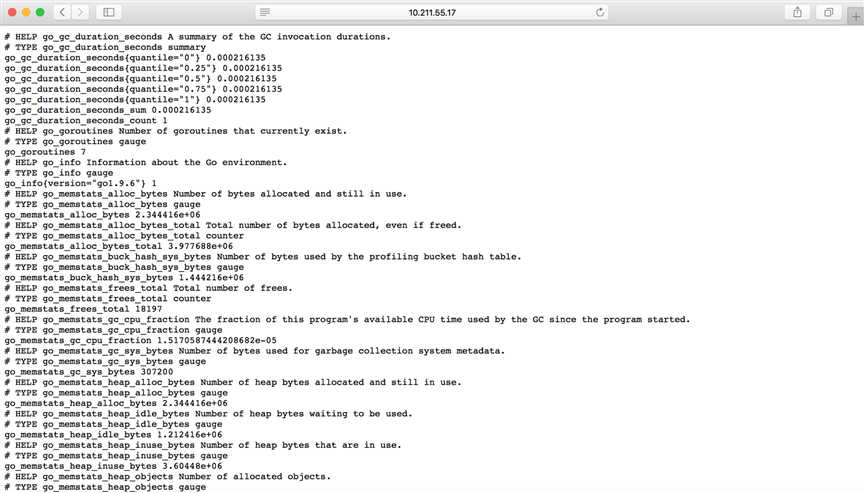
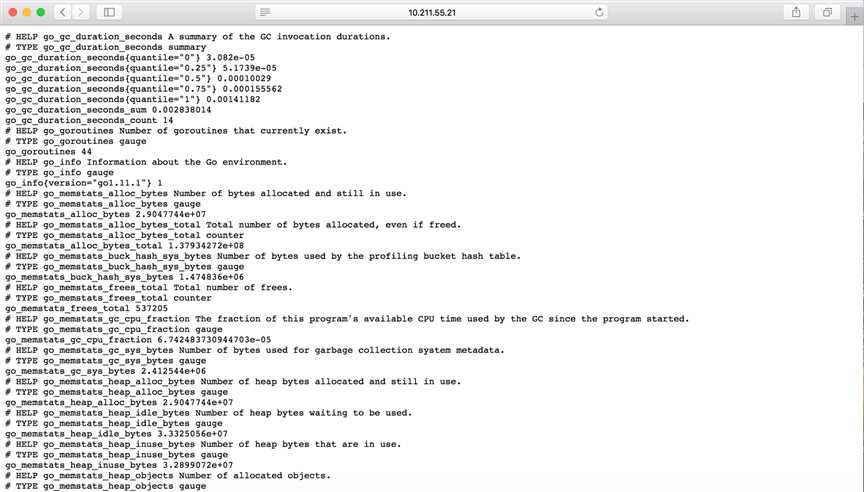
这里使用了--net=host,这样Prometheus Server可以直接与Node Exporter通信。Node Exporter启动后,将通过9100提供host的监控数据,在浏览器中通过http://10.211.55.17:9100/metrics测试一下
运行cAdvisor
在两个主机上执行一下命令
sudo docker run --volume=/:/rootfs:ro --volume=/var/run:/var/run:rw --volume=/sys:/sys:ro --volume=/var/lib/docker:/var/lib/docker:ro --publish=8080:8080 --detach=true --name=cadvisor --net=host google/cadvisor:latest
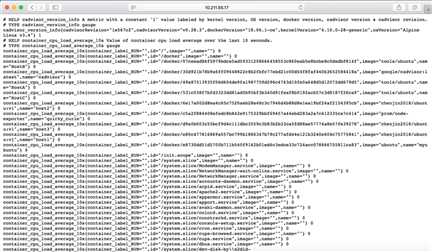
这里使用了--net=host,这样Prometheus Server可以直接与cAdvisor通信。cAdvisor启动后,将通过8080提供host的监控数据,在浏览器中通过http://10.211.55.17:8080/metrics测试一下
运行Prometheus Server
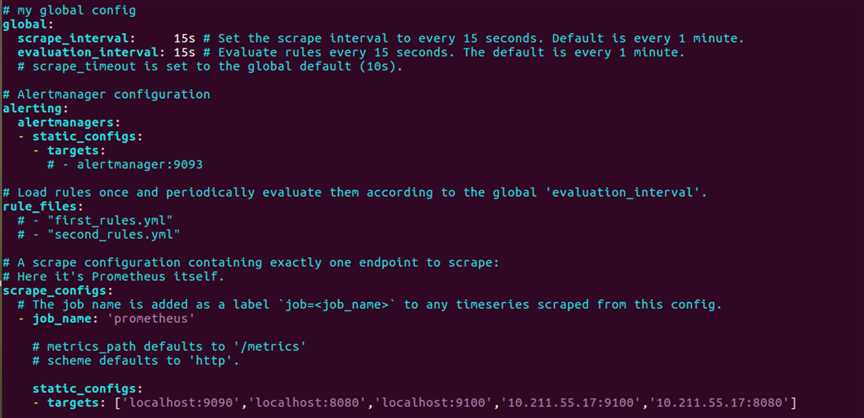
先在主机10.211.55.21上编写prometheus.yml文件,其具体内容如下
sudo vim Prometheus.yml

# my global config
global:
  scrape_interval:     15s # Set the scrape interval to every 15 seconds. Default is every 1 minute.
  evaluation_interval: 15s # Evaluate rules every 15 seconds. The default is every 1 minute.
  # scrape_timeout is set to the global default (10s).

# Alertmanager configuration
alerting:
  alertmanagers:
  - static_configs:
    - targets:
      # - alertmanager:9093

# Load rules once and periodically evaluate them according to the global ‘evaluation_interval‘.
rule_files:
  # - "first_rules.yml"
  # - "second_rules.yml"

# A scrape configuration containing exactly one endpoint to scrape:
# Here it‘s Prometheus itself.
scrape_configs:
  # The job name is added as a label `job=<job_name>` to any timeseries scraped from this config.
  - job_name: ‘prometheus‘

    # metrics_path defaults to ‘/metrics‘
    # scheme defaults to ‘http‘.

    static_configs:
    - targets: [‘localhost:9090‘,‘localhost:8080‘,‘localhost:9100‘,‘10.211.55.17:9100‘,‘10.211.55.17:8080‘]
编写好配置文件后执行一下命令,以容器的方式来运行prometheus
sudo docker run -d -p 9090:9090 -v /home/chenjin/prometheus.yml:/etc/prometheus/prometheus.yml --name prometheus --net=host prom/prometheus

这里使用了--net=host,这样Prometheus Server可以直接与Exporter和Grafana通信。上面的配置文件中最重要的是-targets里面的内容,指定从哪些exporter抓取数据。这里指定了两台主机上的Node Exporter个cAdvisor,另外localhost:9090就是Prometheus Server自己,可见Prometheus本身也会收集自己的监控数据。可以通过http://10.211.55.21:9090/metrics测试一下
在浏览器中打开http://10.211.55.21:9090,点击菜单Status -> Targets
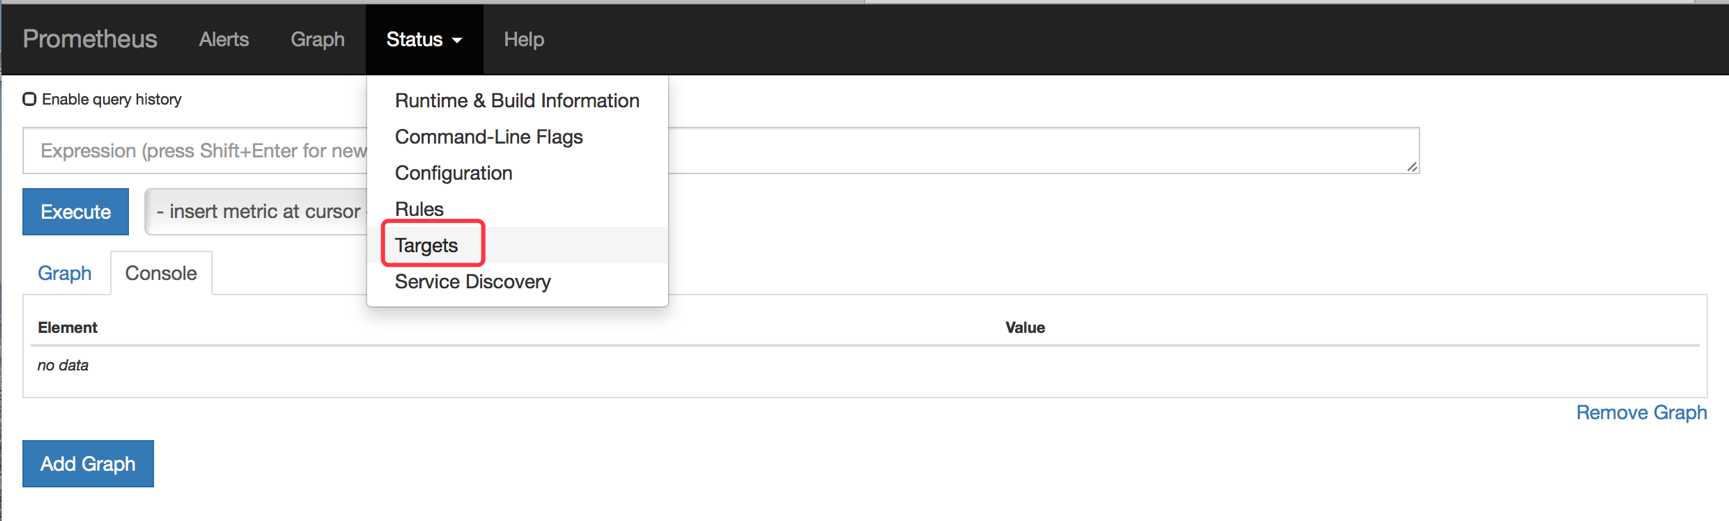
如下图所示
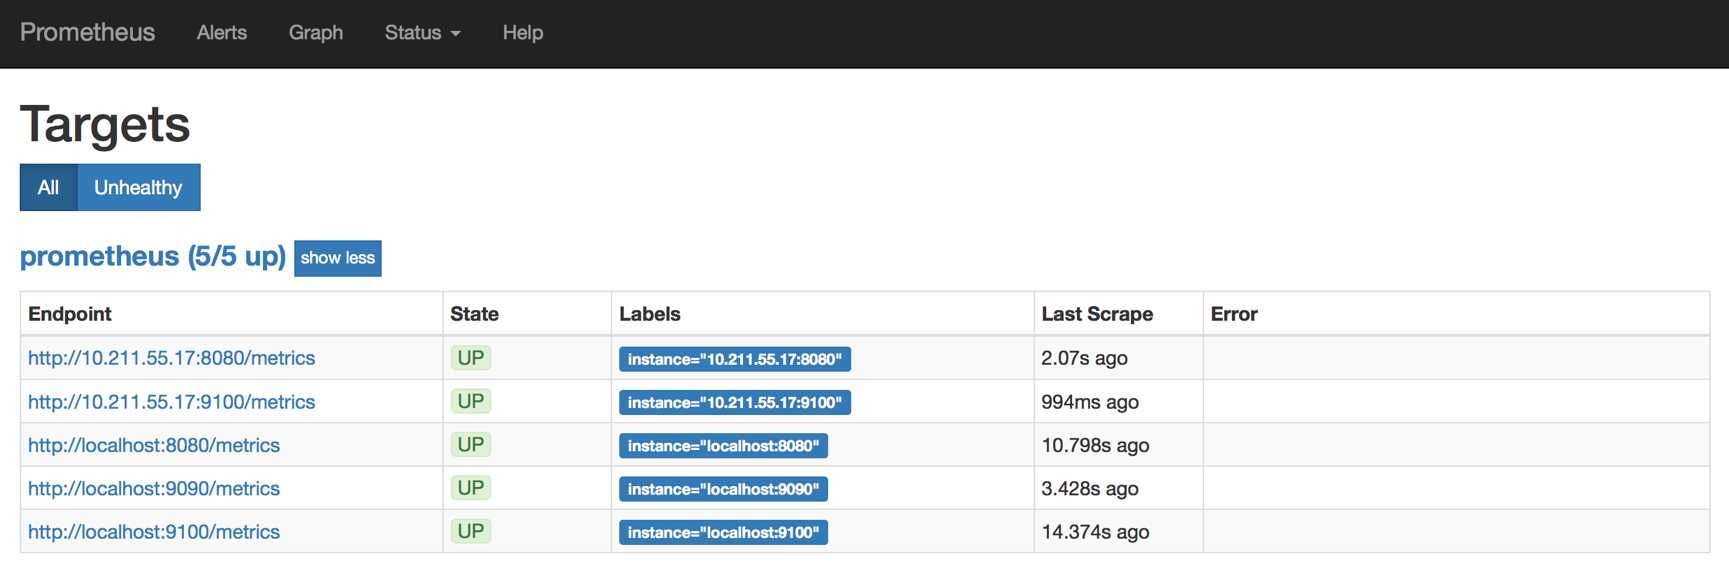
所有Target的State都是都是UP状态,说明Prometheus Server能够正常获取监控数据
运行Grafana
在主机10.211.55.21上执行如下命令
sudo docker run -d -i -p 3000:3000 -e "GF_SERVER_ROOT_URL=http://grafana.server.name" -e "GF_SECURITY_ADMIN_PASSWORD=secret" --net=host grafana/grafana
这里使用了--net=host,这样Grafana可以直接与Prometheus Server通信。-e "GF_SECURITY_ADMIN_PASSWORD=secret"指定了Grafana admin用户和密码secret
Grafana启动后,在浏览器中打开http://10.211.55.21:3000
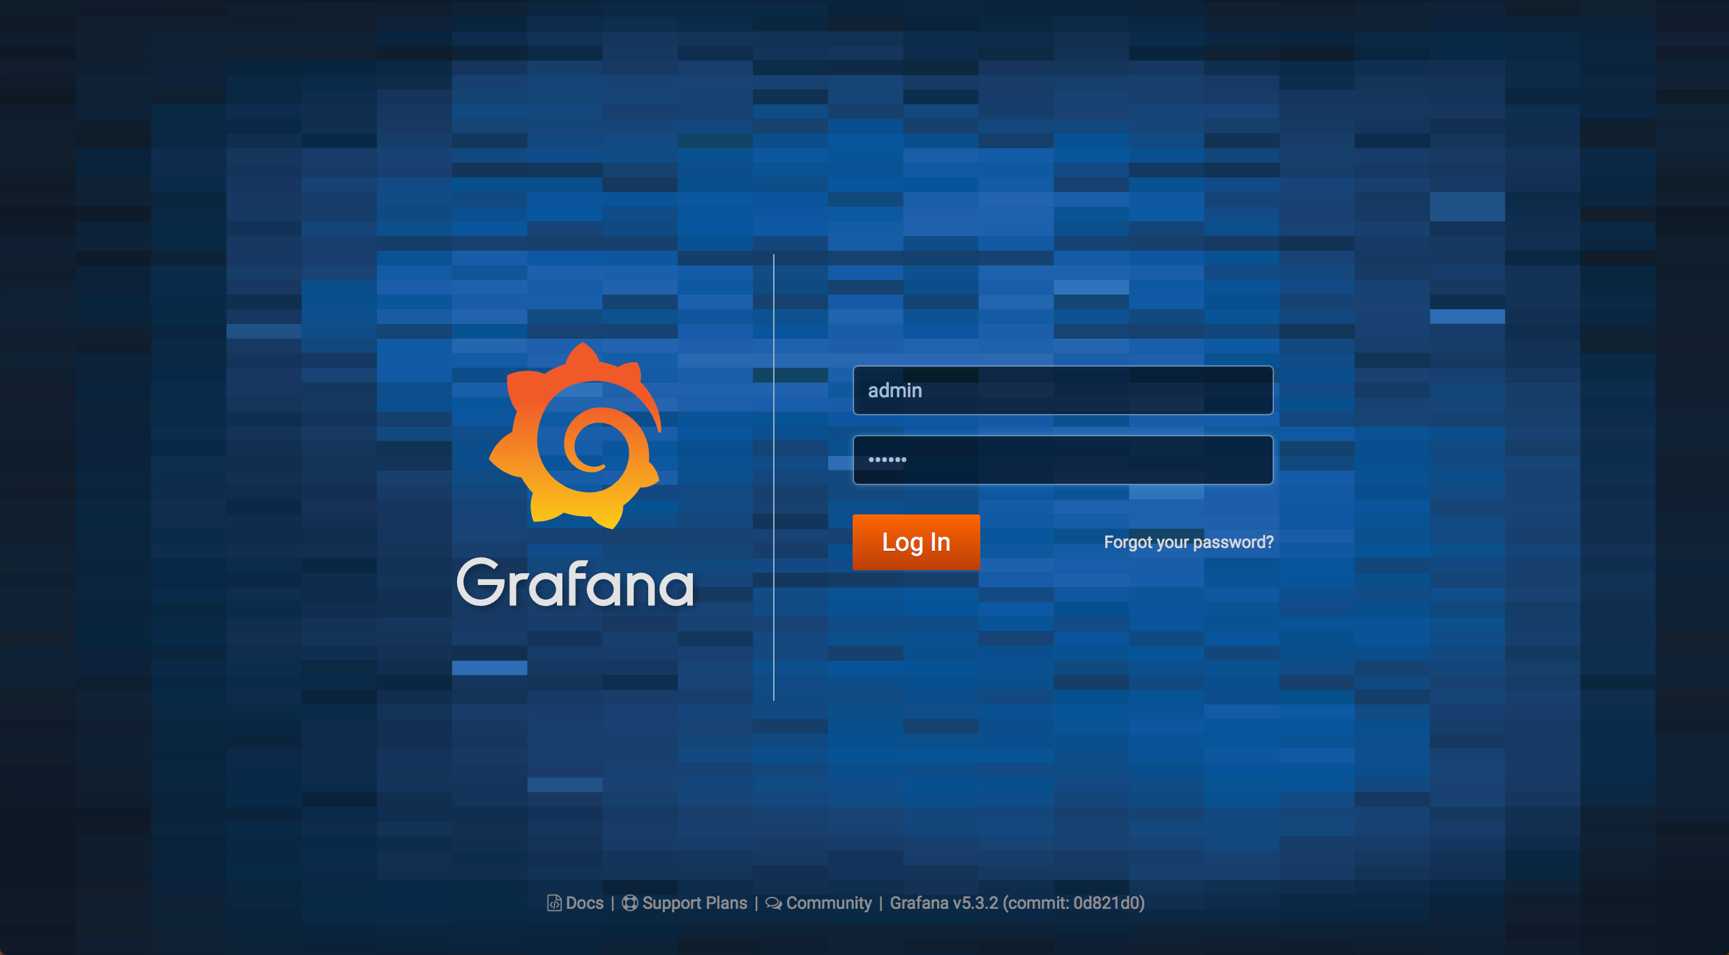
登录后,Grafana将引导我们配置Data Source
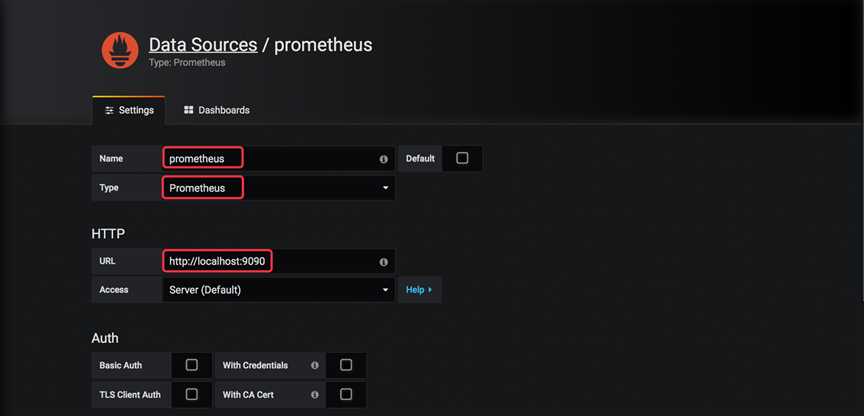
Name为Date Source命令,例如prometheus
Type选择Prometheus
Url输入Prometheus Server的地址
其他保持默认,点击下面的Save & Test

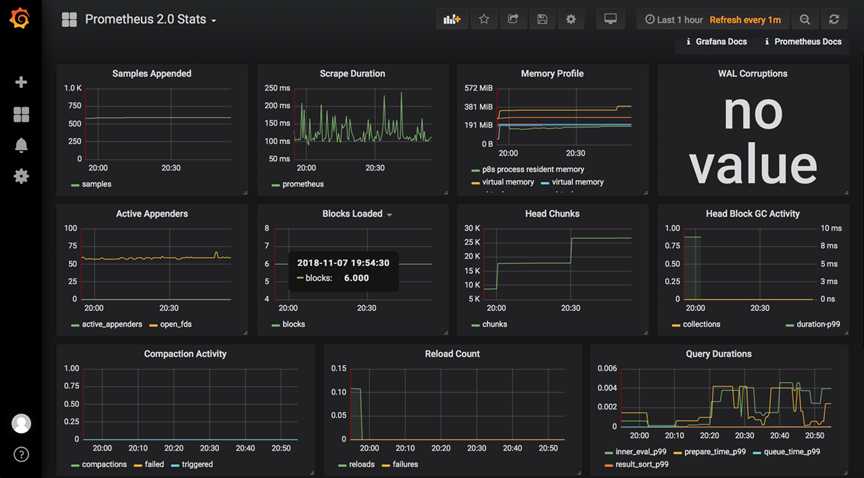
配置完成后,Grafana就能够访问Prometheus中存放的监控数据了
Docker学习(12):Docker监控方案之Prometheus
标签:Collector 访问 defaults 通知 lua 灵活 export rap 状态
原文地址:https://www.cnblogs.com/chenjin2018/p/9949693.html