标签:.com 路径 ddc shai data- 加载进度条 one process nta
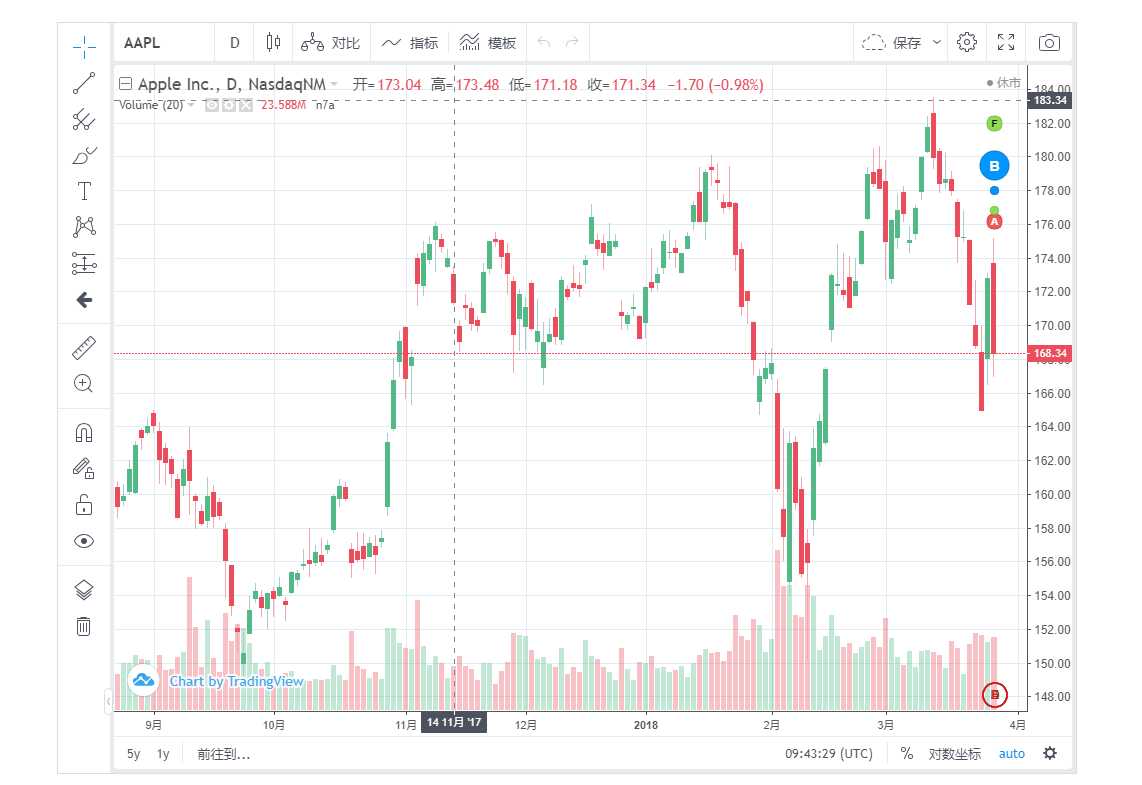
这段时间刚好做币圈交易所,运用到了现在最火的金融类图表库 -- TradingView ,就是强大,基本上现在的火币网(https://www.huobi.com),币安网(https://www.binance.com/ )等大型交易所都在使用。
简介:
带有开放API的可下载图表库。这是一个独立的解决方案,可以将其下载,托管在自己的服务器上,连接自己的数据,在自己的网站/应用程序免费使用。
适用于手机和桌面应用程序、 门户网站、博客和新闻网站。 当您想要完全控制图表并希望显示您所控制的数据时,此为最佳选择。
使用教程:
本教程使用的是nodejs 提供的接口,所有的数据都本地mock出来的,这样大家可以更加方便理解数据使用的问题。
步骤:
1.注册TradingView账号,然后申请TradingView的图表库(申请地址:https://cn.tradingview.com/how-it-works/),(注意,必须是以公司名义申请,不允许个人名义申请,如果以个人名义申请或者你所在行业经过中国区经销商了解后不需要用到tradingview将无法给你提供github的开源代码下载。源码结构如下图:)

/charting\_library 包含全部的图表库文件。/charting\_library/charting\_library.min.js 包含外部图表库widget接口。此文件不应该被修改。/charting_library/charting_library.min.d.ts 包含TypeScript定义的widget接口/charting_library/datafeed-api.d.ts 包含TypeScript定义的datafeed接口。/charting_library/datafeeds/udf/ 包含UDF-compatible 的datafeed包装类(用于实现JS API通过UDF传输数据给图表库)。例子中的datafeed包装器类实现了脉冲实时仿真数据。您可以自由编辑此文件。/charting\_library/static 文件夹中存储图表库内部资源,不适用于其他目的。/index.html 为使用Charting Library widget 的html例子。/test.html 为不同的图表库自定义功能使用的示例。/mobile\*.html 也是Widget自定义的示例。然后把整个项目clone 下来到本地。
2.安装nodejs (安装教程:https://www.cnblogs.com/zhouyu2017/p/6485265.html)
3.安装koa (Koa -- 基于 Node.js 平台的下一代 web 开发框架)
$ npm i koa
4.安装koa-generator (Koa 脚手架)
$ npm i -g koa-generator
5.使用koa-generator 快速创建项目
$ koa2 TrandingPiewProject && cd TrandingPiewProject && npm install
koa-generator创建的项目已经集成了nodemon,所以大家可以直接使用nodemon启动项目
$ nodemon run start
打开浏览器: http://localhost:3001
就可以看到nodejs项目已经启动了
6.在nodejs创建3个接口
地址1:http://localhost:3001/api/config (存放trandingview的 datafeed配置数据)
地址2:http://localhost:3001/api/symbols (trandingview的 商品解析数据)
地址3:http://localhost:3001/api/history (trandingview的 K线数据)
7.nodejs项目文件修改如下
app.js (修改部分黄色标出)
const Koa = require(‘koa‘)
const views = require(‘koa-views‘)
const json = require(‘koa-json‘)
const onerror = require(‘koa-onerror‘)
const bodyparser = require(‘koa-bodyparser‘)
const logger = require(‘koa-logger‘)
// 引入koa2-cors "允许跨域"
const cors = require(‘koa2-cors‘)

const index = require(‘./routes/index‘)
const api = require(‘./routes/api‘)

const app = new Koa()
app.use(cors())
// error handler
onerror(app)

// middlewares
app.use(bodyparser({
  enableTypes:[‘json‘, ‘form‘, ‘text‘]
}))
app.use(json())
app.use(logger())
app.use(require(‘koa-static‘)(__dirname + ‘/public‘))

app.use(views(__dirname + ‘/views‘, {
  extension: ‘pug‘
}))

// logger
app.use(async (ctx, next) => {
  const start = new Date()
  await next()
  const ms = new Date() - start
  console.log(`${ctx.method} ${ctx.url} - ${ms}ms`)
})

// routes
app.use(index.routes(), index.allowedMethods())
app.use(api.routes(), api.allowedMethods())

// error-handling
app.on(‘error‘, (err, ctx) => {
  console.error(‘server error‘, err, ctx)
});

module.exports = app
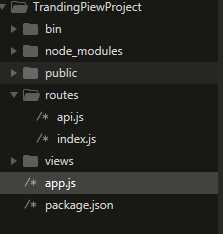
把原来的routes下面的users.js改成api.js,
贴上我的api.js
api.js (修改部分黄色标出)
const router = require(‘koa-router‘)()

router.prefix(‘/api‘)

// 产生随机数的方法
function random(lower, upper) {
    return Math.floor(Math.random() * (upper - lower)) + lower;
}
// 获取两数中一数的方法
function rd(n, m) {
    var c = m - n + 1;
    return Math.floor(Math.random() * c + n);
}

// config接口
router.get(‘/config‘, async (ctx, next) => {
    ctx.body = {
        "supports_search": true, //是否支持搜索
        "supports_group_request": false, //是否支持搜索或品种解析
        "supported_resolutions": ["30", "60", "240", "D"], //中的值D代表天day,W代表周week,M代表月;2D是两天;3W是三周;6M是6个月,表示支持显示的哪几种图日线图、2日线
        "supports_marks": false,
        "supports_timescale_marks": false,
    }
})
// symbols接口
router.get(‘/symbols‘, async (ctx, next) => {
    ctx.body = {
        "name": "CDCC/ETH", //品种名称
        "session": "24x7", //开盘时间
        "has_intraday": true, //显示符号是否具有历史盘中数据
        "timezone": "Asia/Shanghai", //时区
        "data_status": "delayed_streaming",
        "supported_resolutions": ["5", "10", "15", "30", "60", "120", "240", "D", "W"],
        "intraday_multipliers": ["5", "60", "D"],
        "minmov": 20, //用于格式化用途
        "pricescale": 100000000, //数据显示的小数位数(例如:100显示0.01)
        "type": "bitcoin" //类型
    }
})
// history接口
router.get(‘/history‘, async (ctx, next) => {
    let resolution = ctx.query.resolution // 商品名称或者代码
    let from = new Date(ctx.query.from * 1000) //获取数据的开始时间戳
    let to = new Date(ctx.query.to * 1000) //获取数据的结束时间戳


    if (resolution == ‘1‘ || resolution == ‘5‘ || resolution == ‘10‘ || resolution == ‘15‘ || resolution == ‘30‘) {
        from.setMilliseconds(0)
        to.setMilliseconds(0)
        from.setSeconds(0)
        to.setSeconds(0)
    } else if (resolution == ‘60‘) {
        from.setMilliseconds(0)
        to.setMilliseconds(0)
        from.setSeconds(0)
        to.setSeconds(0)
        from.setMinutes(0)
        to.setMinutes(0)
    } else if (resolution == ‘D‘) {
        from.setMilliseconds(0)
        to.setMilliseconds(0)
        from.setSeconds(0)
        to.setSeconds(0)
        from.setMinutes(0)
        to.setMinutes(0)
        from.setHours(0)
        to.setHours(0)
    }
    let text = from
    const time = Math.floor((to.getTime() - from.getTime()) / 60 / 1000)
    let num
    if (resolution == ‘D‘) {
        num = time / (60 * 24)
    } else {
        num = time / resolution
    }
    let o = []
    let c = []
    let h = []
    let l = []
    let v = []
    let t = []
    let newnum = 3000;
    for (var i = 0; i < num; i++) {
        t.push(text.getTime() / 1000)
        if (resolution == ‘D‘) {
            text.setMinutes(text.getMinutes() + Number(24 * 60))
        } else {
            text.setMinutes(text.getMinutes() + Number(resolution))
        }
        if (rd(1, 2) == 1) {
            newnum += random(1, 10)
            o.push(newnum)
            let h1 = 0;
            let l1 = 0;
            if (rd(1, 2) == 1) {
                h1 = newnum + random(1, 10)
                h.push(h1)
                l1 = h1 - random(1, 10)
                l.push(l1)
                c.push(rd(l1, h1))
            } else {
                h1 = newnum - random(1, 10)
                h.push(h1)
                l1 = h1 - random(1, 10)
                l.push(l1)
                c.push(rd(l1, h1))
            }
        } else {
            newnum -= random(1, 10)
            if (newnum < 0) {
                newnum = 0
            }
            o.push(newnum)
            if (rd(1, 2) == 1) {
                h.push(newnum + random(1, 10))
                l.push(newnum + random(1, 10))
                c.push(newnum + random(1, 10))
            } else {
                if ((newnum - random(1, 10)) < 0) {
                    newnum = 0
                    h.push(0)
                } else {
                    h.push(newnum - random(1, 10))
                }
                if ((newnum - random(1, 10)) < 0) {
                    newnum = 0
                    l.push(0)
                } else {
                    l.push(newnum - random(1, 10))
                }
                if ((newnum - random(1, 10)) < 0) {
                    newnum = 0
                    c.push(0)
                } else {
                    c.push(newnum - random(1, 10))
                }
            }
        }

        v.push(random(1, 1000))
    }
    ctx.body = {
        t: t, //表示时间,将t的数值补000后就代表毫秒数,比如js的(new Date).getTime()
        o: o, //表示open开盘价
        c: c, //表示close收盘价
        h: h, //表示high最高价
        l: l, //表示low最低价
        v: v, //表示volume成交量
        s: "ok" //表示状态,返回数据是否成功,ok表示成功
    }
})

module.exports = router
修改完之后,其实上面创建的3个就可以访问了。mock 数据也完成了。
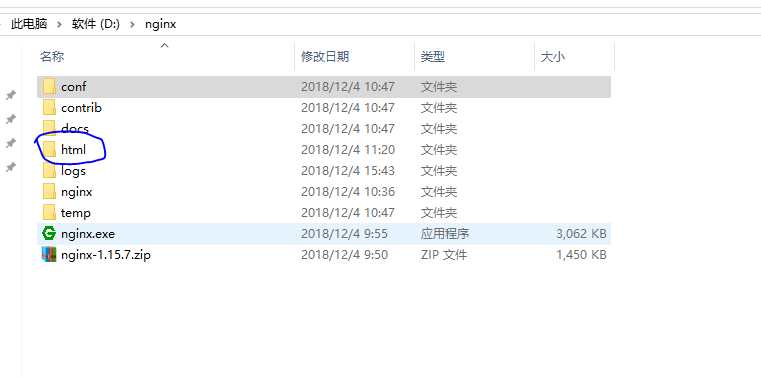
8.把github上clone下来的项目启动在自己本地的服务器,我个人用了代理服务器nginx,nginx 具体的安装流程请大家自己去搜索,以及为什么用nginx,这个就是因为接口跨域问题,大家自己私下了解下就可以了,我在这里就不多做解释了。
接着把克隆下来的charting_library文件移动到nginx的html文件下就可以了。
这里我贴出我的nginx.conf 文件
注意:修改下里面charting_library文件夹根目录下的 test.html 文件,把名字改成 index3.html。因为nginx跟恶心,对test这个词有bug。
#user  nobody;
worker_processes  1;

#error_log  logs/error.log;
#error_log  logs/error.log  notice;
#error_log  logs/error.log  info;

#pid        logs/nginx.pid;


events {
    worker_connections  1024;
}


http {
    include       mime.types;
    default_type  application/octet-stream;

    #log_format  main  ‘$remote_addr - $remote_user [$time_local] "$request" ‘
    #                  ‘$status $body_bytes_sent "$http_referer" ‘
    #                  ‘"$http_user_agent" "$http_x_forwarded_for"‘;

    #access_log  logs/access.log  main;

    sendfile        on;
    #tcp_nopush     on;

    #keepalive_timeout  0;
    keepalive_timeout  65;

    #gzip  on;

    server {
        listen       8083;
        server_name  localhost;
        location / {
            root  ./html/charting_library;
            index  index3.html index3.htm;
        }
    }

    server {
       listen       8084;
       server_name  localhost;

       location / {
            proxy_pass http://localhost:8083;
            proxy_redirect default;
       }
       location /apis {
            rewrite  ^/apis/(.*)$ /$1 break;
            proxy_pass   http://localhost:3001;
       }

    }


    # HTTPS server
    #
    #server {
    #    listen       443 ssl;
    #    server_name  localhost;

    #    ssl_certificate      cert.pem;
    #    ssl_certificate_key  cert.key;

    #    ssl_session_cache    shared:SSL:1m;
    #    ssl_session_timeout  5m;

    #    ssl_ciphers  HIGH:!aNULL:!MD5;
    #    ssl_prefer_server_ciphers  on;

    #    location / {
    #        root   html;
    #        index  index.html index.htm;
    #    }
    #}

}
好了,这个时候项目就已经启动了。
9.然后修改Tradingview的配置就可以连接自己的nodesj mock出来的数据了。
tradingview 目录结构
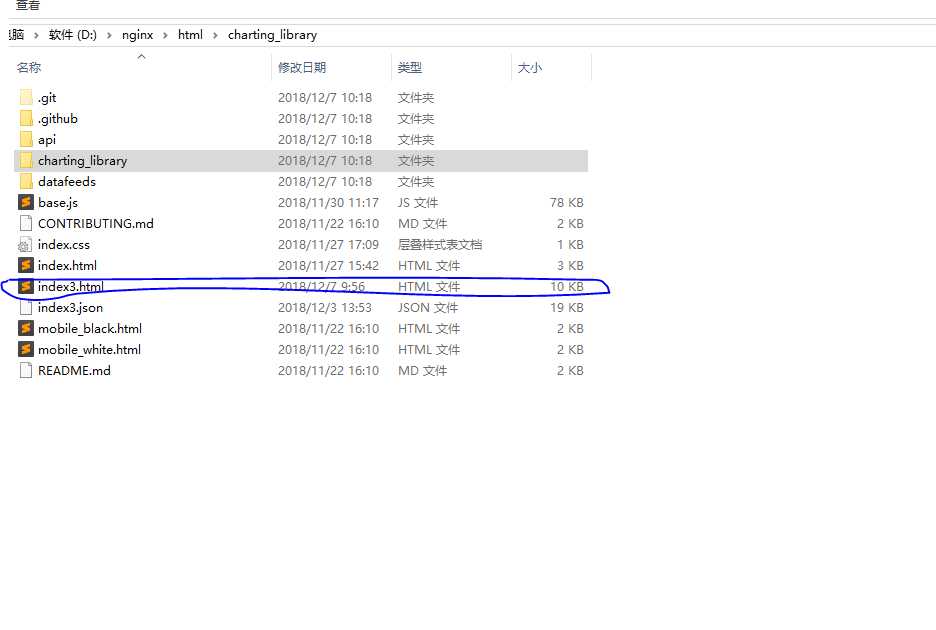
然后只需要修改里里面的index.html(其实就是原来的test.html,只是我这里把它改成index3.html)
<!DOCTYPE html>
<html lang="en">

<head>
    <meta http-equiv="Content-Type" content="text/html; charset=utf-8" />
    <title>TradingView Charting Library demo -- testing mess</title>
    <!-- Fix for iOS Safari zooming bug -->
    <meta name="viewport" content="width=device-width,initial-scale=1.0,maximum-scale=1.0,minimum-scale=1.0">
    <meta http-equiv="X-UA-Compatible" content="IE=Edge">
    <script src="http://code.jquery.com/jquery-3.3.1.js" integrity="sha256-2Kok7MbOyxpgUVvAk/HJ2jigOSYS2auK4Pfzbm7uH60=" crossorigin="anonymous"></script>
    <script type="text/javascript" src="charting_library/charting_library.min.js"></script>
    <script type="text/javascript" src="datafeeds/udf/dist/polyfills.js"></script>
    <script type="text/javascript" src="datafeeds/udf/dist/bundle.js"></script>
    <script type="text/javascript">
    function getParameterByName(name) {
        name = name.replace(/[\[]/, "\\[").replace(/[\]]/, "\\]");
        var regex = new RegExp("[\\?&]" + name + "=([^&#]*)"),
            results = regex.exec(location.search);
        return results === null ? "" : decodeURIComponent(results[1].replace(/\+/g, " "));
    }

    TradingView.onready(function() {
        var widget = window.tvWidget = new TradingView.widget({
            debug: false,
            // 是否全屏
            fullscreen: true,
            // 初始商品
            symbol: ‘CDCC/ETH‘,
            // 周期
            interval: 60,
            // 时区
            timezone: "Asia/Shanghai",
            // id属性为指定要包含widget的DOM元素id
            container_id: "tv_chart_container",
            // 语言
            locale: "zh",
            // static文件夹的路径
            library_path: "charting_library/",
            // JavaScript对象的实现接口 JS API 以反馈图表及数据
            datafeed: new Datafeeds.UDFCompatibleDatafeed("http://localhost:3001/api"),
            // 自动调节大小
            autosize: true,
            // 主题颜色(dark,light)
            theme: ‘dark‘,
            time_frames: false,
            style: "1",
            overrides: {
                "timeScale.rightOffset": 1,
                "timeScale.barSpacing": 12.709329141645004,
                "headerToolbarIndicators.backgroundColor": "#dc1a5a",
                "headerToolbarIndicators.backgroundColor": "#dc1a5a",
                "mainSeriesProperties.candleStyle.borderColor": "#212c3f",
                "mainSeriesProperties.candleStyle.borderDownColor": "#dc1a5a",
                "mainSeriesProperties.candleStyle.borderUpColor": "#0fbb89",
                "mainSeriesProperties.candleStyle.downColor": "#dc1a5a",
                "mainSeriesProperties.candleStyle.upColor": "#0fbb89",
                "mainSeriesProperties.candleStyle.wickDownColor": "#dc1a5a",
                "mainSeriesProperties.candleStyle.wickUpColor": "#0fbb89",
                "mainSeriesProperties.hollowCandleStyle.borderColor": "#212c3f",
                "mainSeriesProperties.hollowCandleStyle.borderDownColor": "#dc1a5a",
                "mainSeriesProperties.hollowCandleStyle.borderUpColor": "#0fbb89",
                "mainSeriesProperties.hollowCandleStyle.downColor": "#dc1a5a",
                "mainSeriesProperties.hollowCandleStyle.upColor": "#0fbb89",
                "mainSeriesProperties.showCountdown": false,
                "mainSeriesProperties.style": 1,
                "paneProperties.background": "#131722",
                "