标签:role get eem yum安装 download front x86_64 lock opera
zabbix 4

官方:https://www.zabbix.com/
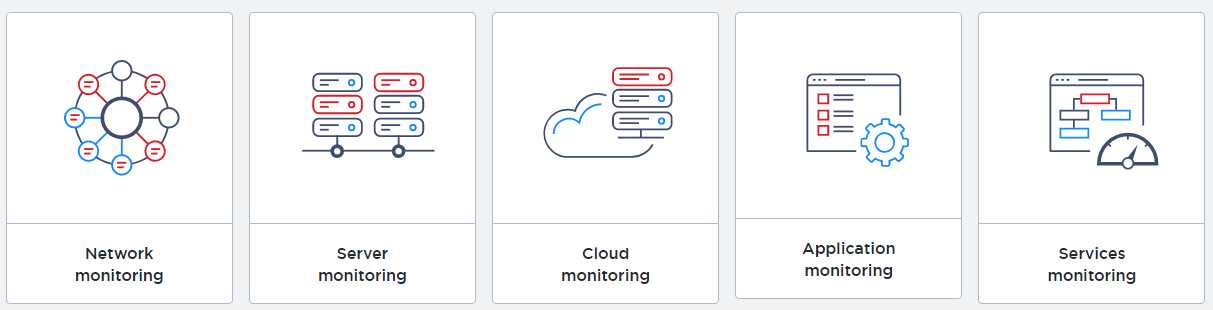
Monitor anything
Solutions for any kind of IT infrastructure, services, applications, resources
监控一切
Enterprise-ready
Mature, enterprise-level platform to monitor large-scale IT environments
成熟的企业级监控平台
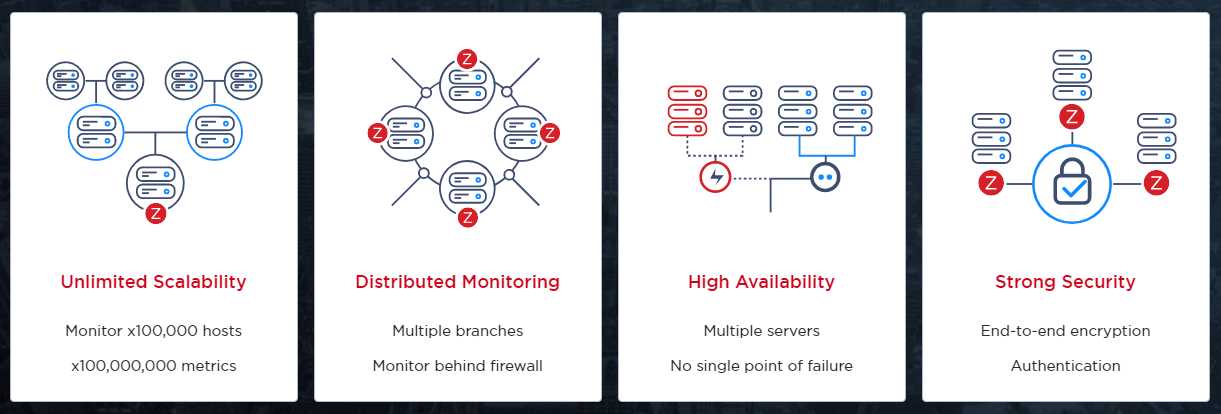
Zabbix is an enterprise-class open source distributed monitoring solution.
zabbix是一个开源的分布式的企业级监控方案;
Zabbix is software that monitors numerous parameters of a network and the health and integrity of servers. Zabbix uses a flexible notification mechanism that allows users to configure e-mail based alerts for virtually any event. This allows a fast reaction to server problems. Zabbix offers excellent reporting and data visualisation features based on the stored data. This makes Zabbix ideal for capacity planning.
Zabbix supports both polling and trapping. All Zabbix reports and statistics, as well as configuration parameters, are accessed through a web-based frontend. A web-based frontend ensures that the status of your network and the health of your servers can be assessed from any location. Properly configured, Zabbix can play an important role in monitoring IT infrastructure. This is equally true for small organisations with a few servers and for large companies with a multitude of servers.
Zabbix server is the central component to which agents report availability and integrity information and statistics. The server is the central repository in which all configuration, statistical and operational data are stored.
Zabbix agents are deployed on monitoring targets to actively monitor local resources and applications and report the gathered data to Zabbix server.
All configuration information as well as the data gathered by Zabbix is stored in a database.
For an easy access to Zabbix from anywhere and from any platform, the web-based interface is provided. The interface is part of Zabbix server, and usually (but not necessarily) runs on the same physical machine as the one running the server.
Zabbix proxy can collect performance and availability data on behalf of Zabbix server. A proxy is an optional part of Zabbix deployment; however, it may be very beneficial to distribute the load of a single Zabbix server.
# rpm -Uvh https://repo.zabbix.com/zabbix/4.0/rhel/7/x86_64/zabbix-release-4.0-1.el7.noarch.rpm
agent安装
# yum install zabbix-agentserver安装
# yum install zabbix-server-mysql zabbix-web-mysql zabbix-agent
mysql> create database zabbix character set utf8 collate utf8_bin;
mysql> grant all privileges on zabbix.* to zabbix@‘%‘ identified by ‘password‘;# zcat /usr/share/doc/zabbix-server-mysql*/create.sql.gz | mysql -h$ip -uzabbix -p zabbix
# vi /etc/zabbix/zabbix_server.conf
DBHost=$ip
DBPassword=password# vi /etc/httpd/conf.d/zabbix.conf
php_value date.timezone Asia/Shanghai# systemctl restart zabbix-server httpd
# systemctl enable zabbix-server httpd
# vi /etc/zabbix/zabbix_agentd.conf
Server=$server_ip
ServerActive=$server_ip# systemctl restart zabbix-agent
# systemctl enable zabbix-agent
参考:https://www.zabbix.com/download?zabbix=4.0&os_distribution=centos&os_version=7&db=mysql
访问 http://$server_ip/zabbix 进入设置向导
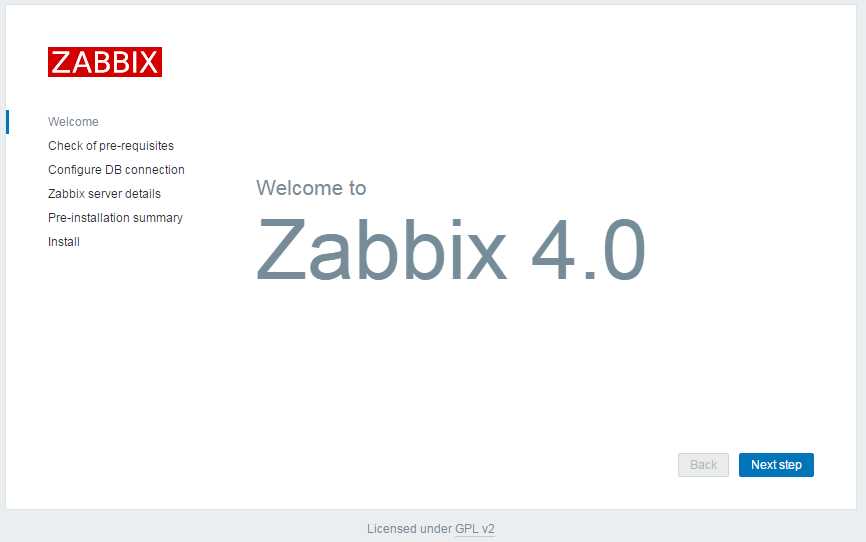
设置db
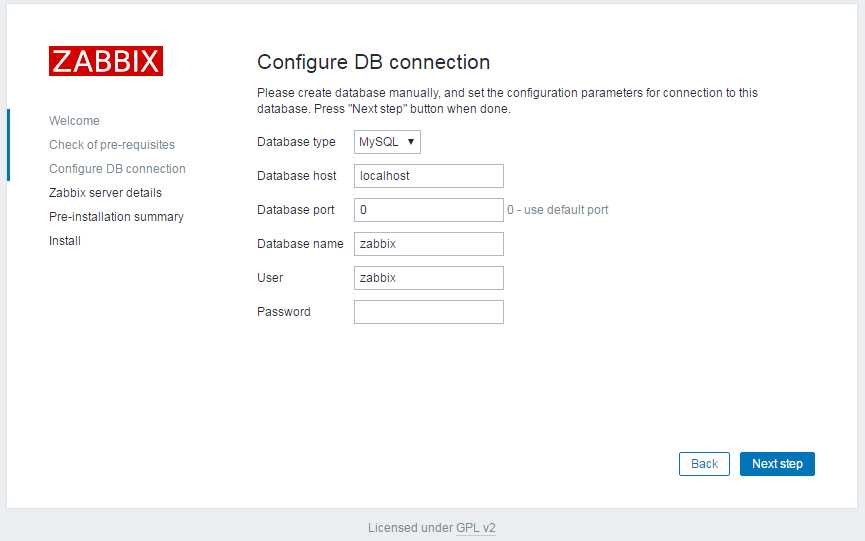
设置完成之后
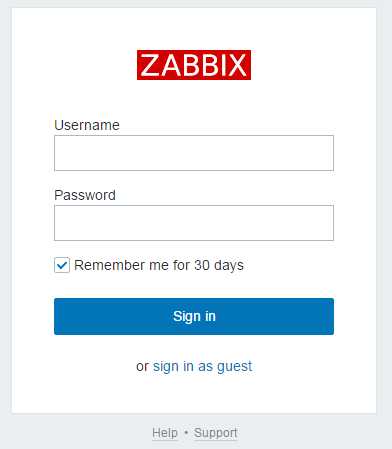
默认用户密码:Admin/zabbix
ps:如果登录之后发现zabbix server is not running,10051端口也没有绑定,极有可能是是连接db不通;
参考:https://www.zabbix.com/documentation/4.0/manual/installation/install#installing_frontend
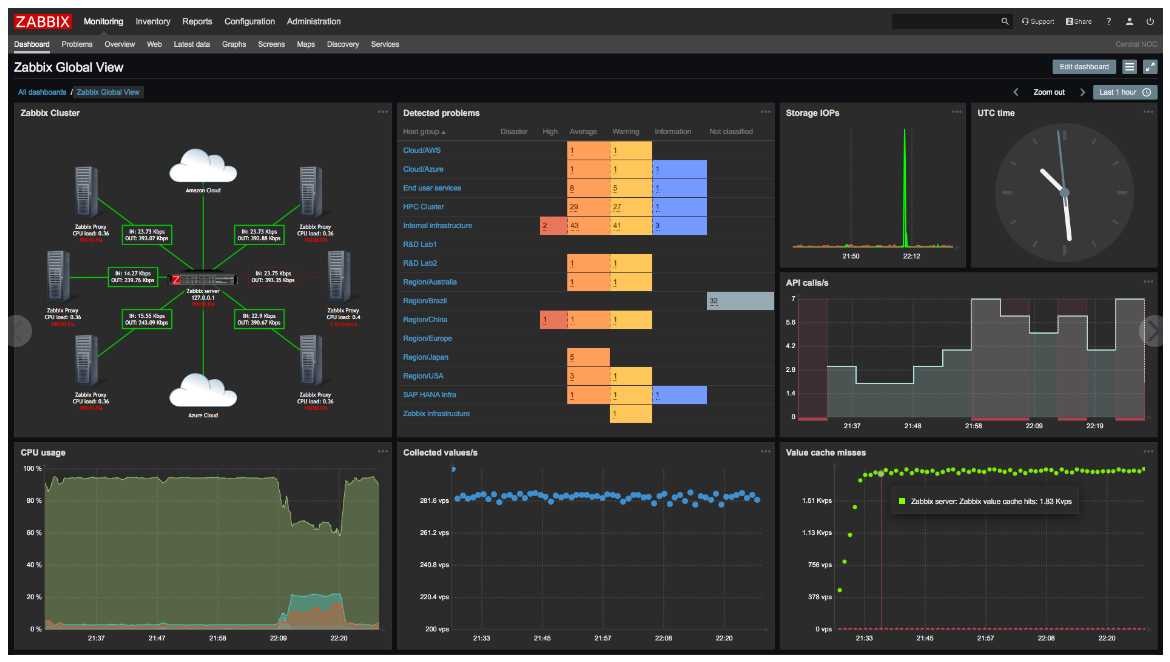
添加host,设置template之后,就可以看到效果了
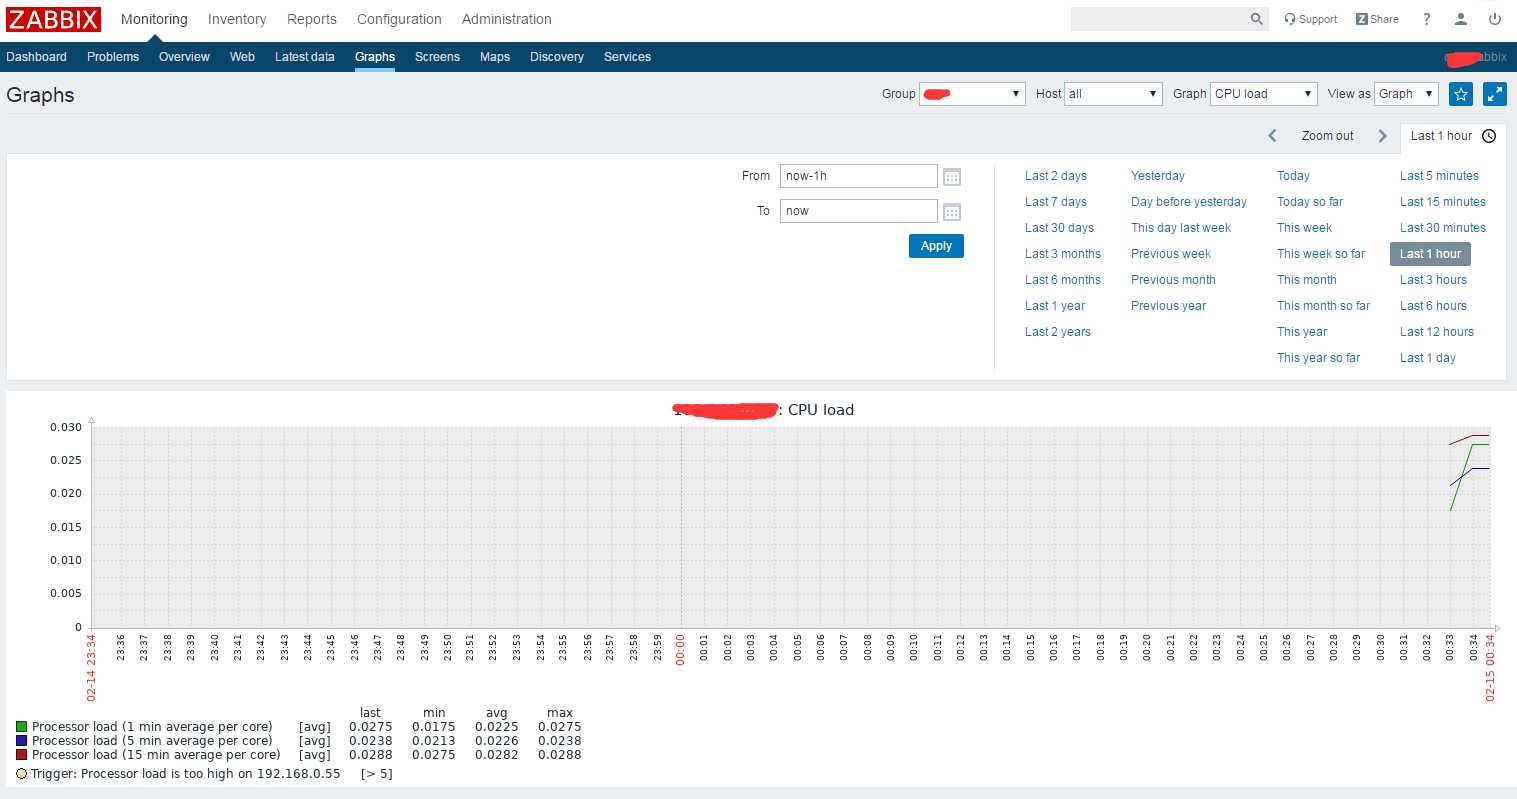
In addition it is important to take a step back and have a look at the overall data flow within Zabbix. In order to create an item that gathers data you must first create a host. Moving to the other end of the Zabbix spectrum you must first have an item to create a trigger. You must have a trigger to create an action. Thus if you want to receive an alert that your CPU load it too high on Server X you must first create a host entry for Server X followed by an item for monitoring its CPU, then a trigger which activates if the CPU is too high, followed by an action which sends you an email. While that may seem like a lot of steps, with the use of templating it really isn‘t. However, due to this design it is possible to create a very flexible setup.
使用帮助:https://www.zabbix.com/documentation/4.0/manual/quickstart
关于java gateway
It is required to install Java gateway only if you want to monitor JMX applications. Java gateway is lightweight and does not require a database.
标签:role get eem yum安装 download front x86_64 lock opera
原文地址:https://www.cnblogs.com/barneywill/p/10380622.html