标签:.gz 关闭防火墙 config job 图片 客户端 结合 次数 nload
1、熟悉配置文件
配置文件/usr/local/prometheus/prometheus.yml
global: #定义全局
scrape_interval: 15s # 每个15s抓取一次数据,默认1分钟。
evaluation_interval: 15s # 监控数据评估规则的评率,跟rule结合实现效果.
alerting: #告警取消,由grafana实现。
alertmanagers:
- static_configs:
- targets:
# - alertmanager:9093
rule_files:
# - "first_rules.yml"
# - "second_rules.yml"
scrape_configs:
- job_name: ‘prometheus‘
static_configs:
#- targets: [‘localhost:9090‘]
- targets: [‘localhost:9100‘,‘hongk:9100‘]
下载:https://prometheus.io/download/
2、安装promethes服务端
[root@prometheus src]# ls prometheus-2.8.0.linux-amd64.tar.gz
[root@prometheus src]# tar -xf prometheus-2.8.0.linux-amd64.tar.gz
[root@prometheus src]# mv prometheus-2.8.0.linux-amd64 /usr/local/prometheus
[root@prometheus src]# cd /usr/local/prometheus/
[root@prometheus prometheus]# ./prometheus
页面访问,注意关闭防火墙。
http://192.168.1.12:9090/graph
浏览器访问,无账号密码验证(可使用类似Apache httppass方式添加)

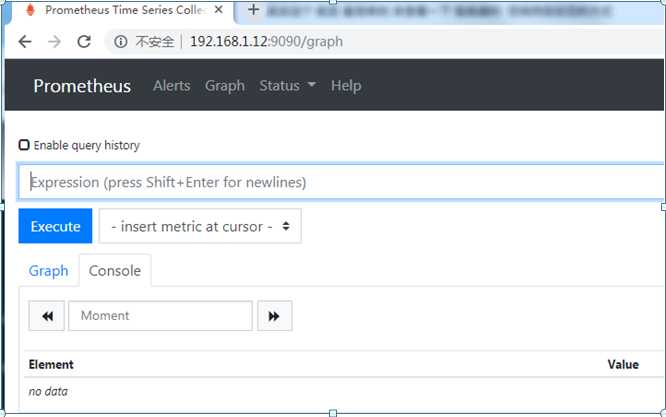
http://192.168.1.12:9090/metrics
以上是服务端启动正常显示。
3、客户端安装:
下载:https://prometheus.io/download/
[root@prometheus local]# cd node_exporter/
[root@prometheus node_exporter]# ./node_exporter
使用curl命令对客户端测试,
[root@prometheus ~]# curl 192.168.1.12:9100/metrics
4、配置服务器
配置服务端,添加客户端服务信息。
页面展示效果,
界面展示如上,数据展示正常。
标签:.gz 关闭防火墙 config job 图片 客户端 结合 次数 nload
原文地址:https://www.cnblogs.com/sunnyyangwang/p/10585752.html