标签:检查 个数 exce 解释 用户 his template ted error
nginx内置了一个status状态的功能,通过配置可以看到nginx的运行情况,status显示的内容包括当前连接数,处于活动状态的连接数,已经处理的请求数等等,可以利用这个功能编写zabbix监控nginx的脚本。
一、agent端配置
1.编辑nginx配置文件,开启status功能
[root@stau66 ~]# vim /usr/local/nginx/conf/nginx.conf
location / {
root html;
index index.php index.html index.htm;
}
#nginx status
location /status {
stub_status on;
access_log off;
allow 192.168.10.0/24;
allow 127.0.0.1;
deny all;
}
#error_page 404 /404.html;
# redirect server error pages to the static page /50x.html
#
error_page 500 502 503 504 /50x.html;
1.1 nginx状态解释
Active connections Nginx正处理的活动链接数个数;重要
server Nginx启动到现在共处理了多少个连接。
accepts Nginx启动到现在共成功创建几次握手。
handled requests Nginx总共处理了几次请求。
Reading Nginx读取到客户端的 Header 信息数。
Writing Nginx返回给客户端的 Header 信息数。
Waiting Nginx已经处理完正在等候下一次请求指令的驻留链接,开启。
Keep-alive的情况下,Waiting这个值等于active-(reading + writing)。
请求丢失数=(握手数-连接数)可以看出,本次状态显示没有丢失请求。
2.安装zabbix的agent端
2.1上传zabbix源码包
[root@stau66 ~]# ls
anaconda-ks.cfg zabbix-3.4.3.tar.gz
2.2 解压
[root@stau66 ~]# tar -xvzf zabbix-3.4.3.tar.gz -C /usr/local/src
2.3 创建用户
[root@stau66 zabbix-3.4.3]# useradd -M -s /sbin/nologin zabbix
2.4 编译和安装
[root@stau66 zabbix-3.4.3]# ./configure --prefix=/usr/local/zabbix --enable-agent &&make install
2.5复制并编辑开机启动脚本
[root@stau66 zabbix-3.4.3]# cp misc/init.d/fedora/core5/zabbix_agentd /etc/init.d
[root@stau66 zabbix-3.4.3]# vim /etc/init.d/zabbix_agentd
ZABBIX_BIN="/usr/local/zabbix/sbin/zabbix_agentd" #修改此行
2.6配置agentd的配置文件
[root@stau66 ~]# vim /usr/local/zabbix/etc/zabbix_agentd.conf
Server=192.168.10.63 #zabbix server 地址,可以多个,用“,”隔开ServerActive=192.168.10.63 #主动检查的意思,主动检查主机的数据发送给 Zabbix server ServerHostname=stau66.top
UnsafeUserParameters=1
Include=/usr/local/zabbix/etc/zabbix_agentd.conf.d/*.conf #此行需要修改和打开
2.7编写nginx监控脚本,内容如下
[root@stau66 ~]# vim /usr/local/zabbix/etc/zabbix_agentd.conf.d/nginx_monit.sh
#/bin/bash
#Description:Automated monitoring nginx performance and process status scripts
NGINX_PORT=80
NGINX_COMMAND=$1
nginx_ping(){
/sbin/pidof nginx |wc -l
}
nginx_active(){
/usr/bin/curl -s "http://127.0.0.1:"$NGINX_PORT"/status/" |awk ‘/Active/ {print $NF}‘
}
nginx_reading(){
/usr/bin/curl -s "http://127.0.0.1:"$NGINX_PORT"/status/" |awk ‘/Reading/ {print $2}‘
}
nginx_writing(){
/usr/bin/curl -s "http://127.0.0.1:"$NGINX_PORT"/status/" |awk ‘/Writing/ {print $4}‘
}
nginx_waiting(){
/usr/bin/curl -s "http://127.0.0.1:"$NGINX_PORT"/status/" |awk ‘/Waiting/ {print $6}‘
}
nginx_accepts(){
/usr/bin/curl -s "http://127.0.0.1:"$NGINX_PORT"/status/" |awk ‘NR==3 {print $1}‘
}
nginx_handled(){
/usr/bin/curl -s "http://127.0.0.1:"$NGINX_PORT"/status/" |awk ‘NR==3 {print $2}‘
}
nginx_requests(){
/usr/bin/curl -s "http://127.0.0.1:"$NGINX_PORT"/status/" |awk ‘NR==3 {print $3}‘
}
case $NGINX_COMMAND in
ping)
nginx_ping
;;
active)
nginx_active
;;
reading)
nginx_reading
;;
writing)
nginx_writing
;;
waiting)
nginx_waiting
;;
accepts)
nginx_accepts
;;
handled)
nginx_handled
;;
requests)
nginx_requests
;;
*)
echo $"USAGE:$0 {ping|active|reading|writing|waiting|accepts|handled|requests}"
esac
2.8 给脚本添加执行权限
[root@stau66 ~]# chmod +x /usr/local/zabbix/etc/zabbix_agentd.conf.d/nginx_monit.sh
2.9编辑agent端监控nginx状态配置文件,内容如下
[root@stau66 ~]# vim /usr/local/zabbix/etc/zabbix_agentd.conf.d/userparameter_znginx.conf
#
# This is a sample zabbix_agentd config file.
# Put it to /etc/zabbix_agentd.conf.d or otherwise integrate into agent config.
# Edit to your needs.
#
UserParameter=status[*],/bin/bash /usr/local/zabbix/etc/zabbix_agentd.conf.d/nginx_monit.sh \$1
2.10 重启动服务
[root@stau66 ~]# systemctl enable zabbix_agentd
zabbix_agentd.service is not a native service, redirecting to /sbin/chkconfig.
Executing /sbin/chkconfig zabbix_agentd on
[root@stau66 ~]# systemctl restart zabbix_agentd
[root@stau66 ~]# systemctl reload nginx
二、服务端配置
1)server端验证是否能获取agent端的key值
[root@stau63 ~]# /usr/local/zabbix/bin/zabbix_get -s 192.168.10.66 -k status[active]
1
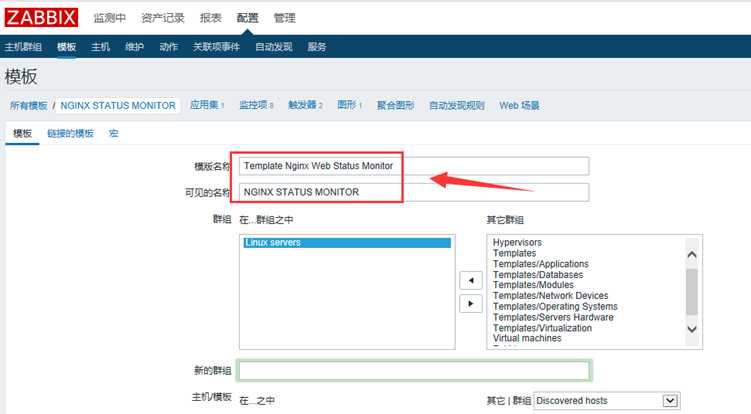
2)添加模板
模版名称:Template Nginx Web Status Monitor
可见的名称:NGINX STATUS MONITOR
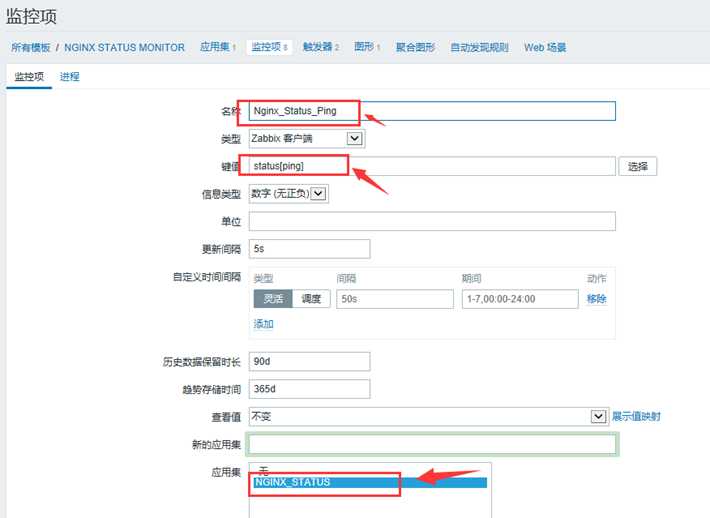
3)定义应用集
名称:NGINX_STATUS

4)定义监控项:这里我只写了一个,其它类似添加
创建监控项要注意命名方式,能够见名知意,最关键的是键值 ,这里的键值一定要和agent端的配置文件中定义的键值一致
名称:Nginx_Status_Ping
键值:status[ping]
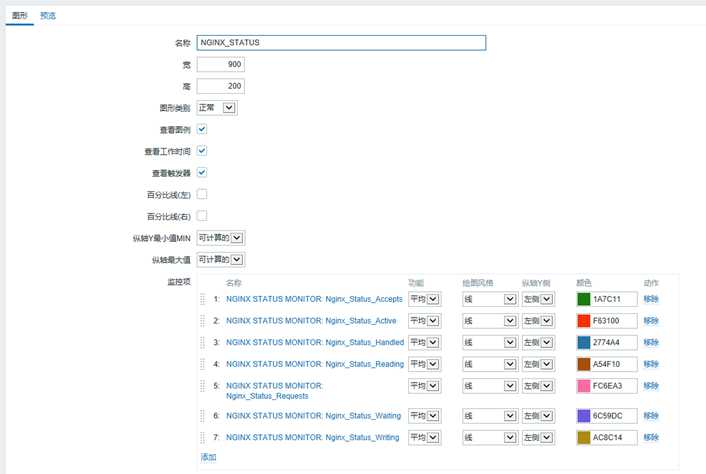
5)定义图形
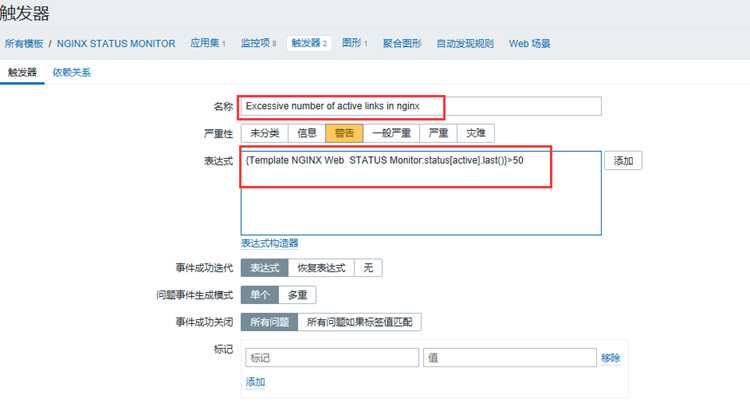
6)自定义触发器
a. 超过50个并发连接就执行报警
名称:Excessive number of active links in nginx
表达式:{Template NGINX Web STATUS Monitor:status[active].last()}>50
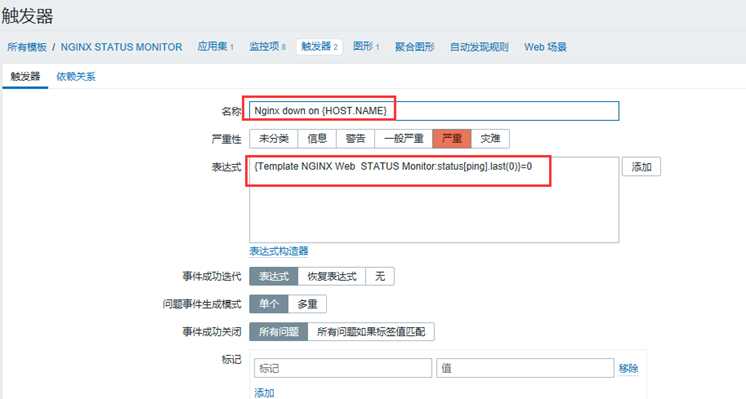
b.NGINX服务down了执行报警
名称:Nginx down on {HOST.NAME}
表达式:{Template NGINX Web STATUS Monitor:status[ping].last(0)}=0
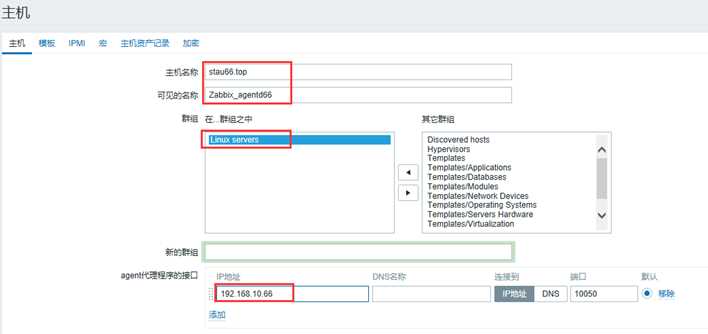
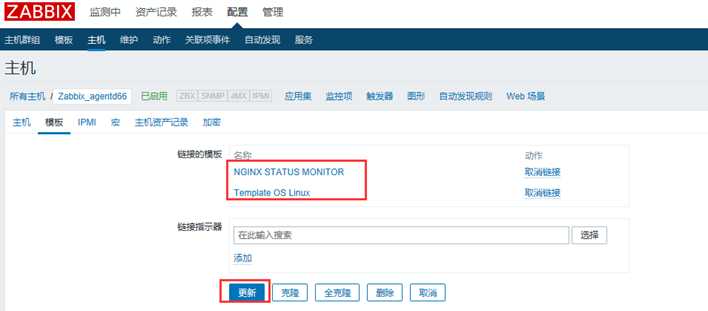
7)创建主机并关联模板
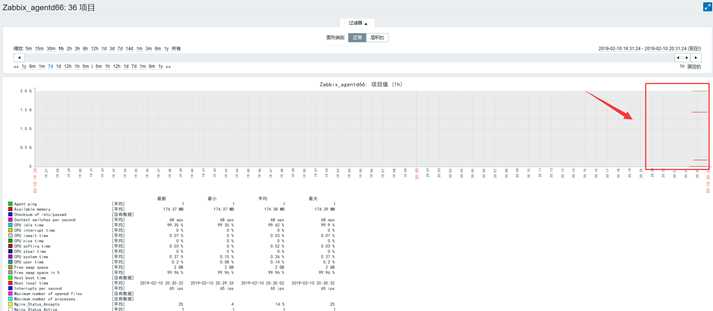
8)稍等一会,等待出图
开始出图
9)配合自动发送邮件脚本验证触发器效果
[root@stau66 ~]# systemctl stop nginx

收到邮件表示搭建监控nginx脚本完成

标签:检查 个数 exce 解释 用户 his template ted error
原文地址:https://www.cnblogs.com/stau/p/10739583.html