标签:idt mic apple com fit ssi wro hat put
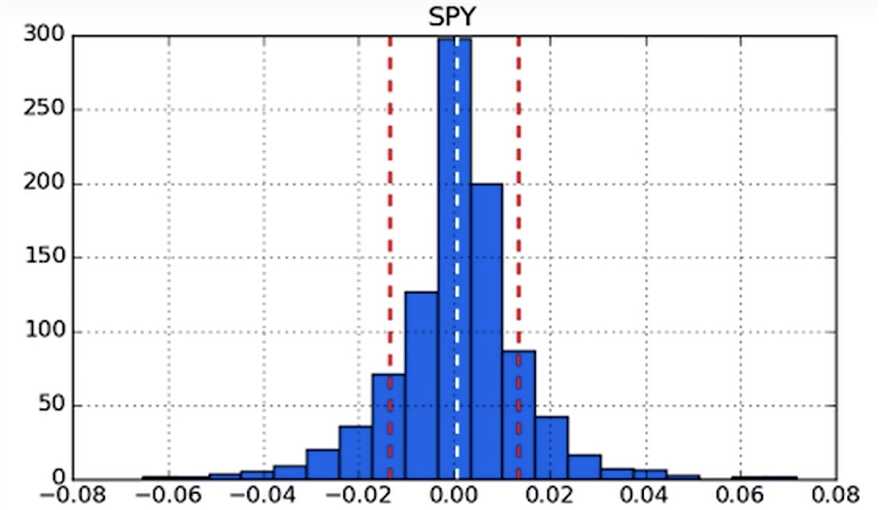
A closer look at daily returns
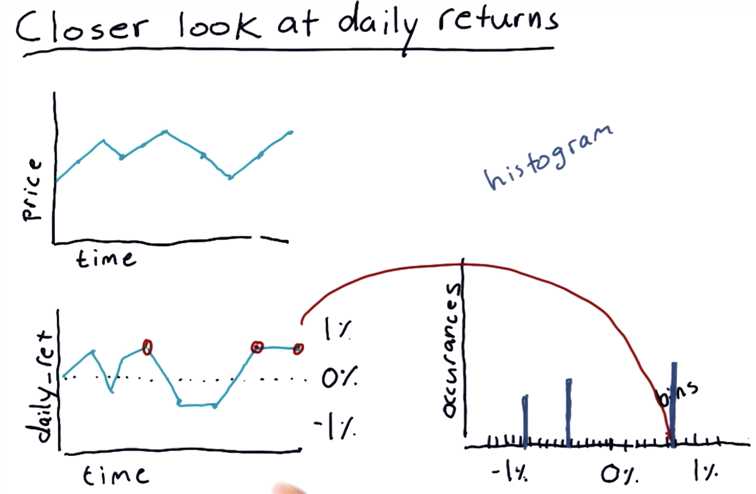
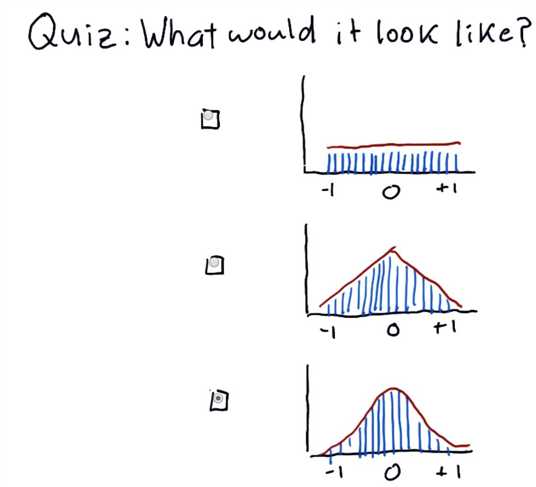
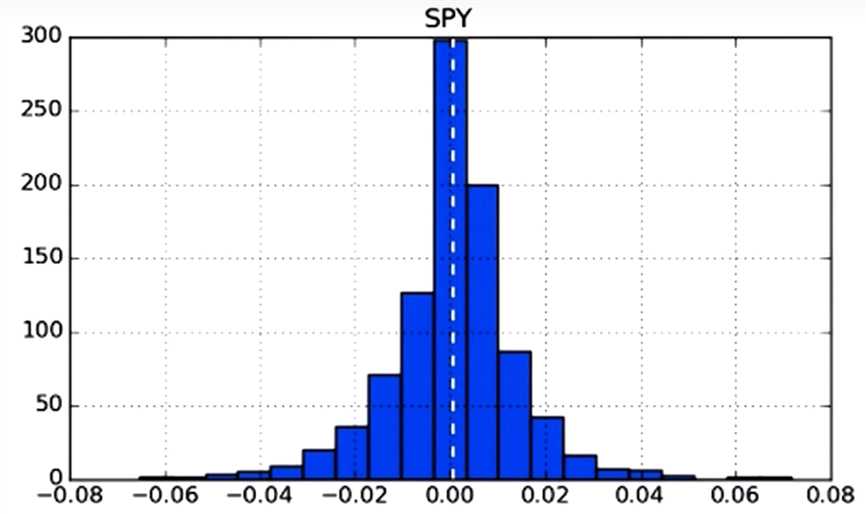
Histogram of daily returns
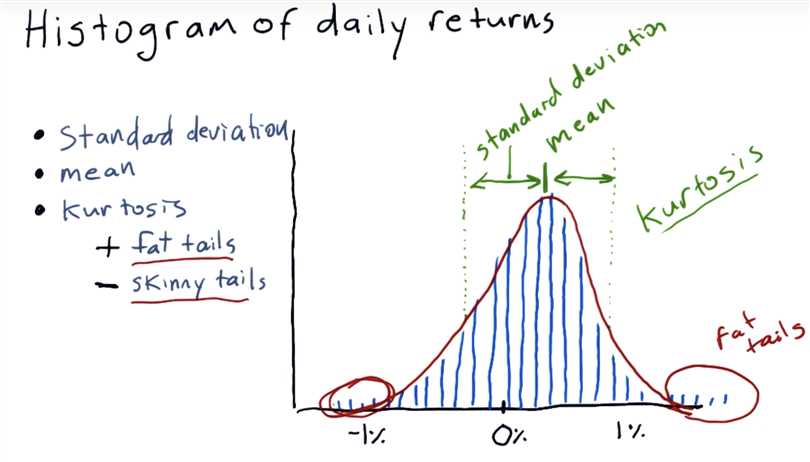
gaussian => kurtosis = 0
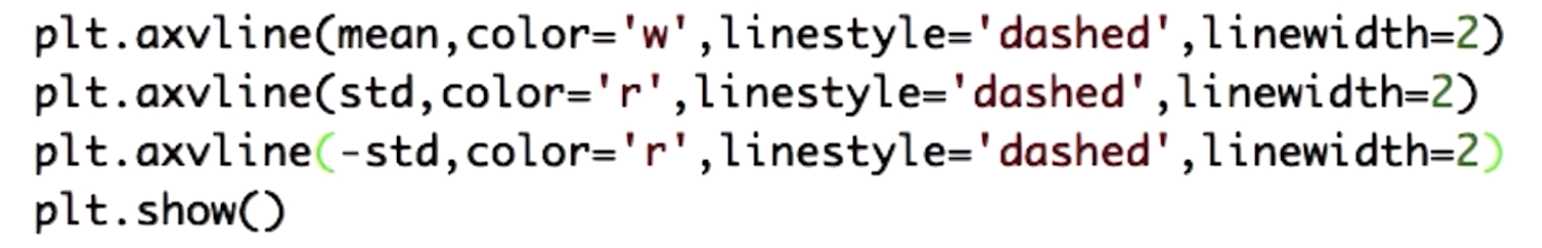
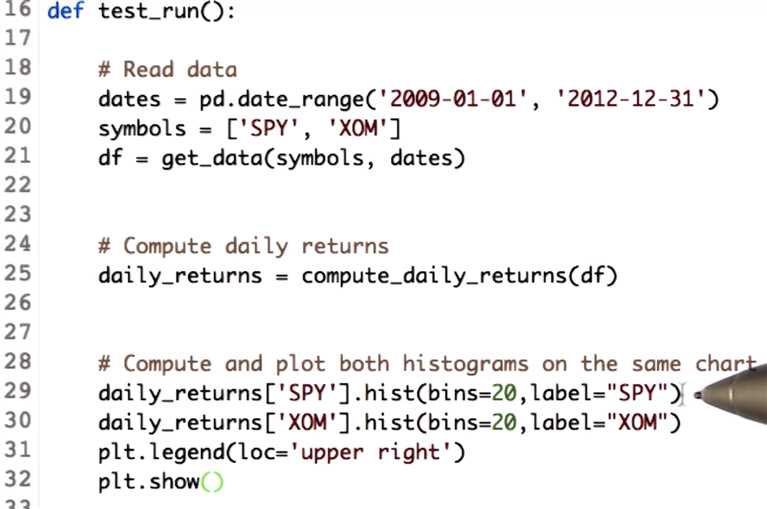
How to plot a histogram

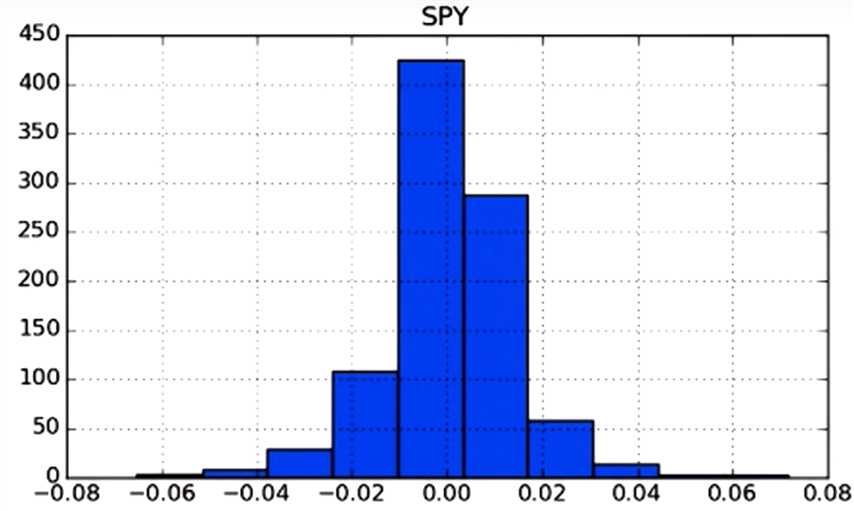
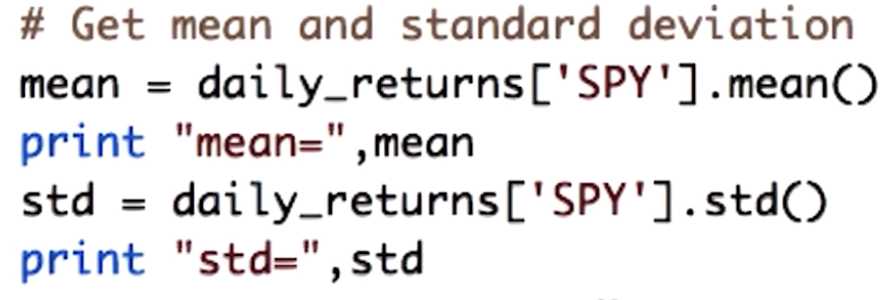
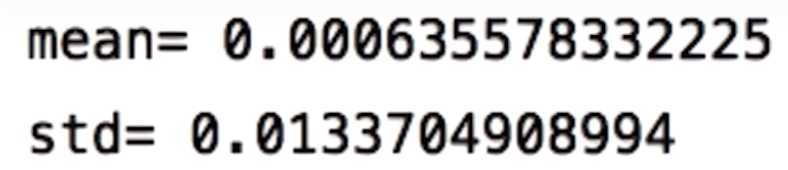
Computing histogram statistics

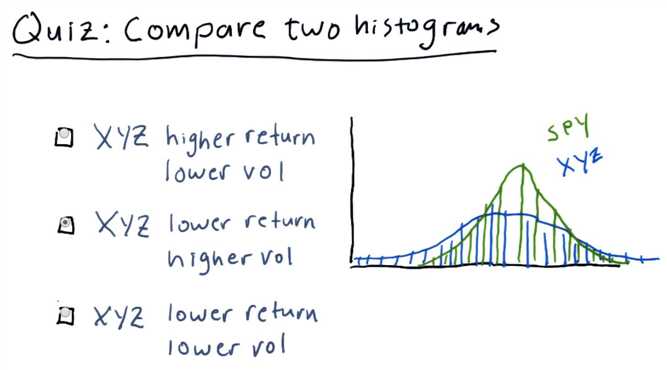
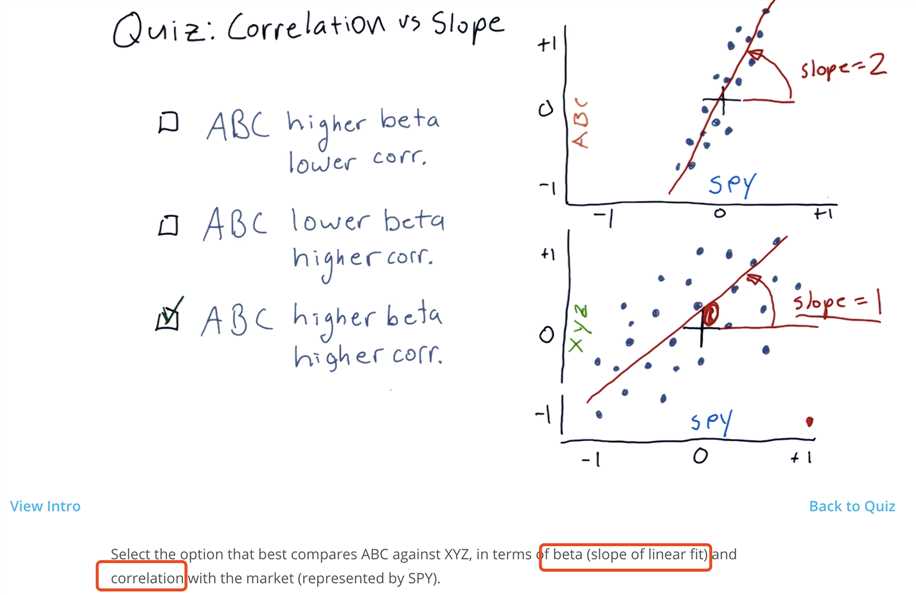
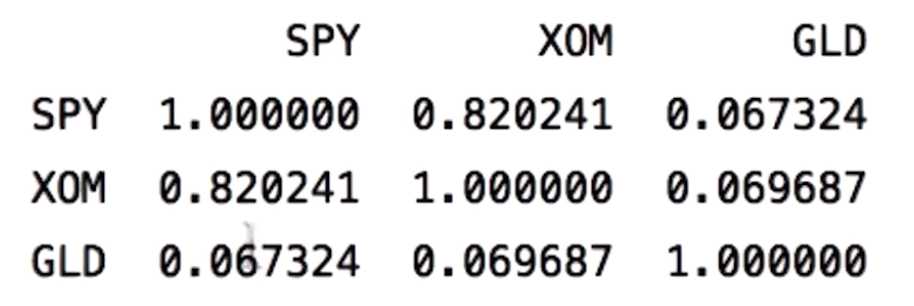
Select the option that best describes the relationship between XYZ and SPY.
Note:
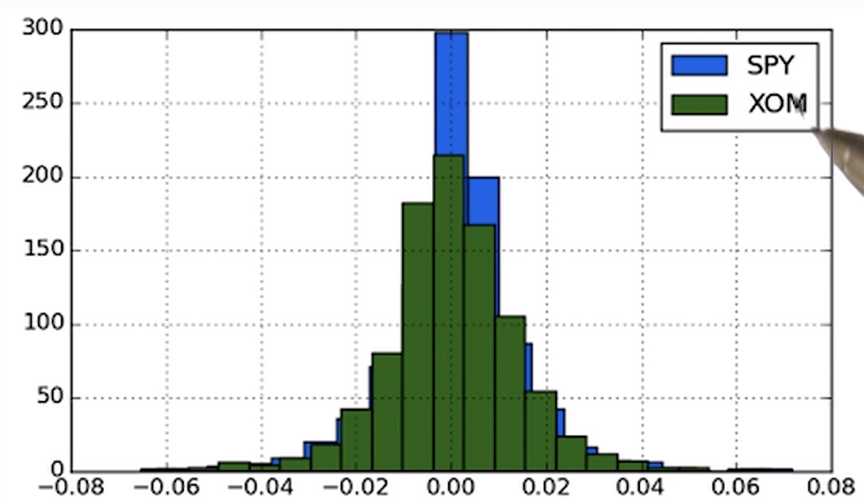
Plot two histograms together
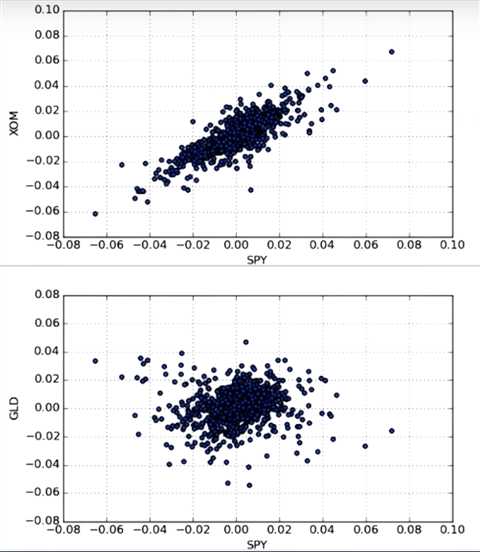
Scatterplots
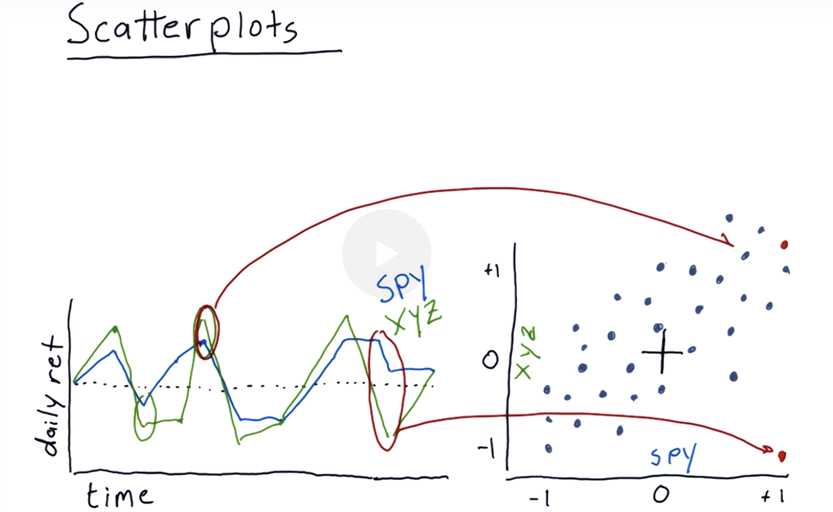
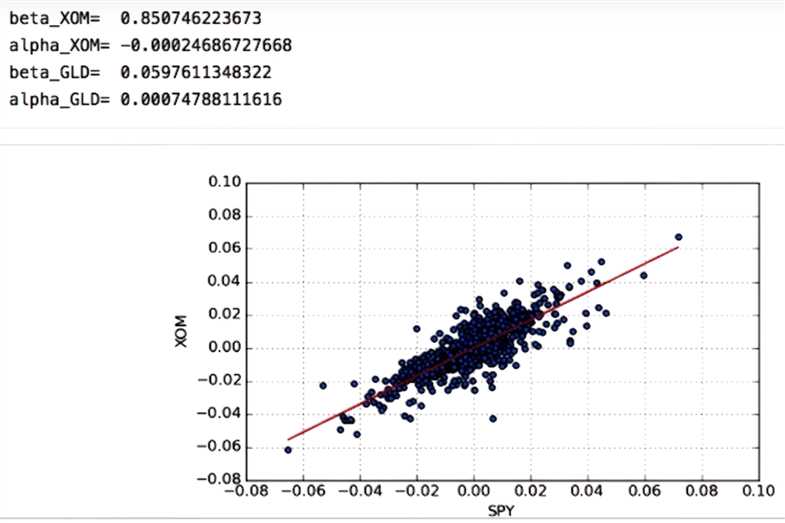
Fitting a line to data points
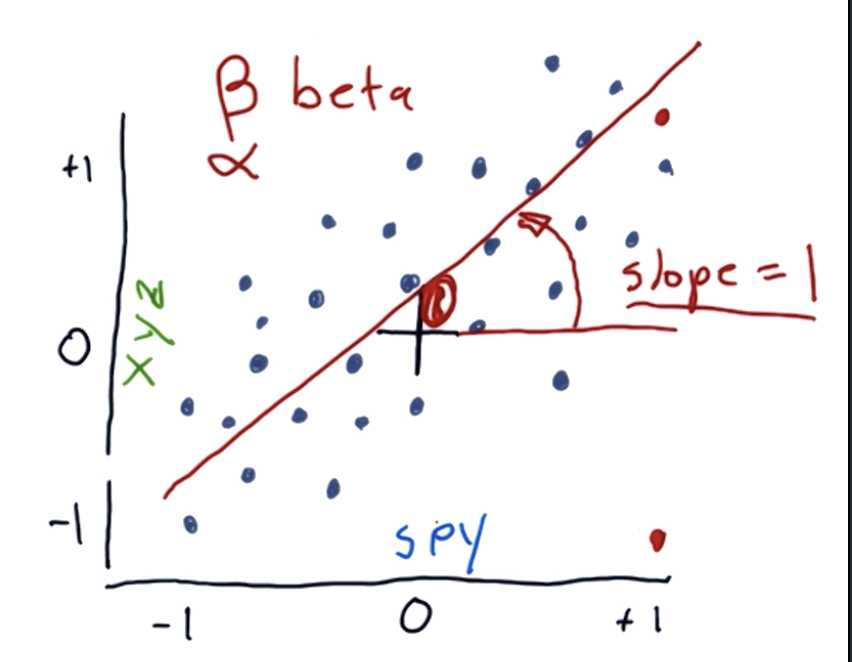
Slope does not equal correlation
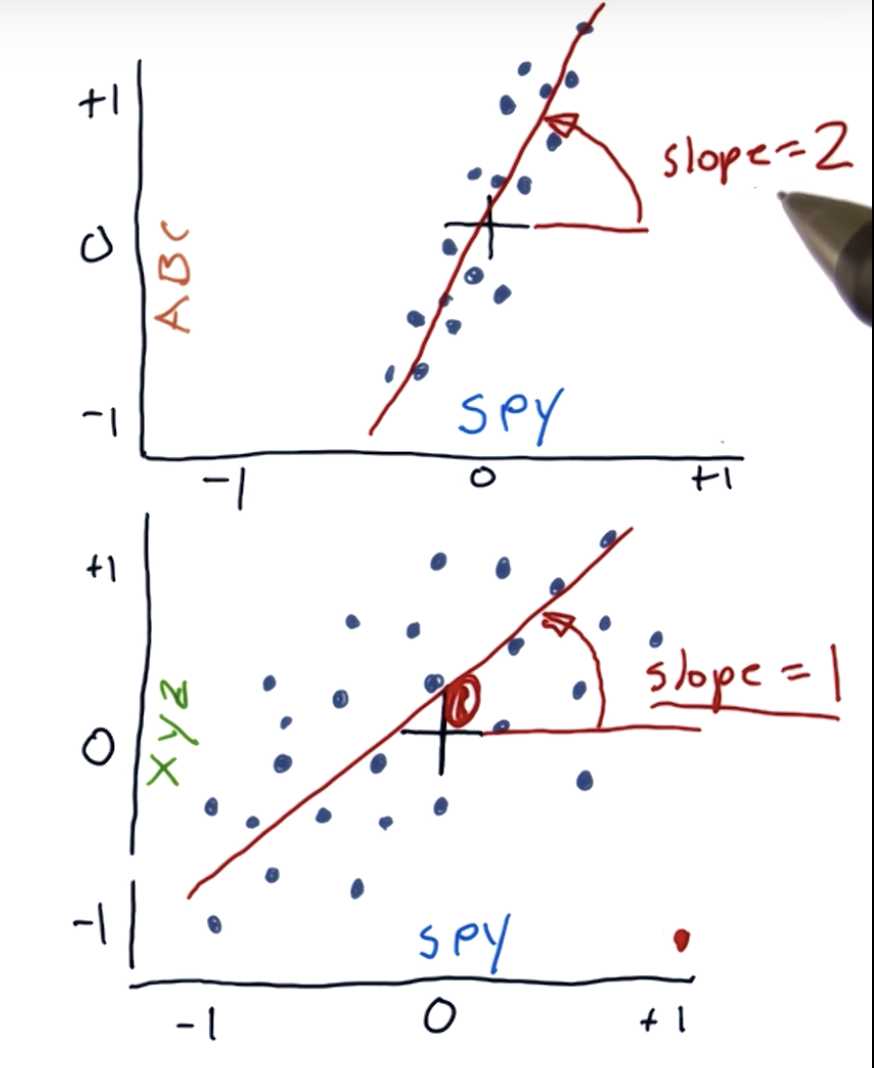
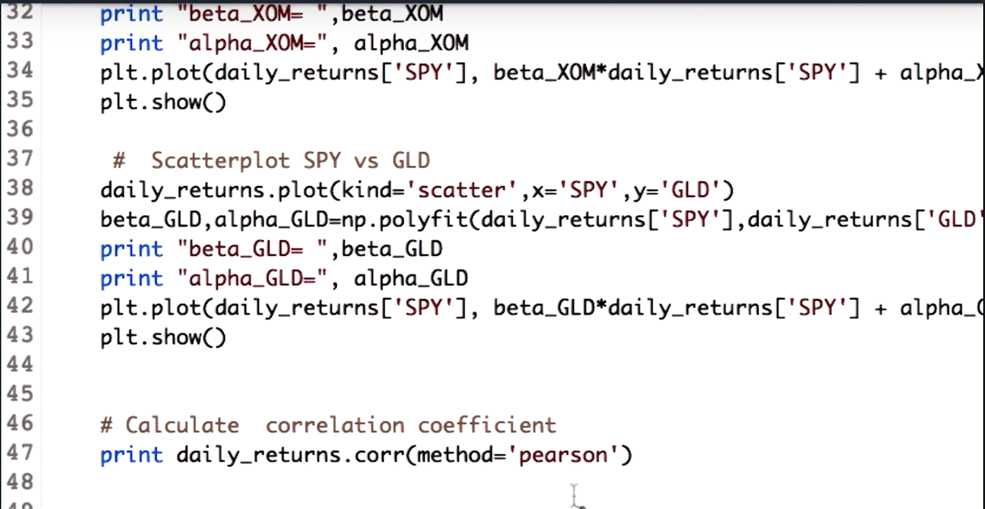
Correlation vs slope
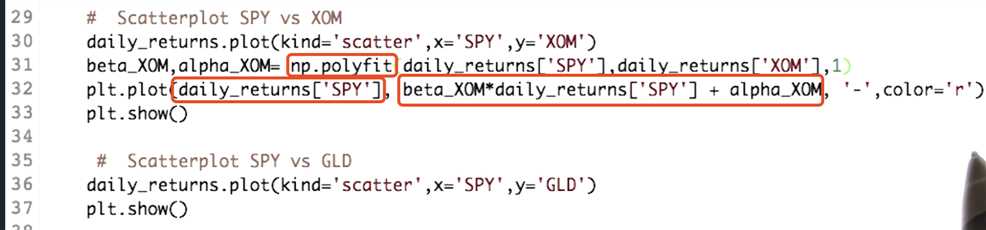
Scatterplots in python

Real world use of kurtosis
In early 2000s investment banks built bonds based on mortgages( morgage: 抵押) => assume these mortgages was normally distributed
=> on that basis, they were able to show that these bonds had low probability of fault => 2 mistakes
=> (1) return of each mortagage was independent
=> (2) using gassian distrubution discribing the return
(1) and (2) were proved to be wrong => precipitated the great recession of 2008
[Machine Learning for Trading] {ud501} Lesson 7: 01-06 Histograms and scatter plots
标签:idt mic apple com fit ssi wro hat put
原文地址:https://www.cnblogs.com/ecoflex/p/10972290.html