标签:外部 窗体 start 效果图 源码 Painter 收藏 bar 写作
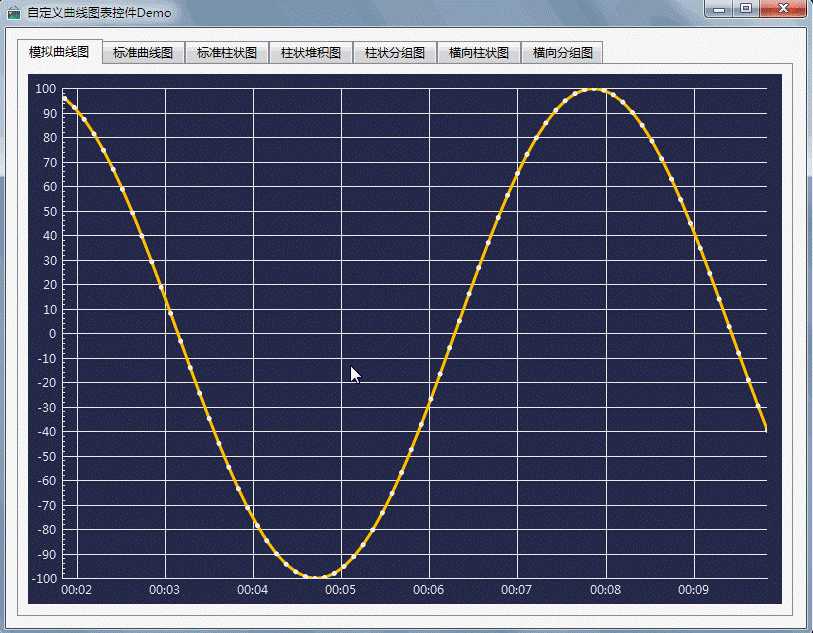
上次在写大屏数据可视化电子看板系统时候,提到过改造QCustomPlot来实现柱状分组图、横向柱状图、横向分组图、鼠标悬停提示等。这次单独列出来描述,有很多人疑问为啥不用QChart,或者echart等形式,其实这两种方式我都尝试过,比如Qt5.7以后新增的QChart模块,曲线这块,支持数据量很小,而且用法极其不适应,非常别扭,尤其是10W以上数据量的支持,简直是渣渣,优点也是有很多的,比如动画效果,我看过他的完整源码,动画这块处理的非常好,连坐标轴都可以有动画效果,而且支持很多种效果,而且内置了很多套theme皮肤,省去了很多渣渣审美的程序员自己来配色,这个倒是挺方便的。而对于echart,必须依赖浏览器控件,资源占用比较高,后面决定采用改造QCustomPlot来实现用户需要的各种图表效果。
在整个改造的过程中,全部封装成易用的函数,传入参数即可,同时还支持全局样式更改,支持样式表控制整体颜色更改,考虑了很多细节,比如弹出悬停信息的位置等,都自动计算显示在最佳最合理位置。考虑到很多人用的QCustomPlot1.0,特意还做了QCustomPlot1.0和2.0的完全兼容。
void CustomPlot::setDataLine(int index, const QString &name, const QVector<double> &key, const QVector<double> &value)
{
    if (customPlot->graphCount() > index) {
        customPlot->graph(index)->setName(name);
        customPlot->graph(index)->setData(key, value);
        customPlot->xAxis->setRange(-offsetX, key.count() + offsetX, Qt::AlignLeft);

        //超过3条线条颜色设置颜色集合的颜色
        if (index >= 3) {
            setColor(index, colors.at(index));
        } else {
            setColor(0, colors.at(0));
            setColor(1, colors.at(1));
            setColor(2, colors.at(2));
        }
    }
}

void CustomPlot::setDataBarv(const QStringList &rowNames,
                             const QStringList &columnNames,
                             const QList<QVector<double> > &values,
                             const QColor &borderColor,
                             int valuePosition,
                             int valuePrecision,
                             const QColor &valueColor,
                             bool checkData)
{
    //只有1列的才能设置
    if (columnNames.count() != 1) {
        return;
    }

    //可以直接用堆积图,因为只有一列的柱状图不会形成堆积
    setDataBars(rowNames, columnNames, values, borderColor, valuePosition, valuePrecision, valueColor, checkData);
}

void CustomPlot::setDataBarvs(const QStringList &rowNames,
                              const QStringList &columnNames,
                              const QList<QVector<double> > &values,
                              const QColor &borderColor,
                              int valuePosition,
                              int valuePrecision,
                              const QColor &valueColor,
                              bool checkData)
{
    //过滤个数不一致数据,防止索引越界
    int rowCount = rowNames.count();
    int columnCount = columnNames.count();
    int valueCount = values.count();
    if (columnCount == 0 || valueCount == 0 || columnCount != valueCount) {
        return;
    }

    //设置网格线不显示,会更好看
    customPlot->xAxis->grid()->setVisible(false);
    //customPlot->yAxis->grid()->setVisible(false);

    //设置横坐标文字描述
    QVector<double> ticks;
    QVector<QString> labels;
    int count = rowCount * columnCount;
    for (int i = 0; i < rowCount; i++) {
        ticks << 1.5 + (i * columnCount);
        labels << rowNames.at(i);
    }

    setLabX(ticks, labels);
    customPlot->xAxis->setRange(0, count + 1);

    for (int i = 0; i < columnCount; i++) {
        //同样也要先过滤个数是否符合要求
        QVector<double> value = values.at(i);
        if (rowCount != value.count()) {
            continue;
        }

        //创建柱状图
        CustomBarv *bar = new CustomBarv(customPlot->xAxis, customPlot->yAxis);
        bar->setCheckData(checkData);

        //设置宽度比例
        bar->setWidth(0.9);

        //设置显示值的位置 0-不绘制 1-顶部上面 2-顶部居中 3-中间居中 4-底部居中
        bar->setValuePostion(valuePosition);
        bar->setValuePrecision(valuePrecision);
        bar->setValueColor(valueColor);

        //设置名称
        bar->setName(columnNames.at(i));

        //设置颜色,取颜色集合
        QColor color = QColor(51, 204, 255);
        if (i < colors.count()) {
            color = colors.at(i);
        }

        //边缘高亮,如果传入了边框颜色则取边框颜色
        bar->setPen(QPen(borderColor == Qt::transparent ? color.light(150) : borderColor));
        bar->setBrush(color);

        //这个算法很巧妙,想了很久
        QVector<double> ticks;
        double offset = i * 0.9;
        for (int j = 0; j < rowCount; j++) {
            ticks << 1.0 + (j * columnCount) + offset;
        }

        //设置数据
        bar->setData(ticks, value);
    }
}

void CustomPlot::setDataBarh(const QStringList &rowNames,
                             const QStringList &columnNames,
                             const QList<QVector<double> > &values,
                             const QColor &borderColor,
                             int valuePosition,
                             int valuePrecision,
                             const QColor &valueColor,
                             bool checkData)
{
    //只有1列的才能设置
    if (columnNames.count() != 1) {
        return;
    }

    //过滤个数不一致数据,防止索引越界
    int rowCount = rowNames.count();
    int columnCount = columnNames.count();
    int valueCount = values.count();
    if (columnCount == 0 || valueCount == 0 || columnCount != valueCount) {
        return;
    }

    //设置网格线不显示,会更好看
    customPlot->xAxis->grid()->setVisible(false);
    customPlot->yAxis->grid()->setVisible(false);
    customPlot->yAxis->setTickLength(0, 0);

    //设置横坐标文字描述
    QVector<double> ticks;
    QVector<QString> labels;
    int count = rowCount * columnCount;
    double padding = 1;
    for (int i = 0; i < rowCount; i++) {
        ticks << padding + (i * columnCount);
        labels << rowNames.at(i);
    }

    setLabY(ticks, labels);
    customPlot->yAxis->setRange(0, count + 1);

    //先计算出每个柱子占用的高度
    double barHeight = 0.7;
    for (int i = 0; i < columnCount; i++) {
        //同样也要先过滤个数是否符合要求
        QVector<double> value = values.at(i);
        if (rowCount != value.count()) {
            continue;
        }

        //先绘制系列1的数据,再绘制系列2,依次类推
        for (int j = 0; j < rowCount; j++) {
            //创建横向柱状图
            double y = (0.67 + (j * columnCount));
            CustomBarh *bar = new CustomBarh(customPlot);
            bar->setCheckData(checkData);
            bar->setRect(QPointF(0, y), QPointF(value.at(j), y + barHeight));
            bar->setValue(value.at(j));

            //设置显示值的位置 0-不绘制 1-顶部上面 2-顶部居中 3-中间居中 4-底部居中
            bar->setValuePostion(valuePosition);
            bar->setValuePrecision(valuePrecision);
            bar->setValueColor(valueColor);

            //设置颜色,取颜色集合
            QColor color = QColor(51, 204, 255);
            if (i < colors.count()) {
                color = colors.at(i);
            }

            //边缘高亮,如果传入了边框颜色则取边框颜色
            bar->setPen(QPen(borderColor == Qt::transparent ? color.light(150) : borderColor));
            bar->setBrush(color);
        }
    }
}

void CustomPlot::setDataBarhs(const QStringList &rowNames,
                              const QStringList &columnNames,
                              const QList<QVector<double> > &values,
                              const QColor &borderColor,
                              int valuePosition,
                              int valuePrecision,
                              const QColor &valueColor,
                              bool checkData)
{
    //过滤个数不一致数据,防止索引越界
    int rowCount = rowNames.count();
    int columnCount = columnNames.count();
    int valueCount = values.count();
    if (columnCount == 0 || valueCount == 0 || columnCount != valueCount) {
        return;
    }

    //设置网格线不显示,会更好看
    customPlot->xAxis->grid()->setVisible(false);
    customPlot->yAxis->grid()->setVisible(false);
    customPlot->yAxis->setTickLength(0, 0);
    customPlot->xAxis->setVisible(false);

    //设置横坐标文字描述
    QVector<double> ticks;
    QVector<QString> labels;
    int count = rowCount * columnCount;
    //这个算法想了很久,很牛逼
    double padding = 1.5 + (columnCount - 2) * 0.4;
    for (int i = 0; i < rowCount; i++) {
        ticks << padding + (i * columnCount);
        labels << rowNames.at(i);
    }

    setLabY(ticks, labels);
    customPlot->yAxis->setRange(0, count + 1);

    //先计算出每个柱子占用的高度
    double barHeight = 0.8;
    for (int i = 0; i < columnCount; i++) {
        //同样也要先过滤个数是否符合要求
        QVector<double> value = values.at(i);
        if (rowCount != value.count()) {
            continue;
        }

        //先绘制系列1的数据,再绘制系列2,依次类推
        for (int j = 0; j < rowCount; j++) {
            //创建横向柱状图
            double y = (0.7 + i * barHeight + (j * columnCount));
            CustomBarh *bar = new CustomBarh(customPlot);
            bar->setCheckData(checkData);
            bar->setRect(QPointF(0, y), QPointF(value.at(j), y + barHeight));
            bar->setValue(value.at(j));

            //设置显示值的位置 0-不绘制 1-顶部上面 2-顶部居中 3-中间居中 4-底部居中
            bar->setValuePostion(valuePosition);
            bar->setValuePrecision(valuePrecision);
            bar->setValueColor(valueColor);

            //设置颜色,取颜色集合
            QColor color = QColor(51, 204, 255);
            if (j < colors.count()) {
                color = colors.at(j);
            }

            //边缘高亮,如果传入了边框颜色则取边框颜色
            bar->setPen(QPen(borderColor == Qt::transparent ? color.light(150) : borderColor));
            bar->setBrush(color);
        }
    }
}

void CustomPlot::setDataBars(const QStringList &rowNames,
                             const QStringList &columnNames,
                             const QList<QVector<double> > &values,
                             const QColor &borderColor,
                             int valuePosition,
                             int valuePrecision,
                             const QColor &valueColor,
                             bool checkData)
{
    //过滤个数不一致数据,防止索引越界
    int rowCount = rowNames.count();
    int columnCount = columnNames.count();
    int valueCount = values.count();
    if (columnCount == 0 || valueCount == 0 || columnCount != valueCount) {
        return;
    }

    //设置网格线不显示,会更好看
    customPlot->xAxis->grid()->setVisible(false);
    //customPlot->yAxis->grid()->setVisible(false);

    //先清空原有柱状图
    bars.clear();

    //设置横坐标文字描述
    QVector<double> ticks;
    QVector<QString> labels;
    for (int i = 0; i < rowCount; i++) {
        ticks << i + 1;
        labels << rowNames.at(i);
    }

    setLabX(ticks, labels);
    customPlot->xAxis->setRange(0, rowCount + 1);

    for (int i = 0; i < columnCount; i++) {
        //同样也要先过滤个数是否符合要求
        QVector<double> value = values.at(i);
        if (rowCount != value.count()) {
            continue;
        }

        //创建柱状堆积图
        CustomBarv *bar = new CustomBarv(customPlot->xAxis, customPlot->yAxis);
        bar->setCheckData(checkData);

        //设置宽度比例
        bar->setWidth(0.6);

        //设置显示值的位置 0-不绘制 1-顶部上面 2-顶部居中 3-中间居中 4-底部居中
        bar->setValuePostion(valuePosition);
        bar->setValuePrecision(valuePrecision);
        bar->setValueColor(valueColor);

#ifndef old
        //设置堆积间隙
        if (borderColor != Qt::transparent) {
            bar->setStackingGap(1);
        }
#endif
        //设置名称
        bar->setName(columnNames.at(i));

        //设置颜色,取颜色集合
        QColor color = QColor(51, 204, 255);
        if (i < colors.count()) {
            color = colors.at(i);
        }

        //边缘高亮,如果传入了边框颜色则取边框颜色
        if (columnCount > 1 && borderColor == Qt::transparent) {
            bar->setPen(Qt::NoPen);
        } else {
            bar->setPen(QPen(borderColor == Qt::transparent ? color.light(150) : borderColor));
        }

        bar->setBrush(color);

        //设置堆积层叠顺序,后面那个移到前一个上面
        bars << bar;
        if (i > 0) {
            bar->moveAbove(bars.at(i - 1));
        }

        //设置数据
        bar->setData(ticks, value);
    }
}
标签:外部 窗体 start 效果图 源码 Painter 收藏 bar 写作
原文地址:https://www.cnblogs.com/feiyangqingyun/p/10991761.html