标签:near mic col roi uniq 聚类 htm form fit
前言:机器学习所使用的数据大多具有很多的特征,想要直观的对数据的分布和特征之间的关系进行观测,需要将数据的主要特征提取出来,降低到三维及三维以下的空间来展示。
PCA(主成分分析)是常用的用于降维的方法,本文通过PCA对数据进行降维,再对降维后的数据用K-means算法聚类,以达到在低维空间可直观观察的目的。
(本文使用数字识别数据集,共1797个样本,每个样本是64维向量(8*8),分为10个数字)
在二维空间可视化的效果如图:黑色的为样本点,白色叉号是聚类中心。
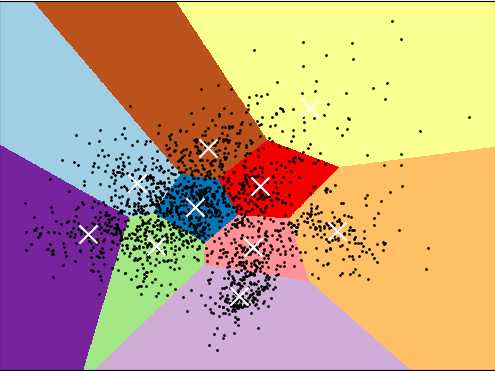
 1 from time import time
 2 import numpy as np
 3 import pandas as pd
 4 import matplotlib as mpl
 5 import matplotlib.pyplot as plt
 6 import sklearn
 7 from sklearn import datasets
 8 from sklearn.datasets import load_digits
 9 from sklearn.preprocessing import scale
10 from sklearn import metrics
11 from sklearn.cluster import KMeans
12 from sklearn.decomposition import PCA
13
14 np.random.seed(42)
15
16 #1. 加载数据集
17 digits = load_digits()
18
19 #2. 对数据集进行归一化缩放处理
20 data = scale(digits.data)
21
22 #3. 数据基本信息:1797个样本,每个样本是64维向量(8*8),分为10个数字
23 n_samples, n_features = data.shape
24 n_digits = len(np.unique(digits.target))
25 labels = digits.target
26
27 #4. 使用PCA提取2个主成份
28 reduced_data = PCA(n_components=2).fit_transform(data)
29
30 #5. 使用K均值进行聚类,目标聚为10类
31 kmeans = KMeans(init=‘k-means++‘, n_clusters=n_digits, n_init=10)
32
33 #6. 将PCA降维后的数据送入K均值模型
34 kmeans.fit(reduced_data)
35
36 #7. 打印图片背景
37 h = .02 #越小越精细,越大越粗糙
38 # 计算边界用于分配颜色
39 x_min, x_max = reduced_data[:, 0].min() - 1, reduced_data[:, 0].max() + 1
40 y_min, y_max = reduced_data[:, 1].min() - 1, reduced_data[:, 1].max() + 1
41 xx, yy = np.meshgrid(np.arange(x_min, x_max, h), np.arange(y_min, y_max, h))
42 # 使用K-means模型进行聚类
43 Z = kmeans.predict(np.c_[xx.ravel(), yy.ravel()])
44 # 显示颜色底部图片
45 Z = Z.reshape(xx.shape)
46 plt.figure(1)
47 plt.clf()
48 plt.imshow(Z, interpolation=‘nearest‘,
49            extent=(xx.min(), xx.max(), yy.min(), yy.max()),
50            cmap=plt.cm.Paired,
51            aspect=‘auto‘, origin=‘lower‘)
52
53 #8. 打印数据点
54 plt.plot(reduced_data[:, 0], reduced_data[:, 1], ‘k.‘, markersize=2)
55
56 #9. 打印聚类中心
57 centroids = kmeans.cluster_centers_#shape(10,2)
58 plt.scatter(centroids[:, 0], centroids[:, 1],
59             marker=‘x‘, s=169, linewidths=3,
60             color=‘w‘, zorder=10)
61
62 #10. 显示图像
63 plt.xlim(x_min, x_max)
64 plt.ylim(y_min, y_max)
65 plt.xticks(())
66 plt.yticks(())
67 plt.show()
注:本文代码搬运自sk-learn官方示例:https://scikit-learn.org/stable/auto_examples/cluster/plot_kmeans_digits.html#sphx-glr-auto-examples-cluster-plot-kmeans-digits-py,对代码中的注释进行了翻译。
标签:near mic col roi uniq 聚类 htm form fit
原文地址:https://www.cnblogs.com/asenyang/p/11215499.html