标签:解决 ORC 编写 问题 默认 场景 内存占用 占用 src
作为一个golang coder,使用golang编写代码是基本的要求。
能够写出代码,并能够熟悉程序执行过程中各方面的性能指标,则是更上一层楼。
如果在程序出现性能问题的时候,可以快速定位和解决问题,那么写起代码来,会更加自信。
本文介绍的pprof,是golang 自带性能剖析工具,可以帮助定位程序中可能存在的问题。
例子代码如下:
package main

import (
        "log"
        _ "net/http/pprof"
        "net/http"
        "time"
)

func main() {

        go func() {
                log.Println(http.ListenAndServe("localhost:6060", nil))
        }()

        go worker()

        select{}
}

// simple worker
func worker(){

        strSlice := []string{}
        for {
                str := "hello world "
                strSlice = append(strSlice, str)

                time.Sleep(time.Second)
        }

}代码开始引入net/http/pprof,在端口6060启动http服务。
启动应用程序
go build simple.go

./simpe使用heap profile查看内存使用情况。
go tool pprof http://localhost:6060/debug/pprof/heap
Fetching profile over HTTP from http://localhost:6060/debug/pprof/heap
Saved profile in /Users/lanyang/pprof/pprof.alloc_objects.alloc_space.inuse_objects.inuse_space.001.pb.gz
Type: inuse_space
Time: Sep 21, 2019 at 1:56pm (CST)
Entering interactive mode (type "help" for commands, "o" for options)
(pprof)
(pprof) top10
Showing nodes accounting for 514kB, 100% of 514kB total
      flat  flat%   sum%        cum   cum%
     514kB   100%   100%      514kB   100%  unicode.init
         0     0%   100%      514kB   100%  runtime.doInit
         0     0%   100%      514kB   100%  runtime.main
(pprof)默认的Type是inuse_space,即常驻内存.
与之对应的是alloc_objects,表示临时分配的内存。
列出top10的内存占用。
使用cpu profile查看cpu使用情况。
例如查看过去30s的cpu profile
go tool pprof http://localhost:6060/debug/pprof/profile?seconds=30
Fetching profile over HTTP from http://localhost:6060/debug/pprof/profile?seconds=30
Saved profile in /Users/lanyang/pprof/pprof.samples.cpu.001.pb.gz
Type: cpu
Time: Sep 21, 2019 at 2:19pm (CST)
Duration: 30s, Total samples = 0
No samples were found with the default sample value type.
Try "sample_index" command to analyze different sample values.
Entering interactive mode (type "help" for commands, "o" for options)
(pprof)浏览器中打开http://localhost:6060/debug/pprof/
如图所示,列出了很多监控项,
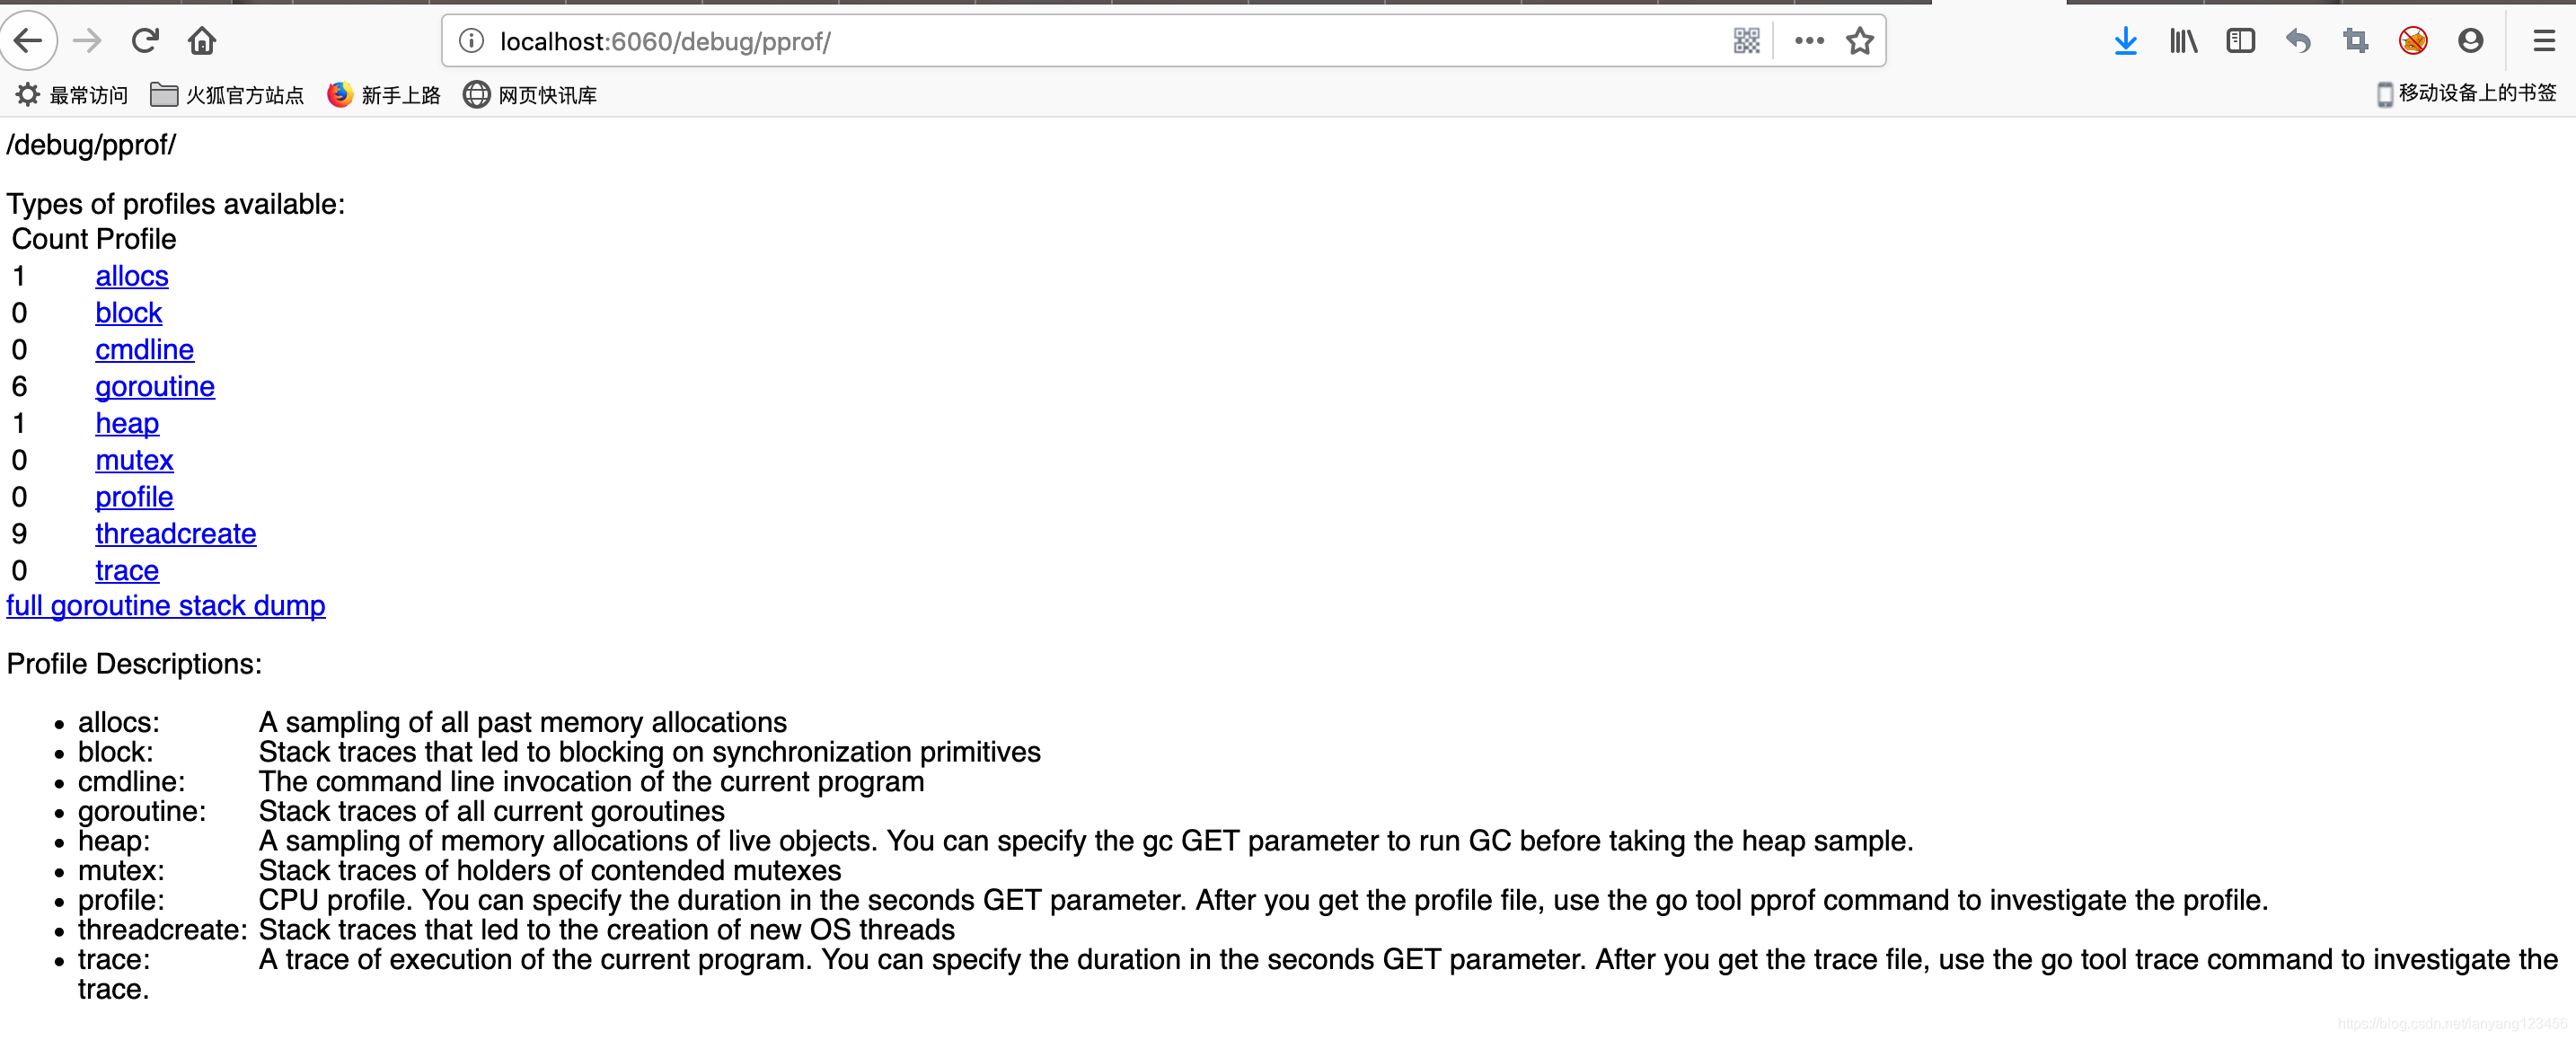
 Profile Descriptions:

allocs:
A sampling of all past memory allocations

block:
Stack traces that led to blocking on synchronization primitives

cmdline:
The command line invocation of the current program

goroutine:
Stack traces of all current goroutines

heap:
A sampling of memory allocations of live objects. You can specify the gc GET parameter to run GC before taking the heap sample.

mutex:
Stack traces of holders of contended mutexes

profile:
CPU profile. You can specify the duration in the seconds GET parameter. After you get the profile file, use the go tool pprof command to investigate the profile.

threadcreate:
Stack traces that led to the creation of new OS threads

trace:
A trace of execution of the current program. You can specify the duration in the seconds GET parameter. After you get the trace file, use the go tool trace command to investigate the trace.
可以通过链接跳转到对应界面。
从pprof使用上看,是首先保存profile文件,再进行分析的。
在一些场景,例如在线上环境,最好保存profile,拿到线下做分析。
将profile文件保存下来:
wget  http://localhost:6060/debug/pprof/heap
--2019-09-21 15:20:17--  http://localhost:6060/debug/pprof/heap
正在解析主机 localhost (localhost)... ::1, 127.0.0.1
正在连接 localhost (localhost)|::1|:6060... 失败:Connection refused。
正在连接 localhost (localhost)|127.0.0.1|:6060... 已连接。
已发出 HTTP 请求,正在等待回应... 200 OK
长度:1162 (1.1K) [application/octet-stream]
正在保存至: “heap”

heap                                         100%[============================================================================================>]   1.13K  --.-KB/s  用时 0s

2019-09-21 15:20:17 (111 MB/s) - 已保存 “heap” [1162/1162])

ll
-rw-r--r-- 1 lanyang staff 1.1K 9 21 15:20 heap然后使用pprof进行分析,其中,./simple是可执行文件,用于解析各种符号,./heap是刚才获取到的profile文件。
go tool pprof ./simple ./heap
Type: inuse_space
Time: Sep 21, 2019 at 3:20pm (CST)
No samples were found with the default sample value type.
Try "sample_index" command to analyze different sample values.
Entering interactive mode (type "help" for commands, "o" for options)
(pprof)go 1.11已经可以查看火焰图了,直接使用如下命令:
$ go tool pprof -http=":8081" [binary] [profile]会打开浏览器页面。
端口可以自己选择,这里使用了8081。
binary是应用的可执行文件,读取符号信息。
profile 是profile文件,可以是本地文件,或者http地址。
例如,使用以保存的profile文件:
$ go tool pprof -http=":8081" ./simple ./heap或者,通过http 的profile:
go tool pprof -http=":8081" ./simple  http://localhost:6060/debug/pprof/heap
Fetching profile over HTTP from http://localhost:6060/debug/pprof/heap
Saved profile in /Users/zhangyunyang/pprof/pprof.simple.alloc_objects.alloc_space.inuse_objects.inuse_space.001.pb.gz
Serving web UI on http://localhost:8081
火焰图如图所示,示例代码比较简单,所以火焰图不是很明显。

如果不能使用go1.11,则可以使用最新的pprof工具:
# Get the pprof tool directly
$ go get -u github.com/google/pprof

$ pprof -http=":8081" [binary] [profile]标签:解决 ORC 编写 问题 默认 场景 内存占用 占用 src
原文地址:https://www.cnblogs.com/lanyangsh/p/11563539.html