标签:基础 block prope row tar 中断 效率 性能监控 其他
在生产上我们经常会碰到一些不好排查的问题,例如线程安全问题,用最简单的threaddump或者heapdump不好查到问题原因。为了排查这些问题,有时我们会临时加一些日志,比如在一些关键的函数里打印出入参,然后重新打包发布,如果打了日志还是没找到问题,继续加日志,重新打包发布。对于上线流程复杂而且审核比较严的公司,从改代码到上线需要层层的流转,会大大影响问题排查的进度。
这个时候我们可以使用能够在线调试的工具帮助我们查找问题,例如btrace,可以动态的插入代码,极大提高我们查找问题的效率。本文通过生产案例介绍如何用这一类工具快速定位传统方法不好定位的问题。
服务器在高并发的情况下cpu消耗很高,响应速度变慢,打threaddump,发现创建了大量的Timer-xxx线程,状态都是runnable,但是没有函数堆栈,也就是刚创建了还没执行。打heapdump看,还是不好发现问题,也只能看到一堆没有堆栈的线程。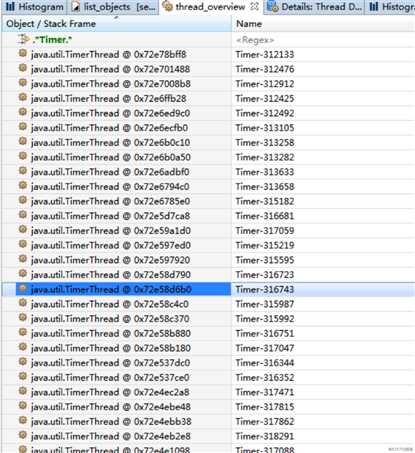
查了代码,发现近期改的地方没有主动创建Timer的地方,所以大概率是第三方jar包创建的,怎么才能找到是谁创建的线程。用这种静态的分析方法已经不太好用了,因为不管是ThreadDump还是HeapDump,抓住的都是一个快照,ThreadDump主要用来看线程的状态,HeapDump主要是看内存里的东西,还可以看线程里调用链上的栈的内容(仅限于对象,基本类型看不到)。
我们要知道谁创建的线程,只要知道谁调用了Thread类的start方法即可。假如我们在ThreadDump里看到如下的stacktrace:
java.lang.Thread.start()
com.xxx.SomeClass.startNewThread();
…
那我们就知道是谁创建了新线程,但是遗憾的是start方法太快,而ThreadDump很难抓到,start调用结束后就有一个新的stacktrace了。大部分情况下ThreadDump只会抓到比较慢的函数,最常见的是socket.read()这样的,还有一些需要多次循环的。
必须借助功能更强大的工具进行分析,比如Btrace,可以动态的插入字节码,可以使我们动态的在线查找问题。Btrace是比较基础的工具,需要自己写代码插入,原理就是字节码增强,或者叫Instrumentation,类似于AOP,通过插入一些代码进行调试分析,包括很多性能监控工具,也是通过这个原理进行无侵入的埋点。
BTrace是Java的安全可靠的动态跟踪工具。 它的工作原理是通过 instrument + asm 来对正在运行的java程序中的class类进行动态增强。使用Btrace时需要写btrace脚本,也就是Java代码,这些代码会被植入运行的JVM中,如果写的不好,可能会把JVM搞崩溃。
Arthas是阿里开源的一款工具,跟Btrace的原理一样,它用起来更简单,把最常用的功能都做了封装,不需要自己写代码了,使用起来比较简单,但是灵活性不如BTrace。
用Btrace举两个例子,没法用threaddump和heapdump快速定位问题的情况。
假如我们有以下代码,f函数会一直不停的创建Timer,而Timer会启动新线程,大量的线程导致OOM,我们需要查到是谁创建的线程。
public class Test {
       public static void main(String[] args) throws InterruptedException {
              f();
       }
       public static void f() throws InterruptedException {
              for(int i = 0; i < 10000; i++) {
                     new Timer(true);
                     Thread.sleep(1000);
              }
       }
}
打一个threaddump,没法发现f与新线程的关系。
"Timer-31" daemon prio=5 tid=0x00007fc74a894800 nid=0x6407 in Object.wait() [0x00007000017db000]
   java.lang.Thread.State: WAITING (on object monitor)
    at java.lang.Object.wait(Native Method)
    - waiting on <0x00000007d596be10> (a java.util.TaskQueue)
    at java.lang.Object.wait(Object.java:503)
    at java.util.TimerThread.mainLoop(Timer.java:526)
    - locked <0x00000007d596be10> (a java.util.TaskQueue)
    at java.util.TimerThread.run(Timer.java:505)

   Locked ownable synchronizers:
    - None
"main" prio=5 tid=0x00007fc74a80b000 nid=0x1703 waiting on condition [0x0000700000219000]
   java.lang.Thread.State: TIMED_WAITING (sleeping)
    at java.lang.Thread.sleep(Native Method)
    at test.Test.f(Test.java:13)
    at test.Test.main(Test.java:8)

   Locked ownable synchronizers:
    - None
可以用Btrace查找是谁创建的。用Btrace需要写脚本,以下脚本就是在java.lang.Thread类的start方法被调用的时候执行onnewThread方法,打印5行堆栈。
import com.sun.btrace.annotations.*;
import static com.sun.btrace.BTraceUtils.*;

@BTrace public class ThreadStart {
    @OnMethod(
        clazz="java.lang.Thread",
        method="start"
    )
    public static void onnewThread(@Self Thread t) {
        println("");
        Threads.jstack(5);
    }
}
然后在指定的进程号上执行脚本,得到下面的输出。
localhost:btrace-bin-1.3.11.3 $ ./bin/btrace 95428 ThreadStart.java
/Users/Downloads/btrace-bin-1.3.11.3

java.lang.Thread.start(Thread.java)
java.util.Timer.<init>(Timer.java:176)
java.util.Timer.<init>(Timer.java:146)
test.Test.f(Test.java:12)
test.Test.main(Test.java:8)

java.lang.Thread.start(Thread.java)
java.util.Timer.<init>(Timer.java:176)
java.util.Timer.<init>(Timer.java:146)
test.Test.f(Test.java:12)
test.Test.main(Test.java:8)

java.lang.Thread.start(Thread.java)
java.util.Timer.<init>(Timer.java:176)
java.util.Timer.<init>(Timer.java:146)
test.Test.f(Test.java:12)
test.Test.main(Test.java:8)
通过调用堆栈,就能找到是谁创建的线程了。
下面的代码,xx是一个业务逻辑函数,它的入参经过了严格的校验,如果传入参数过大,可能会处理时间特别长,我们现在怀疑参数检查出了问题,导致有些时候函数时间特别长。
public class Test {
    public static void main(String[] args) throws InterruptedException {
        ExecutorService pool = Executors.newFixedThreadPool(10);
        for(int i = 0; i < 100000; i++) {
            final int x = new Random().nextInt(5000);
            pool.execute(new Runnable() {
                @Override
                public void run() {
                    xx(x,String.valueOf(x%5));
                }
            });
        }
    }
    public static void xx(int x , String y) {
        try {
            Thread.sleep(x);
        } catch (InterruptedException e) {}
    }
}
打一个heapdump,可以看到函数堆栈以及入参,查看一下慢线程的入参:
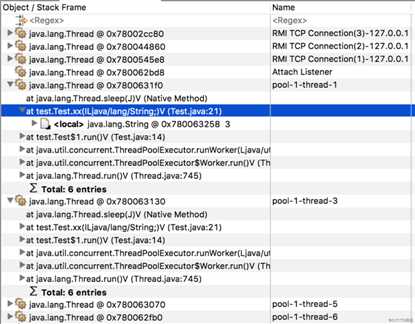
在heapdump里,我们只能看到xx的一个入参,但是代码里明明有两个。这是因为heapdump只能看到对象类型,而不能看到基本类型,因为是heapdump而不是stackdump,是从gc root对象开始把所有可达对象给抓出来了,所以int类型的参数被忽略了,如果我们传的是Integer,就能在heapdump里看到。
我们用btrace在返回的地方植入代码,如果函数时间超过3s,就打印一下参数,看看是不是参数不正常导致的。代码如下:
import com.sun.btrace.annotations.*;
import static com.sun.btrace.BTraceUtils.*;
@BTrace
public class Params {
    @OnMethod(clazz = "test.Test", method = "xx", location = @Location(Kind.RETURN))
    public static void argPrint(int param1 ,String param2, @Duration long duration) {
        if(duration > 3000000000L) { //单位是ns
                println(param1);
        }
    }
}
运行结果如下:
localhost:btrace-bin-1.3.11.3 $ ./bin/btrace 53936 Params.java
/Users/Downloads/btrace-bin-1.3.11.3
3298
4247
3527
3734
…
可以看到btrace的功能很强大,但是我们每次查找问题,都需要写一些代码,这样的方式比较灵活,但是也麻烦,而且更危险,因为插入字节码本身就有风险。我们可以提前把一些通用的脚本写好,例如查找执行时间过长的函数,或者用其他整合了多种功能的工具,例如阿里的arthas,跟btrace原理是一样的,但是功能更多,不需要再写代码,不过对于特别不常见的需求还是用btrace写代码比较好。
上述两个问题都可以用arthas解决,调用堆栈的方法在下面Timer问题分析里面会介绍。
用arthas实现上面的参数查看,连接这个进程,然后用下面标红的watch指令打印test.Test函数耗时大于3000ms时的参数。
localhost:Downloads $ java -jar arthas-boot.jar 76420
[INFO] arthas-boot version: 3.1.1
[INFO] arthas home: /Users/.arthas/lib/3.1.1/arthas
[INFO] Try to attach process 76420
[INFO] Attach process 76420 success.
[INFO] arthas-client connect 127.0.0.1 3658
  ,---.  ,------. ,--------.,--.  ,--.  ,---.   ,---.
 /  O  \ |  .--. ‘‘--.  .--‘|  ‘--‘  | /  O  \ ‘   .-‘
|  .-.  ||  ‘--‘.‘   |  |   |  .--.  ||  .-.  |`.  `-.
|  | |  ||  |\  \    |  |   |  |  |  ||  | |  |.-‘    |
`--‘ `--‘`--‘ ‘--‘   `--‘   `--‘  `--‘`--‘ `--‘`-----‘

wiki      https://alibaba.github.io/arthas
tutorials https://alibaba.github.io/arthas/arthas-tutorials
version   3.1.1
pid       76420
time      2019-08-19 17:54:14

$ watch test.Test xx params ‘#cost>3000‘
Press Q or Ctrl+C to abort.
Affect(class-cnt:1 , method-cnt:1) cost in 55 ms.
ts=2019-08-19 17:54:29; [cost=3049.163ms] result=@Object[][
    @Integer[3045],
    @String[0],
]
ts=2019-08-19 17:54:30; [cost=3287.747ms] result=@Object[][
    @Integer[3287],
    @String[2],
虽然arthas比btrace方便,但是两个都不安全,能不用尽量不用,用了的话最好重启应用。
找到jvm进程的进程号,然后使用arthas连到这个线程上,注意最好用同一个jdk版本,否则可能出问题。
weblogic@host:~/arthas> /usr/java/jdk1.7.0_80/bin/java -jar arthas-boot.jar 22316
[INFO] arthas-boot version: 3.1.1
[INFO] arthas home: /home/weblogic/arthas
[INFO] Try to attach process 22316
[INFO] Attach process 22316 success.
[INFO] arthas-client connect 127.0.0.1 3658
  ,---.  ,------. ,--------.,--.  ,--.  ,---.   ,---.
 /  O  \ |  .--. ‘‘--.  .--‘|  ‘--‘  | /  O  \ ‘   .-‘
|  .-.  ||  ‘--‘.‘   |  |   |  .--.  ||  .-.  |`.  `-.
|  | |  ||  |\  \    |  |   |  |  |  ||  | |  |.-‘    |
`--‘ `--‘`--‘ ‘--‘   `--‘   `--‘  `--‘`--‘ `--‘`-----‘

wiki      https://alibaba.github.io/arthas
tutorials https://alibaba.github.io/arthas/arthas-tutorials
version   3.1.1
pid       22316
time      2019-08-02 17:43:18

$
然后用stack命令查看Thread.start的调用堆栈。
$ stack java.lang.Thread start
No class or method is affected, try:
1. sm CLASS_NAME METHOD_NAME to make sure the method you are tracing actually exists (it might be in your parent class).
2. reset CLASS_NAME and try again, your method body might be too large.
3. check arthas log: /home/weblogic/logs/arthas/arthas.log
4. visit https://github.com/alibaba/arthas/issues/47 for more details.
提示没找到这个类或者方法,这是因为java.lang.Thread属于基础类,不建议修改它的字节码,如果确实需要,需要修改一个选项,把unsafe选项设为true。
$ options unsafe true
 NAME    BEFORE-VALUE  AFTER-VALUE
-----------------------------------
 unsafe  false         true
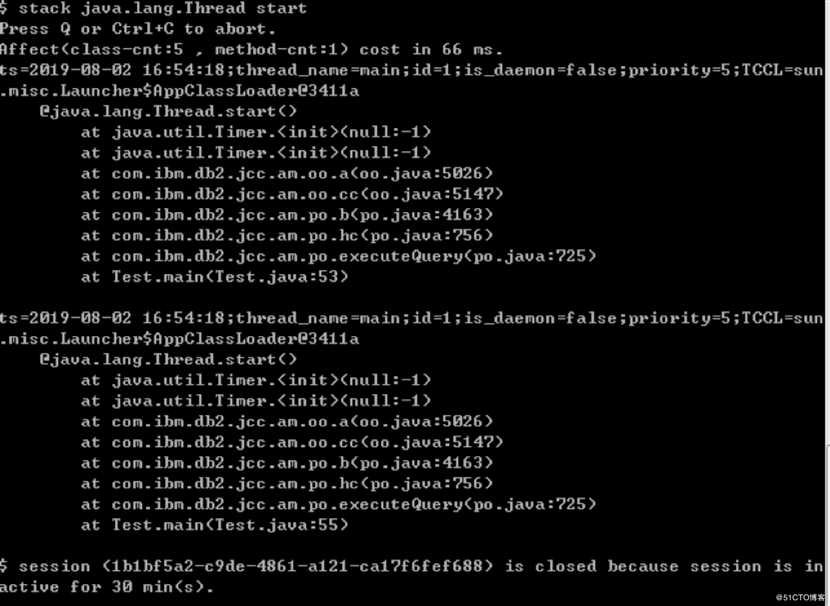
$stack java.lang.Thread start
.....
ts=2019-08-02 18:13:11;thread_name=[ACTIVE] ExecuteThread: ‘17‘ for queue: ‘weblogic.kernel.Default (self-tuning)‘;id=2e;is_daemon=true;priority=5;TCCL=weblogic.utils.classloaders.ChangeAwareClassLoader@40d0d36f
    @java.util.Timer.<init>()
        at java.util.Timer.<init>(Timer.java:146)
        at com.ibm.db2.jcc.am.io.a(io.java:4953)
        at com.ibm.db2.jcc.am.io.Zb(io.java:5019)
        at com.ibm.db2.jcc.am.jo.b(jo.java:4058)
        at com.ibm.db2.jcc.am.jo.hc(jo.java:2732)
        at com.ibm.db2.jcc.am.jo.execute(jo.java:2715)
        at weblogic.jdbc.wrapper.PreparedStatement.execute(PreparedStatement.java:105)
        at org.apache.ibatis.executor.statement.PreparedStatementHandler.query(PreparedStatementHandler.java:57)
        at org.apache.ibatis.executor.statement.RoutingStatementHandler.query(RoutingStatementHandler.java:70)
        at org.apache.ibatis.executor.SimpleExecutor.doQuery(SimpleExecutor.java:57)
        at org.apache.ibatis.executor.BaseExecutor.queryFromDatabase(BaseExecutor.java:267)
        at org.apache.ibatis.executor.BaseExecutor.query(BaseExecutor.java:141)
        at org.apache.ibatis.executor.CachingExecutor.query(CachingExecutor.java:98)
        at org.apache.ibatis.executor.CachingExecutor.query(CachingExecutor.java:73)
        at org.apache.ibatis.executor.keygen.SelectKeyGenerator.processGeneratedKeys(SelectKeyGenerator.java:65)
        at org.apache.ibatis.executor.keygen.SelectKeyGenerator.processBefore(SelectKeyGenerator.java:41)
        at org.apache.ibatis.executor.statement.PreparedStatementHandler.parameterize(PreparedStatementHandler.java:80)
        at org.apache.ibatis.executor.statement.RoutingStatementHandler.parameterize(RoutingStatementHandler.java:58)
        at org.apache.ibatis.executor.BatchExecutor.doUpdate(BatchExecutor.java:68)
        at org.apache.ibatis.executor.BaseExecutor.update(BaseExecutor.java:108)
......
看代码是db2的驱动创建的线程,反编译看一下代码。应用通过weblogic提供的jndi访问数据库,数据源是weblogic创建的,在weblogic的lib目录里,有两个驱动,db2jcc4.jar和db2jcc.jar,到网上查,这两者的区别在于:
Question
IBM Data Server driver for JDBC and SQLJ(JCC) has both db2jcc.jar and db2jcc4.jar. What is the difference between those 2 files, db2jcc.jar and db2jcc4.jar?
Answer
Both of them are DB2 JDBC driver jar files and are Type 4 drivers.
db2jcc.jar includes functions in the JDBC 3.0 and earlier specifications. If you plan to use those functions, include the db2jcc.jar in the application CLASSPATH.
db2jcc4.jar includes functions in JDBC 4.0 and later, as well as JDBC 3.0 and earlier specifications. If you plan to use those functions, include the db2jcc4.jar in the application CLASSPATH.
通过stacktrace里的代码行数,确定加载的是db2jcc.jar这个jar包。创建线程的代码如下: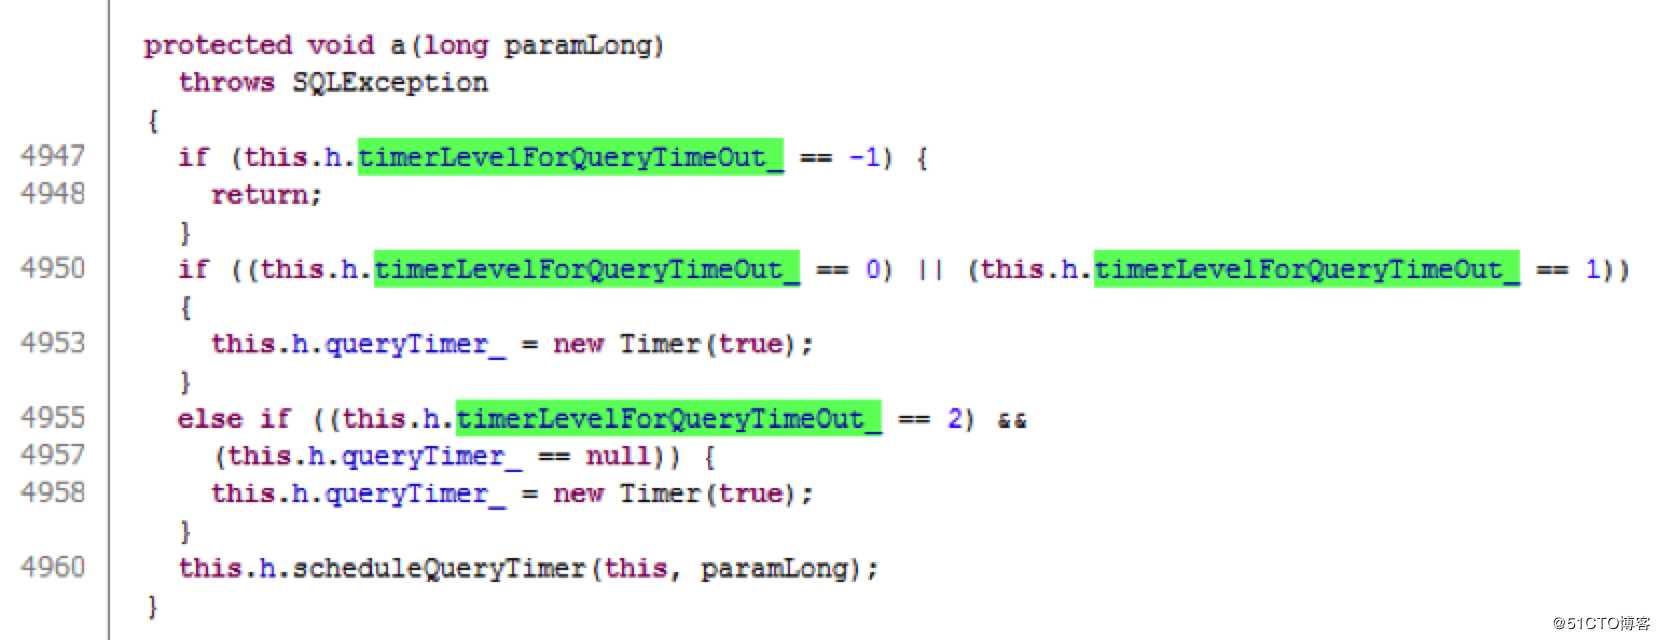
网上搜索这个参数,这个选项配成1的时候,每次查询都要启动一个探测超时的Timer,如果选项是2的话,就每个连接一个Timer。
timerLevelForQueryTimeout can be disabled by setting it to a value
of -1 (com.ibm.db2.jcc.DB2BaseDataSource.QUERYTIMEOUT_DISABLED)
The property "timerLevelForQueryTimeout" is used to indicate the
driver if it needs to create a timer object for each statement
execution or one per connection common to all statements created
under that connection. If this property is set to QUERYTIMEOUT_STATEMENT_LEVEL then the timer object is created before every execution of the statement and then destroyed after the execution.
Where the value QUERYTIMEOUT_CONNECTION_LEVEL creates one timer object per
connection and all the statement created on that connection share
that timer object for their executions. When you have lot of
statements on a connection it is better to use a common timer on a
connection otherwise it will end up creating lot of timer object and
can cause out of memory. This property can also be set like any
other property either on the datasource or in a URL.
DB2的jar包都经过了混淆,查看起来比较麻烦,最终确定了这个选项在DB2BaseDataSource类里,实际使用的是DB2SimpleDataSource 。
我们用jdbc写一段代码进行验证,使用DB2的数据源
    public static void main(String[] args) throws ClassNotFoundException, SQLException, InterruptedException {

        Connection conn = null;
        PreparedStatement ps = null;
        ResultSet rs = null;
        String name=ManagementFactory.getRuntimeMXBean().getName();
        System.out.println(name); //把线程号打出来让arthas使用

        Thread.sleep(40000);
        System.out.println(name);

        DB2SimpleDataSource ds = new DB2SimpleDataSource();
        ds.setUser("xxx");
        ds.setPassword("xxx");
        ds.setServerName("xxx");
        ds.setPortNumber(60000);
        ds.setDatabaseName("xxx");
        ds.setDriverType(4);

        //ds.setTimerLevelForQueryTimeOut(1); //改变选项
        //ds.setCommandTimeout(5000); //相当于设置了全局queryTimeOut
        ds.setConnectionTimeout(5000);
        //ds.timerLevelForQueryTimeOut = 1;
        System.out.println(ds.timerLevelForQueryTimeOut);

        conn = ds.getConnection();

        String sql = "select * from test";
        ps = conn.prepareStatement(sql);
        ps.setQueryTimeout(5000); //为单条语句设置queryTimeOut
        ps.executeQuery();
        ps.executeQuery();
        //Thread.sleep(100000);

    }
用以上代码验证,发现只有设置了setCommandTimeout或者对于statement设置了setQueryTimeout的时候才会每次都启动一个Timer。setCommandTimeout相当于设置了全局的queryTimeout。
用arthas验证结果如下:
Weblogic上部署了多个应用,但是只有一个应用有这个问题,通过分析数据源的配置,发现在mybatis的参数里有一个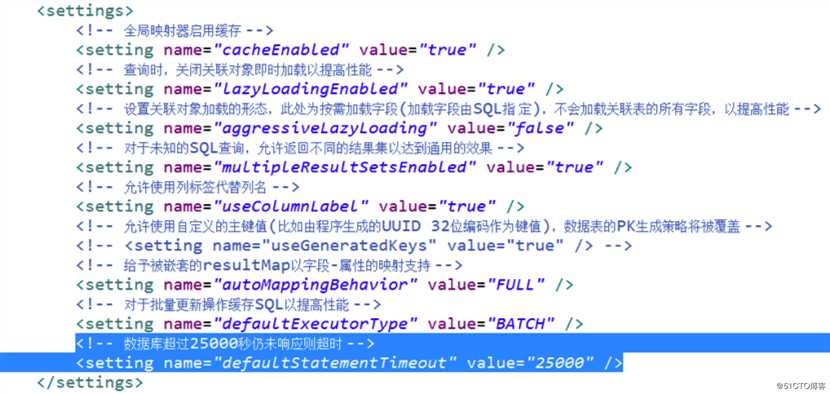
这个配置的单位是秒,也不知道开发人员怎么想的,设置了25000秒,如果sql变慢了,就会导致大量的Timer线程出现。
这个queryTimeOut到底是干啥用的呢?
一般网络连接会有两个超时时间,connectionTimeout和readTimeout,这两个超时都是由操作系统实现。connectionTimeout是在建立连接的时候的超时事件,这个比较容易理解。
而readTimeout,是指的等待对方数据到达的超时时间。
byte[] buf = new byte[128];
while(true) {
int byteRead = socket.read(buf); //socket会阻塞在这个地方,如果过了readtimeout还没有接到数据,就超时了
If(byteRead < 0) {
  Break;
}
}
假如我们的应用所有的sql都应该在1s内返回,如果超了1s可能是有问题了,这个时候超过1s有两种可能:
(1)网络问题导致读超时
(2)Sql出了问题,例如被sql注入了,where条件里出现了1=1,导致原来只用读取1k数据,现在要读取3G数据,而这3G数据不可能1s内返回,它们不停的read,也就是上述的死循环会执行很久,但是不会出现readTimeout。
第二种情况是没法通过网络层的超时来实现的,解决的方法就是单起一个线程,在一定时间后打断读取数据的线程。伪代码如下:
byte[] buf = new byte[128];
//创建一个timer,在queryTimeout到的时候执行
Timer timer = new Timer();
timer.schedule(new TimerThread(), queryTimeout); //TimerThread里面的实现就是打断主线程
while(true) {
    //超时,被计时器打断
    if(Thread.isInterrupted()) {
    break;
    System.out.println(“query Time out”);
    }
    int byteRead = socket.read(buf); //socket会阻塞在这个地方,如果过了readtimeout还没有接到数据,就超时了
    if(byteRead < 0) {
    break;
    }
}
timer.cancel(); //正常返回,中断计时器
queryTimeout是jdbc的一个参数,而各种数据库驱动可以有自己的实现,大部分都是起一个线程来控制,当然也可以选择不使用这个机制,只靠网络层的超时机制。
Db2驱动在默认情况下,如果设置了queryTimeout,会为每个statement起一个timer,这个对资源的消耗很大,可以把选项设置为2,这样就是每个connection一个timer。因为一个connection同一时间只能给一个线程用,所以这样是没有问题的。
在weblogic里加入下面的参数就可以了。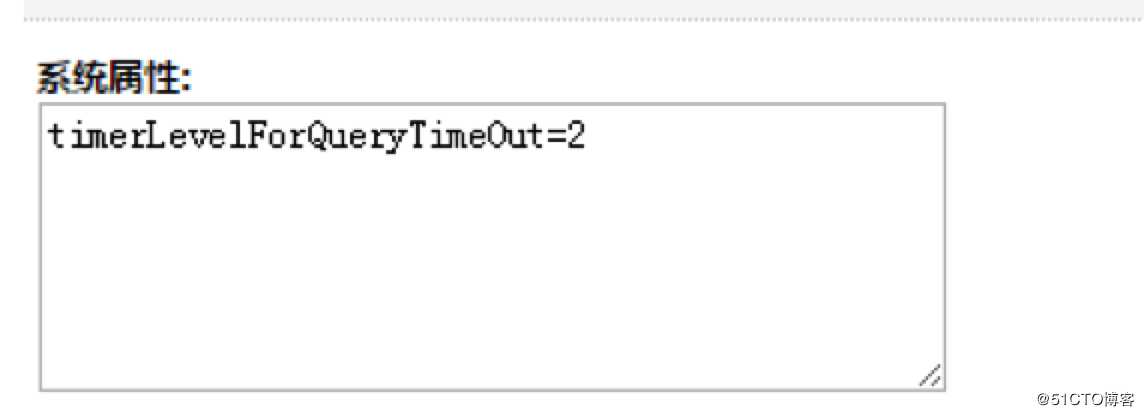
这个参数到底要不要用,怎么用,还得根据场景不同来区分,mysql也有这方面的坑,
https://blog.csdn.net/aa283818932/article/details/40379211
这一篇文章讲了jdbc的各种超时,讲的比较好。
https://www.cubrid.org/blog/understanding-jdbc-internals-and-timeout-configuration
标签:基础 block prope row tar 中断 效率 性能监控 其他
原文地址:https://www.cnblogs.com/nxlhero/p/11658796.html