标签:nohup glob contain 解压 dev 自启动 git href status
安装前提:首先要装好docker,并启动。本人是在VM里用CentOS7.5搭建的docker。安装cAdvisor, cAdisor的安装很简单,直接用docker镜像就可以安装。cAdvisor是用于分析运行中容器的资源占用和性能指标的开源工具。CAdvisor是一个运行时的守护进程,负责收集、聚合、处理和输出运行中容器的信息。
注意在查找相关资料后发现这是最新版cAdvisor的bug,换成版本为google/cadvisor:v0.24.1 就ok了,映射主机端口默认是8080,可以修改。安装方式可以去github上查看。 安装命令如下:
docker run \
--volume=/:/rootfs:ro \
--volume=/var/run:/var/run:ro \
--volume=/sys:/sys:ro \
--volume=/var/lib/docker/:/var/lib/docker:ro \
--volume=/dev/disk/:/dev/disk:ro \
--publish=8090:8080 \
--detach=true \
--name=cadvisor \
google/cadvisor:v0.24.1
执行完后用命令: docker images 可以看到google/cadvisor,用命令:docker ps -a 可以看到启动的容器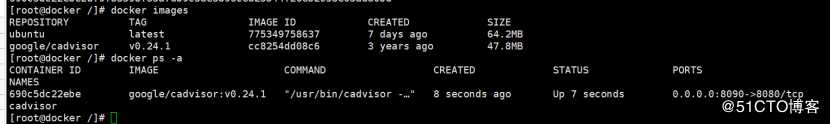
然后页面用: ip地址 + 端口号(8090,默认8080)查看图像界面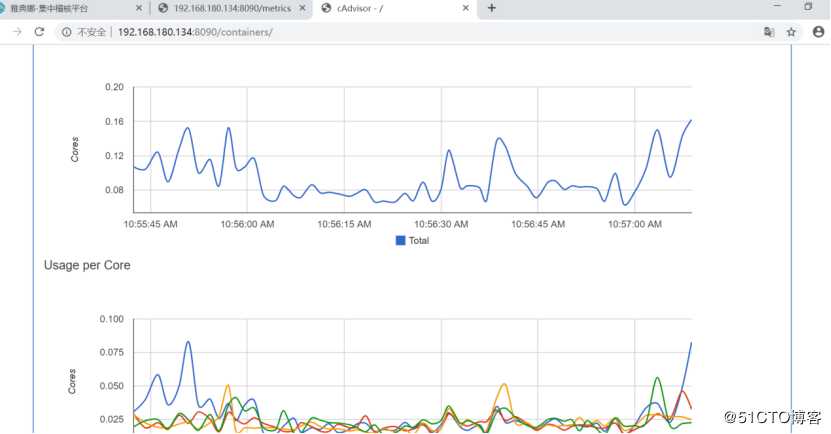
查看json方式: ip地址 + 端口号/metrics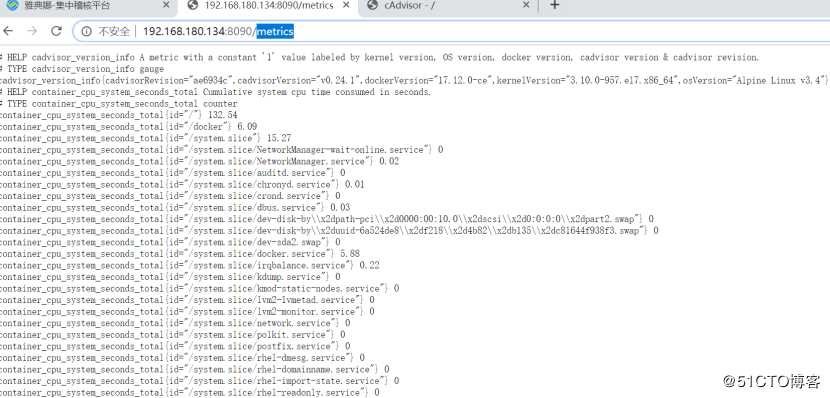
2.安装Prometheus
官方地址:https://prometheus.io/
Prometheus 是一套开源的系统监控报警框架。它启发于 Google 的 borgmon 监控系统,由工作在 SoundCloud 的 google 前员工在 2012 年创建,作为社区开源项目进行开发,并于 2015 年正式发布。2016 年,Prometheus 正式加入 Cloud Native Computing Foundation,成为受欢迎度仅次于 Kubernetes 的项目
如果没有wget命令先安装wget命令: yum -y install wget
切换到路径/usr/local路径下执行命令:
wget https://github.com/prometheus/prometheus/releases/download/v2.8.0/prometheus-2.8.0.linux-amd64.tar.gz 或者从github上(https://github.com/prometheus/prometheus/releases)下载,用迅雷或者其他方式。我本机安装的是prometheus-2.13.1.linux-amd64.tar.gz这个版本
最好要把jdk安装好,这样可以使用jps命令
在路径/usr/local 下解压缩: tar -xzvf prometheus-2.13.1.linux-amd64.tar.gz
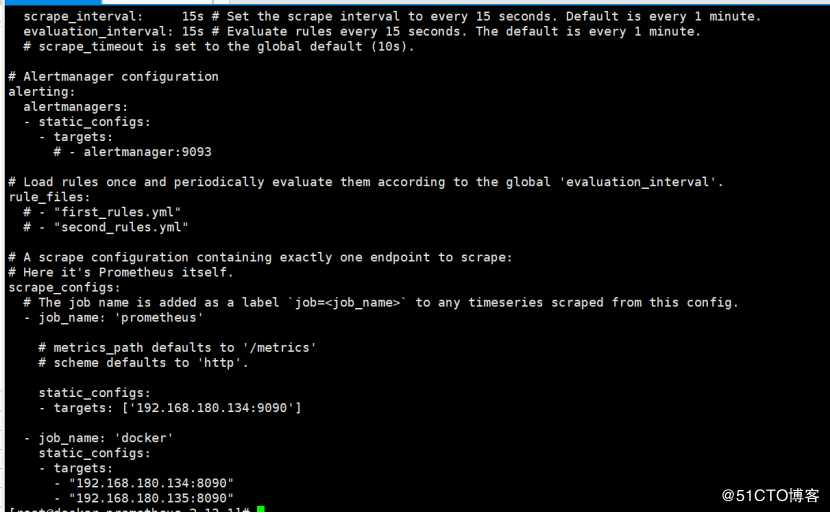
在/usr/local/prometheus-2.13.1.linux-amd64路径下,vi prometheus.yml
编辑全部内容如下,切记一定要遵守yml的格式规范.下面的格式仅参考,标识符显示有问题,具体可以看(https://blog.csdn.net/lookup123/article/details/103022563)或者看官网
# my global config
global:
scrape_interval: 15s # Set the scrape interval to every 15 seconds. Default is every 1 minute.
evaluation_interval: 15s # Evaluate rules every 15 seconds. The default is every 1 minute.
# scrape_timeout is set to the global default (10s).
*# Alertmanager configuration
alerting:
alertmanagers:
job=<job_name> to any timeseries scraped from this config.job_name: ‘prometheus‘
# metrics_path defaults to ‘/metrics‘
# scheme defaults to ‘http‘.
static_configs:
job_name: ‘docker‘
static_configs:
targets:
安装node-exporter
上传node_exporter-0.17.0.linux-amd64.tar.gz到路径/usr/local下,然后解压: tar -xzvf node_exporter-0.17.0.linux-amd64.tar.gz 或者用docker的方式安装,具体看github。下面仅给出命令模式(参考):
docker run -d \
--net="host" \
--pid="host" \
-v "/:/host:ro,rslave" \
quay.io/prometheus/node-exporter \
--path.rootfs=/host
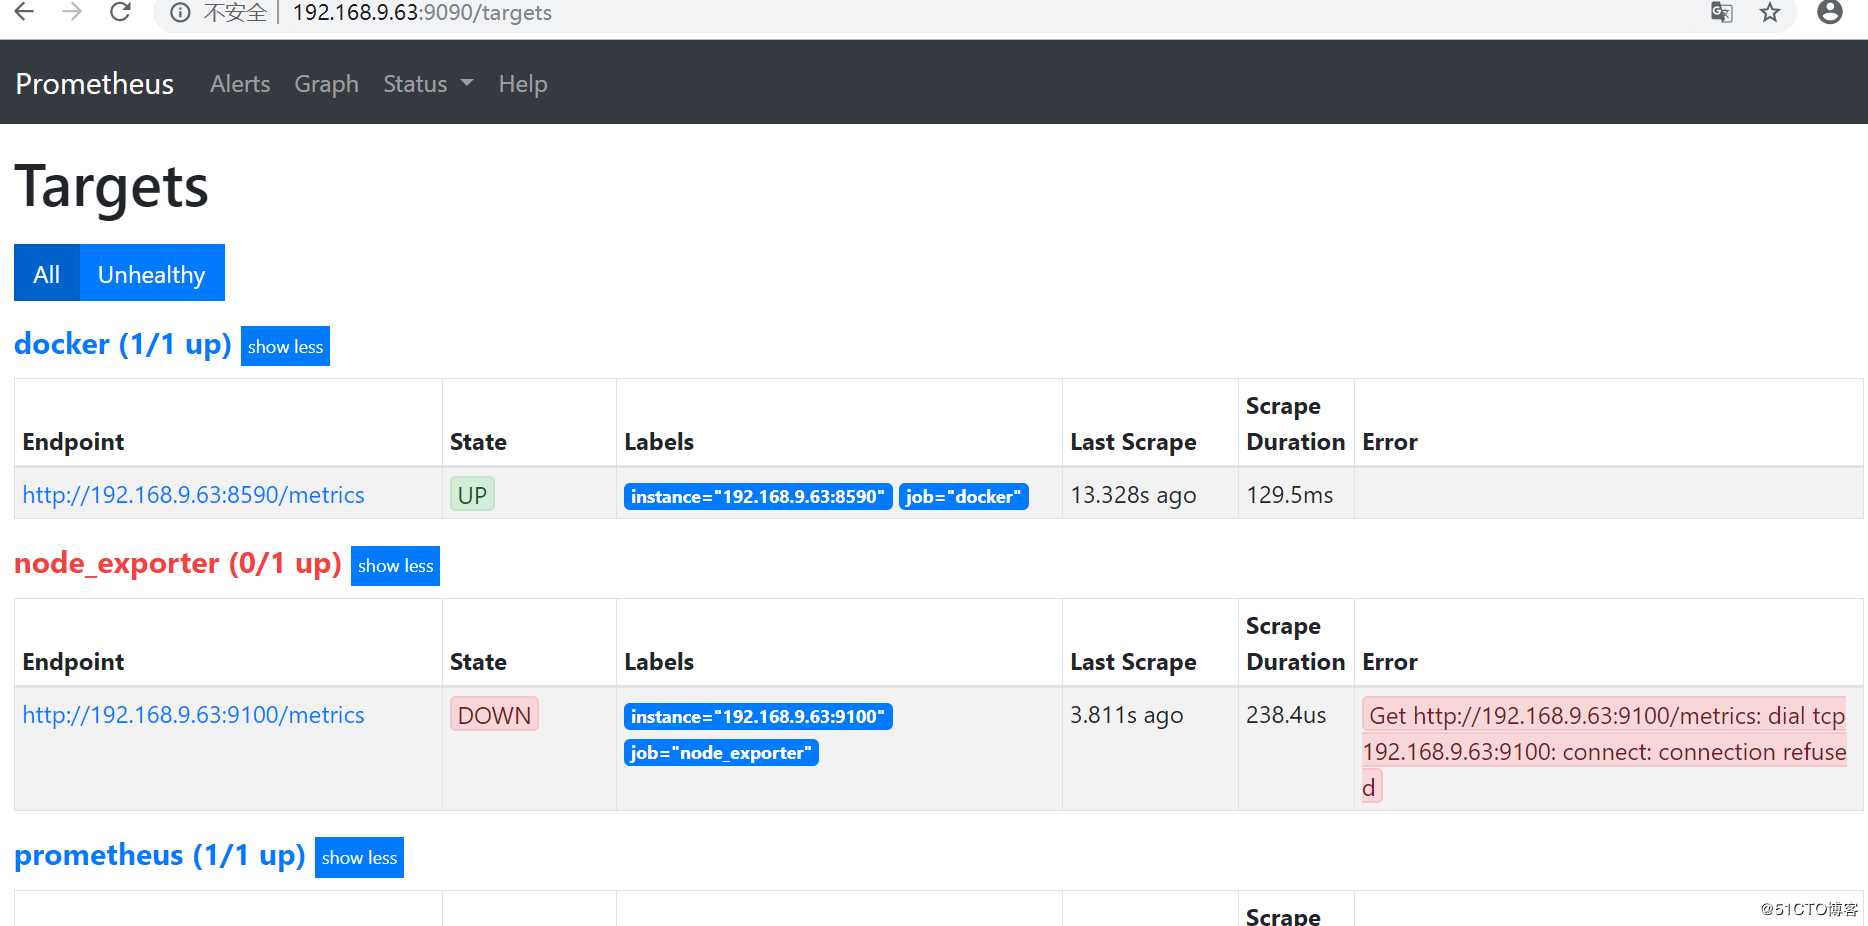
切换到路径: /usr/local/ node_exporter-0.17.0.linux-amd64下启动node-exporter.命令: 后台运行 nohup ./node_exporter &
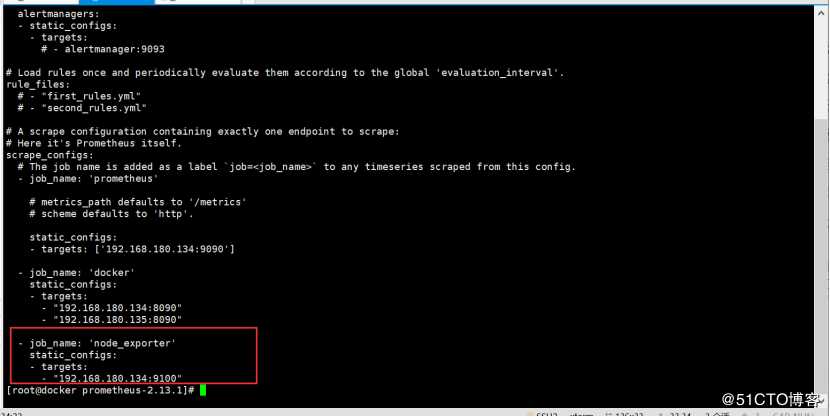
在/usr/local/ node_exporter-0.17.0.linux-amd64路径下修改prometheus.yml文件。主要就是添加如下内容:
job_name: ‘node_exporter‘
static_configs:
targets:
如果要监控mysql的话就安装mysql-exporter,去promethuse官网下载相应版本。还要监控其他比如redis的话也去官网下载相应的XXX_exporter安装
3.安装grafana
卸载方法:
Yum history list 列出最近的历史
Yum history info id 列出某次的详细信息
Yum history undo id 撤销某次更改
Yum history help 查看帮助
用yum安装软件包命令: yum install 软件包名称
用yum删除软件包命令: yum remove 软件包名称
Yum localinstall 软件包名称 ;从硬盘安装rpm包并使用yum解决依赖
1.使用镜像方法安装:
镜像官网: https://hub.docker.com/r/grafana/grafana/tags
[root@prometheus-server ~]# docker pull grafana/grafana:latest
[root@prometheus-server ~]# docker run \
-d \
-p 3000:3000 \
--name=grafana \
-v /etc/localtime:/etc/localtime:ro \
grafana/grafana
浏览器访问: http:// ip:3000 ,用户名密码:admin/admin
2.使用安装包安装
官方地址: https://grafana.com/
安装步骤:
wget https://dl.grafana.com/oss/release/grafana-6.0.1-1.x86_64.rpm
sudo yum localinstall grafana-6.0.1-1.x86_64.rpm -y
systemctl daemon-reload
systemctl start grafana-server
systemctl status grafana-server
#设置开机自启动
sudo systemctl enable grafana-server.service
参考博客:https://www.cnblogs.com/Dev0ps/p/10546276.html
下载模板模板地址:https://grafana.com/dashboards
通过ip地址+端口号的方式可以访问grafana,用户名密码默认admin/admin。登陆进去后先创建datasource,然后再import 展现模板,展现模板可以从官网下载json格式导入,在导入模板的时候要选择创建好的数据源,模板才能展现出数据
cAdvisor + Prometheus + grafana的安装
标签:nohup glob contain 解压 dev 自启动 git href status
原文地址:https://blog.51cto.com/14159501/2449604