标签:style blog http io color os ar 使用 for
1.下载echars包(这里我用的是echars-2.0.0版本的)
2.在html中添加引用标签
<script src="${basePath}/assets/plugins/echars-2.0.0/js/esl.js"></script>
<script src="${basePath}/assets/plugins/echars-2.0.0/js/echarts.js"></script>
<#macro body>
<div id="main" class="main" style="height:600px;"></div>
</#macro>
3.在js中
$(document).ready(function(){
$(‘#search_anniu‘).hide();
require.config({
paths:{
‘echarts‘:‘./js/echarts‘,
‘echarts/chart/bar‘ : ‘./js/echarts‘, // 把所需图表指向单文件
‘echarts/chart/line‘: ‘./js/echarts‘
}
});
require(
[
‘echarts‘,
‘echarts/chart/line‘, // 按需加载所需图表
‘echarts/chart/bar‘
],
function (ec) {
doselLoca();
}
);
});
function doselLoca(){
var dataLocationName=[];
var conL=[];
var counts=[];
var cha=[];
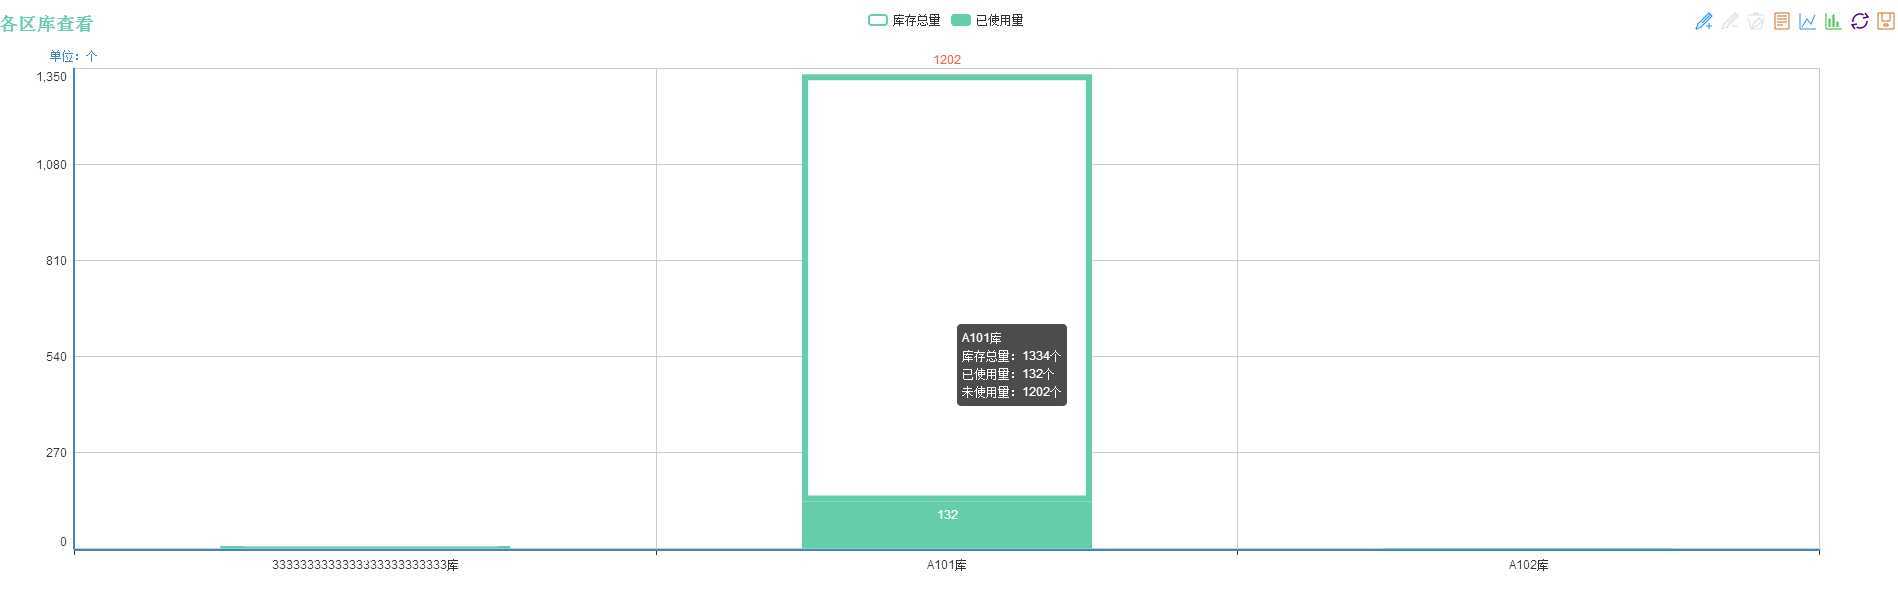
var title="各区库查看";
$.ajax({
url: fixUrl(‘/record/eRecoreLtMap/selLoca‘),
type: ‘post‘,
cache: false,
success: function(data, textStatus, jqXHR) {
for(var i=0;i<data.length;i++){
dataLocationName[i]=data[i].dic_name;
conL[i]=data[i].conL;
counts[i]=data[i].counts;
cha[i]=counts[i]-conL[i];
}
document.getElementById("godiv").style.display=‘none‘;
optiont(dataLocationName,conL,counts,title,cha);
},
error:function(msg,textStatus, errorThrown) {
alertMsg(errorThrown);
alertMsg("网络错误或者处理异常,请重试或者联系管理员处理!错误信息:" + msg.responseText);
}
});
}
function optiont(dataLocationName,conL,counts,title,cha){
var myChart = require(‘echarts‘).init(main);
var ecConfig = require(‘echarts/config‘);
var option = {
title : {
text: title,
subtext: ‘‘,
textStyle :{
color:‘#66CDAA‘
}
},
tooltip : {
trigger: ‘axis‘,
axisPointer : { // 坐标轴指示器,坐标轴触发有效
type : ‘none‘ // 默认为直线,可选为:‘line‘ | ‘shadow‘
},
formatter: function (value) {//鼠标事件
var sum="";
for (var i = 0, l = option.xAxis[0].data.length; i < l; i++) {
if (option.xAxis[0].data[i] == value[0][1]) {
sum=value[0][2]+value[1][2];
return value[0][1]+typeFlay + ‘<br/>‘
+ ‘库存总量:‘+ sum + "个"+‘<br/> ‘
+ ‘已使用量:‘+ value[0][2] + "个"+‘<br/> ‘
+ ‘未使用量:‘+ value[1][2] + "个"+‘<br/> ‘;
}
}
}
},
legend: {
selectedMode:false,
data:[‘库存总量‘,‘已使用量‘]
},
toolbox: {
show : true,
feature : {
mark : {show: true},
dataView : {show: true, readOnly: false},
magicType : {show: true, type: [‘line‘, ‘bar‘]},
restore : {show: true},
saveAsImage : {show: true}
}
},
calculable : false,
xAxis : [
{
type : ‘category‘,
data : dataLocationName,
axisLabel : {
formatter: ‘{value}‘+typeFlay
}
}
],
yAxis : [
{
type : ‘value‘,
name:‘单位:个‘
}
],
series : [
{
name:‘已使用量‘,
type:‘bar‘,
stack: ‘sum‘,
barCategoryGap: ‘50%‘,
itemStyle: {
normal: {
color: ‘#66CDAA‘,
borderColor: ‘#66CDAA‘,
borderWidth: 6,
borderRadius:0,
label : {
show: true, position: ‘insideTop‘
}
}
},
data:conL
},
{
name:‘库存总量‘,
type:‘bar‘,
data:cha,
stack: ‘sum‘,
itemStyle: {
normal: {
color: ‘#fff‘,
borderColor: ‘#66CDAA‘,
borderWidth: 6,
borderRadius:0,
label : {
show: true,
position: ‘top‘,
/*formatter: function (a, b, c) {
for (var i = 0, l = option.xAxis[0].data.length; i < l; i++) {
if (option.xAxis[0].data[i] == b) {
return option.series[1].data[i]+option.series[0].data[i];
}
}
},*/
textStyle: {
color: ‘tomato‘
}
}
}
}
}
]
};
myChart.on(ecConfig.EVENT.CLICK,eConsole);
myChart.setOption(option);
}
}
}
最终显示结果:
标签:style blog http io color os ar 使用 for
原文地址:http://www.cnblogs.com/jiaqing16/p/4063045.html