标签:modules 分析 实现 flag arp nta add car current
工具类
package test.common.utils;
import test.EventInfoCountVo;
import java.text.DateFormat;
import java.text.SimpleDateFormat;
import java.util.Date;
import java.util.HashMap;
import java.util.List;
import java.util.Map;

public class StatisticalUtil {

    /**
     * 两个时间相差距离多少天多少小时多少分多少秒
     * @param str1 时间参数 1 格式:1990-01-01 12:00:00
     * @param str2 时间参数 2 格式:2009-01-01 12:00:00
     * @return String 返回值为:xx天xx小时xx分xx秒
     */
    public static Long getDistanceTime(String str1, String str2) {
        DateFormat df = new SimpleDateFormat("yyyy-MM-dd HH:mm:ss");
        Date one;
        Date two;
        long day = 0;
        long hour = 0;
        long min = 0;
        long sec = 0;
        try {
            one = df.parse(str1);
            two = df.parse(str2);
            long time1 = one.getTime();
            long time2 = two.getTime();
            long diff ;
            if(time1<time2) {
                diff = time2 - time1;
            } else {
                diff = time1 - time2;
            }
            day = diff / (24 * 60 * 60 * 1000);
            hour = (diff / (60 * 60 * 1000) - day * 24);
            min = ((diff / (60 * 1000)) - day * 24 * 60 - hour * 60);
            sec = (diff/1000-day*24*60*60-hour*60*60-min*60);
        } catch (Exception e) {
            e.printStackTrace();
        }
        return day;
    }

    /**
     * 获取现在时间
     * @return返回字符串格式 yyyy-MM-dd HH:mm:ss
     */
    public static String getStringDate() {
        Date currentTime = new Date();
        SimpleDateFormat formatter = new SimpleDateFormat("yyyy-MM-dd HH:mm:ss");
        String dateString = formatter.format(currentTime);
        return dateString;
    }

    //构造横轴数据,按12月与天
    public static void  completion(List<EventInfoCountVo> data, int size){
        if(data.size()<size){
            int [] s = new int[size];
            for (EventInfoCountVo datum : data) {
                s[datum.getColumn()-1]=1;
            }
            for (int i =0 ;i< s.length;i++) {
                if(s[i]==0){
                    EventInfoCountVo eventInfoCountVo = new EventInfoCountVo();
                    eventInfoCountVo.setColumn(i+1);
                    eventInfoCountVo.setCount(0);
                    data.add(eventInfoCountVo);
                }
            }
        }

    }


    //按年份
    public static void  completionByYear(List<EventInfoCountVo> data, int size,Integer startTime, Integer endTime){

        endTime = endTime + 1;

        //相差的年份 2017 2019
        for(int i=startTime; i<endTime; i++){

            //2019
            int [] s = new int[endTime];

            //2018,2019
            for(int j=0; j<data.size(); j++){
                s[data.get(j).getColumn()]=1;
            }

            if(s[i]==0){
                EventInfoCountVo eventInfoCountVo = new EventInfoCountVo();
                eventInfoCountVo.setColumn(i);
                eventInfoCountVo.setCount(0);
                data.add(eventInfoCountVo);
            }

        }

    }


    public static Map<String ,String> getYearOrMonthOrDay(String startTime, String endTime){
        Integer size = 0;
        Integer startIndex = 0;
        Integer endIndex = 0;

        if(startTime != null && !startTime .equals("")  && endTime != null && !endTime .equals("")){

            Long distanceTime = getDistanceTime(startTime, endTime);
            if((!startTime.substring(0,4).equals(endTime.substring(0,4))) || distanceTime > 366L){
                //年差
                //Integer yearPoor = Integer.valueOf(endTime.substring(0,4)) - Integer.valueOf(startTime.substring(0,4));
                //System.out.println("年差是多少="+yearPoor);

                //按年
                startTime = startTime.substring(0,4)+"-01-01 00:00:00";
                endTime = endTime.substring(0,4)+"-12-31 23:59:59";
                startIndex = 1;
                endIndex = 4;
                //size = yearPoor;

            }else if((31L <= distanceTime) && (distanceTime<= 366L)){
                //当年当月 2019-11-12 59:59:59
                startTime = startTime.substring(0,7)+"-01 00:00:00";
                endTime = endTime.substring(0,7)+"-31 23:59:59";
                startIndex = 6;
                endIndex = 2;
                size = 12;

            }else if(distanceTime < 31L){
                //按天
                startTime = startTime.substring(0,7)+"-01 00:00:00";
                endTime = startTime.substring(0,7)+"-31 23:59:59";
                startIndex = 9;
                endIndex = 2;
                size = 30;

            }

        }else{
            //默认当年月份
            startTime = (Integer.valueOf(getStringDate().substring(0,4))-1)+"-01-01 00:00:00";
            endTime = getStringDate().substring(0,4)+"-12-31 23:59:59";
            //startIndex = 6;
            //endIndex = 2;
            //size = 12;
            startIndex = 1;
            endIndex = 4;
        }

        HashMap<String, String> map = new HashMap<>();
        map.put("startTime",startTime);
        map.put("endTime",endTime);
        map.put("startIndex",startIndex+"");
        map.put("endIndex",endIndex+"");
        map.put("size",size+"");

        return map;

    }
}
返回结果的集
import lombok.Data;

@Data
public class EventInfoCountVo {
    private Integer column;
    private Integer count;
}
//调用,实现类
@Override
    public List<EventInfoCountVo> statisticsByTime(Long townId, Integer flagType, Long platformTypeId,
                                                   String startTime, String endTime, List<Long> platformIds) {

     //通过工具类方法getYearOrMonthOrDay,获取到具体时间startTime、endTime与年月天标志size
     //年:2019-01-01 00:00:00 到 2020-01-01 23:59:59
     //月:2019-10-01 00:00:00 到 2019-10-31 23:59:59
     //天
        Map<String, String> yearOrMonthOrDayMap = StatisticalUtil.getYearOrMonthOrDay(startTime, endTime);
        startTime = yearOrMonthOrDayMap.get("startTime");
        endTime = yearOrMonthOrDayMap.get("endTime");
        Integer startIndex = Integer.valueOf(yearOrMonthOrDayMap.get("startIndex"));
        Integer endIndex = Integer.valueOf(yearOrMonthOrDayMap.get("endIndex"));
        Integer size = Integer.valueOf(yearOrMonthOrDayMap.get("size"));

     //返回的数据
        List<EventInfoCountVo> eventInfoCountVos = baseMapper.statisticsByTime(startTime, endTime,startIndex, endIndex);

        if(startIndex != 1){
        //构造横轴数据
            StatisticalUtil.completion(eventInfoCountVos,size);
        }else{
            Integer yearPoor = Integer.valueOf(endTime.substring(0,4)) - Integer.valueOf(startTime.substring(0,4));
            System.out.println("年差是多少="+yearPoor);
            StatisticalUtil.completionByYear(eventInfoCountVos,yearPoor,Integer.valueOf(startTime.substring(0,4)),Integer.valueOf(endTime.substring(0,4)));
        }


        return eventInfoCountVos;
    }
xml层
<!--风险管控之智能发现—学校小区统计分析—按按年、月、按天统计工单-->
    <select id="statisticsByTime" resultType="cn.sinvie.modules.event.entity.EventInfoCountVo">
        SELECT SUBSTRING(ei.gmt_create,#{startIndex},#{endIndex}) AS `column` ,COUNT(*) `count`
        FROM `event_info` as ei
        WHERE ei.is_deleted = 0
        <if test="startTime != null and startTime != ‘‘ and endTime != null and endTime != ‘‘">
            AND
            STR_TO_DATE(ei.gmt_create,‘%Y-%c-%d %H:%i:%s‘)
            BETWEEN
            #{startTime}
            AND
            #{endTime}
        </if>
        GROUP BY `column`
    </select>
//前端代码,其中200,300是用来区别年月日的,或者让后端返回
//初始化拆线图数据、按年月日统计,初始化数据
    initLineData() {
      var x = [];
      var y = [];

      this.$http({
        url: this.$http.adornUrl("/statistic/statisticsByTime"),
        method: "get",
        params: this.$http.adornParams({
          startAt: this.startTime,
          endAt: this.endTime,
        })
      }).then(res => {
        console.log("按年月日统计,初始化数据", res);

        if(res.data.data != null && res.data.data.length > 0){

          if( res.data.data[0].column <200 && res.data.data.length === 12){
            //月
            var i = 1;
            for (let j = 0; j < res.data.data.length; j++) {
              res.data.data.forEach(item => {
                if (item.column === i) {
                  x.push(item.column+"月")
                  y.push(item.count);
                  ++i;
                }
              });
            }

            this.$nextTick(() => {
              this.initLineChart(x,y);
            });

          }else if(res.data.data[0].column <200 && res.data.data.length === 30){
            //天
            var i = 1;
            for (let j = 0; j < res.data.data.length; j++) {
              res.data.data.forEach(item => {
                if (item.column === i) {
                  x.push(item.column+"号")
                  y.push(item.count);
                  ++i;
                }
              });
            }

            this.$nextTick(() => {
              this.initLineChart(x,y);
            });

          }else if(res.data.data[0].column > 300){
            //年
            for (let j = 0; j < res.data.data.length; j++) {
              x.push(res.data.data[j].column);
              y.push(res.data.data[j].count);

            }

            this.$nextTick(() => {
              this.initLineChart(x,y);
            });

          }
        }

      });
    },

    //初始化拆线图echart
    initLineChart(x,y) {
      this.chart = echarts.init(this.$refs.schoolLinePeriod, "macarons");

      this.chart.setOption({
        color: [‘#3398DB‘],

        tooltip: {
          trigger: "axis",
          axisPointer: {
            type: "cross",
            label: {
              backgroundColor: "#6a7985"
            }
          }
        },
        grid: {
          left: "1%",
          right: "5%",
          top: "25%",
          bottom: "10%",
          containLabel: true
        },
        xAxis: [
          {
            //name: "月份",
            type: "category",
            boundaryGap: false,
            data: x
          }
        ],
        yAxis: [
          {
            type: "value",
            //name: "隐患数量"
          }
        ],
        series: [
          {
            name: "隐患数量",
            type: "line",
            stack: "总量",
            label: {
              normal: {
                show: true,
                position: "top"
              }
            },
            areaStyle: { normal: {} },
            data: y
          }
        ]
      });
    },
实现效果,分别是年、月、天
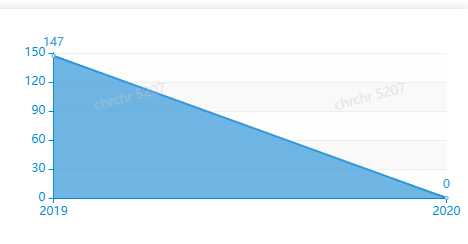
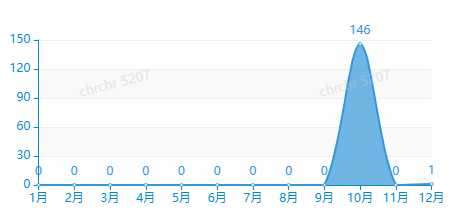
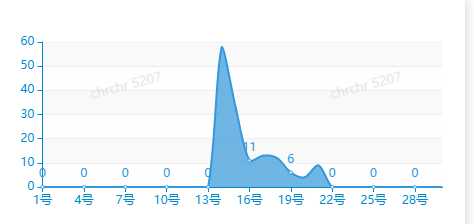
拆线图按年、按月,按天统计,前端传时间只要起始时间与结束时间
标签:modules 分析 实现 flag arp nta add car current
原文地址:https://www.cnblogs.com/caohanren/p/12213017.html