码迷,mamicode.com
首页 > 其他好文 > 详细

CentOS7 prometheus +node_exporter+Grafana 安装篇

时间:2020-01-20 16:24:08      阅读:288      评论:0      收藏:0      [点我收藏+]

标签:tool   data   web   yml   pass   访问   after   lan   config   

一、下载与安装

1、prometheus下载与安装

1)下载

https://prometheus.io/download/ 

2)安装

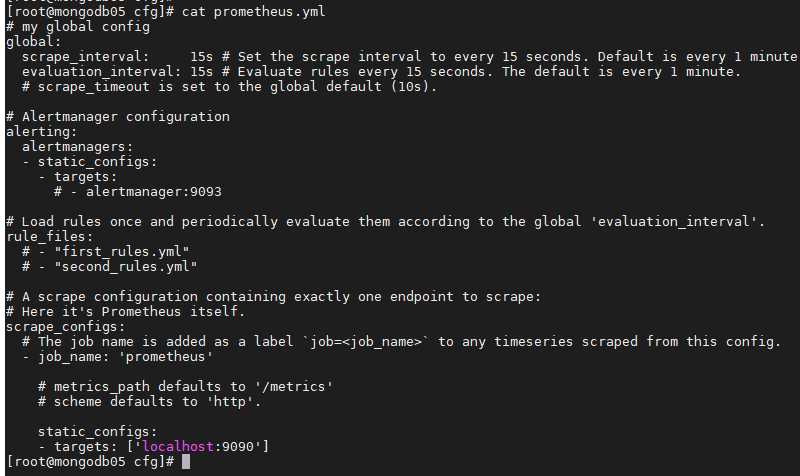
上传prometheus-2.15.2.linux-amd64.tar.gz

tar -xvf prometheus-2.15.2.linux-amd64.tar.gz

mkdir /u01/soft/prometheus/

groupadd prometheus
useradd -g prometheus prometheus -d /u01/soft/prometheus/

cd prometheus-2.5.0.linux-amd64/
mv * /u01/soft/prometheus/
cd /u01/soft/prometheus/
mkdir {data,cfg,logs,bin} -p
mv prometheus promtool bin/
mv prometheus.yml cfg/
chown -R prometheus.prometheus /u01/soft/prometheus/*
3)设置环境变量

vim /etc/profile
PATH= /u01/soft/prometheus/bin:$PATH:$HOME/bin
source /etc/profile

4)创建prometheus.service 的 systemd unit 文件
vim /etc/systemd/system/prometheus.service
[Unit]
Description=Prometheus
Documentation=https://prometheus.io/
After=network.target
[Service]
Type=simple
User=prometheus
ExecStart=/u01/soft/prometheus/bin/prometheus --config.file=/u01/soft/prometheus/cfg/prometheus.yml --storage.tsdb.path=/u01/soft/prometheus/data
Restart=on-failure
[Install]
WantedBy=multi-user.target
5)prometheus.yml配置文件
先使用默认设置
技术图片


 6)启动服务

systemctl daemon-reload

systemctl enable prometheus.service

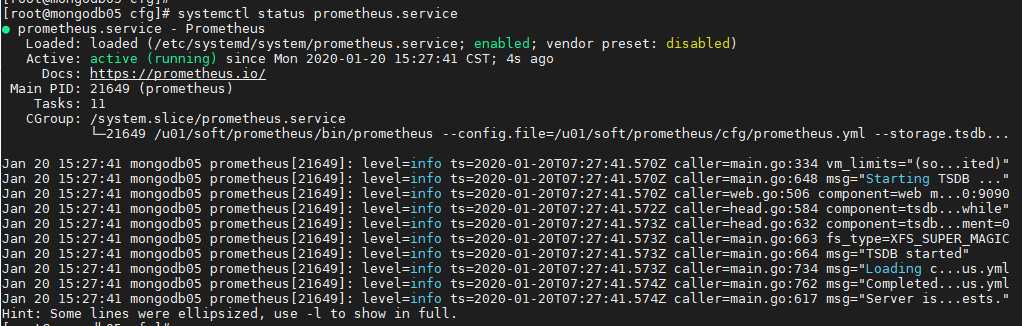
systemctl start prometheus.service

systemctl status prometheus.service

技术图片

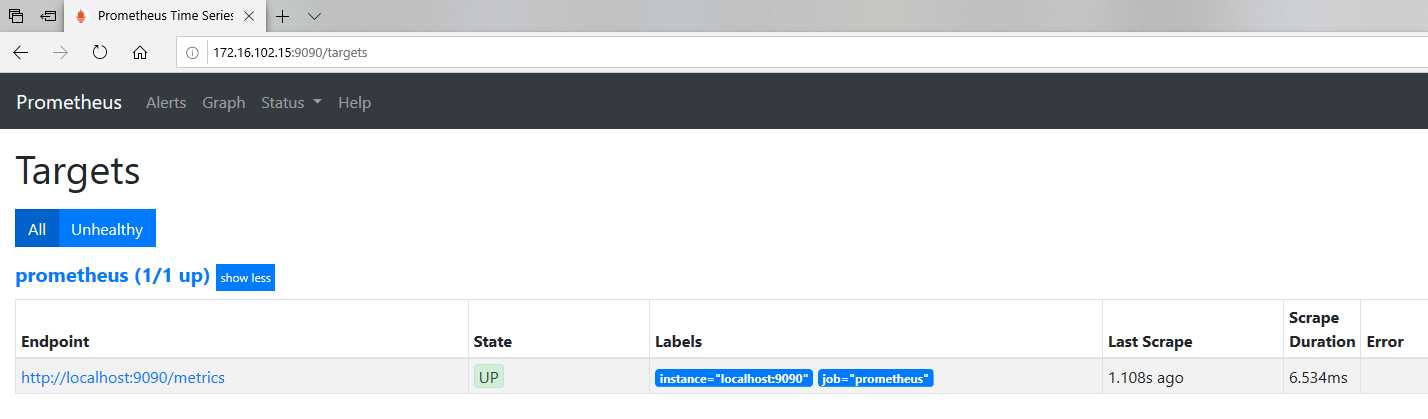
7)登录Prometheus自带有简单的UI

http://172.16.102.15:9090/targets

技术图片

 2、node_exporter下载与安装
1)下载
在prometheus官网
2)安装
tar -vzxf node_exporter-0.18.1.linux-amd64
mv node_exporter-0.18.1.linux-amd64 node_exporter
3)创建node_exporter.service的 systemd unit 文件
vim /usr/lib/systemd/system/node_exporter.service
[Unit]
Description=node_exporter
Documentation=https://prometheus.io/
After=network.target
[Service]
Type=simple
User=prometheus
ExecStart=/u01/soft/prometheus/node_exporter/node_exporter
Restart=on-failure
[Install]
WantedBy=multi-user.target
4)启动服务

systemctl daemon-reload
systemctl enable node_exporter.service
systemctl start node_exporter.service
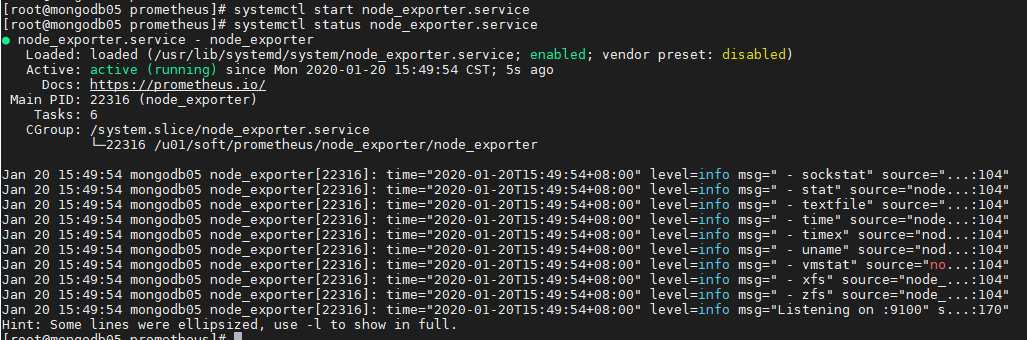
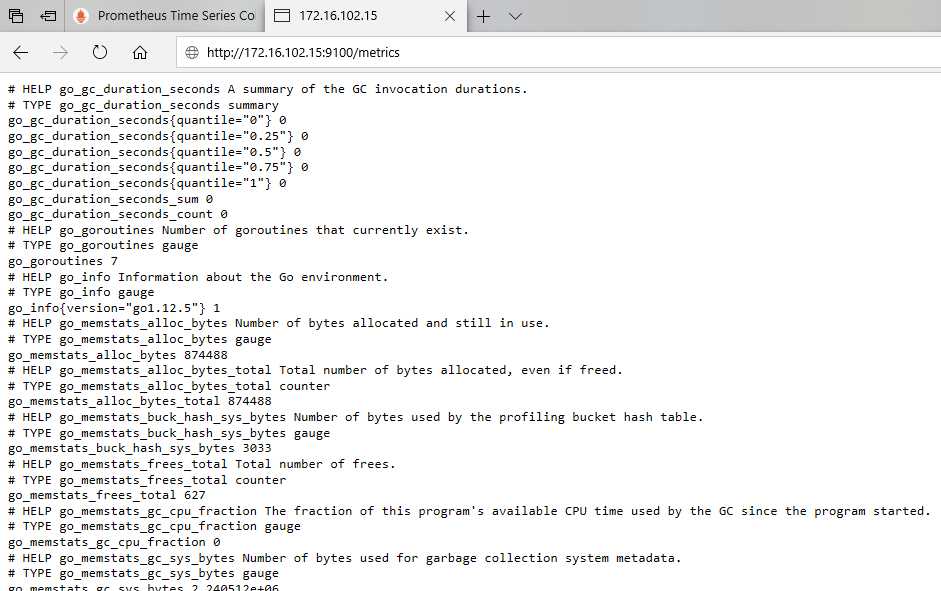
技术图片

 5)客户监控端数据汇报

http://172.16.102.15:9100/metrics

技术图片


3、grafana下载与安装

1)下载grafana

下载需要登陆

user:xibuhaohao

pass:

https://grafana.com/grafana/download
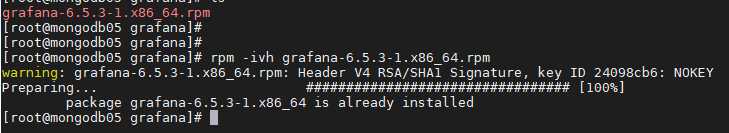
2)安装grafana

mkdir /u01/soft/grafana/

rpm -ivh grafana-6.5.3-1.x86_64.rpm
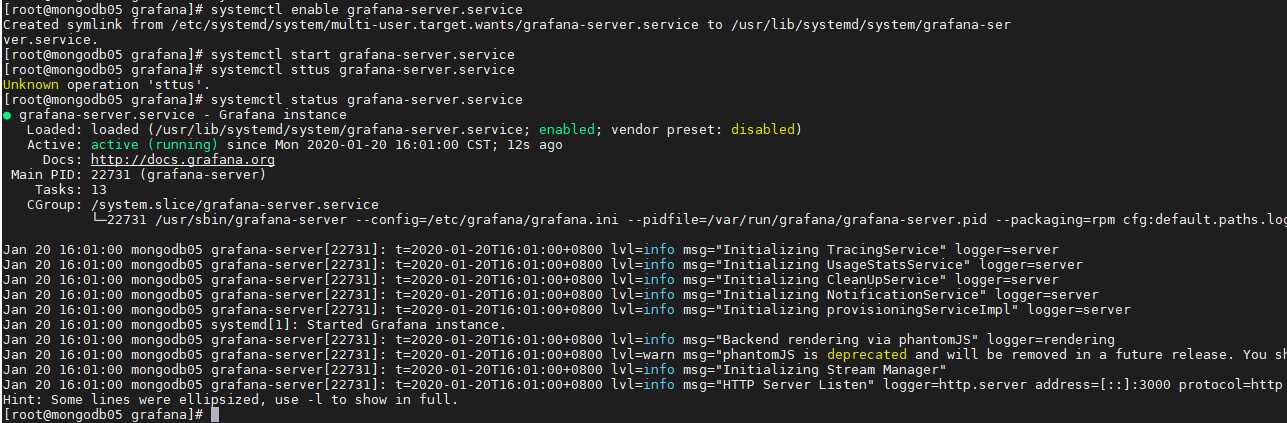
技术图片

 3)启动服务

systemctl daemon-reload
systemctl enable grafana-server.service
systemctl start grafana-server.service

systemctl status grafana-server.service
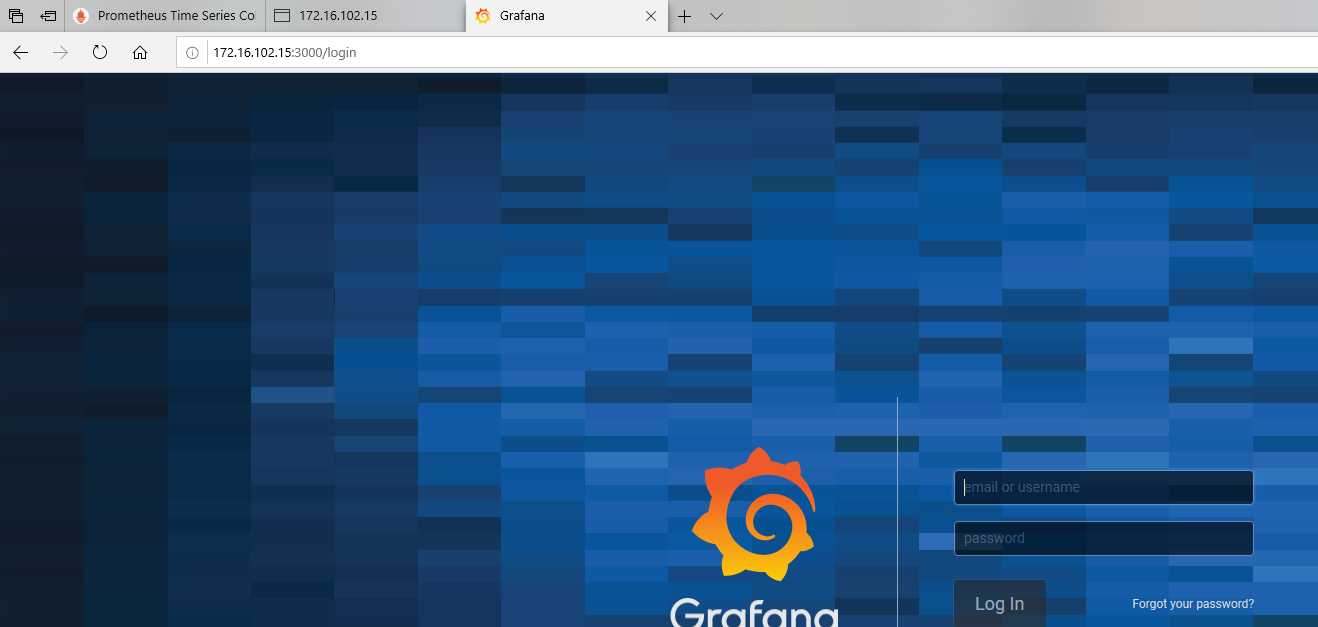
技术图片


 4)访问grafana WEB界面

默认账号/密码:admin/admin

技术图片


CentOS7 prometheus +node_exporter+Grafana 安装篇

标签:tool   data   web   yml   pass   访问   after   lan   config   

原文地址:https://www.cnblogs.com/xibuhaohao/p/12218356.html

(0)
(0)
   
举报
评论 一句话评论(0
登录后才能评论!
© 2014 mamicode.com 版权所有  联系我们:gaon5@hotmail.com
迷上了代码!