
标签:pre 重叠 情况 com poc http span ali gen
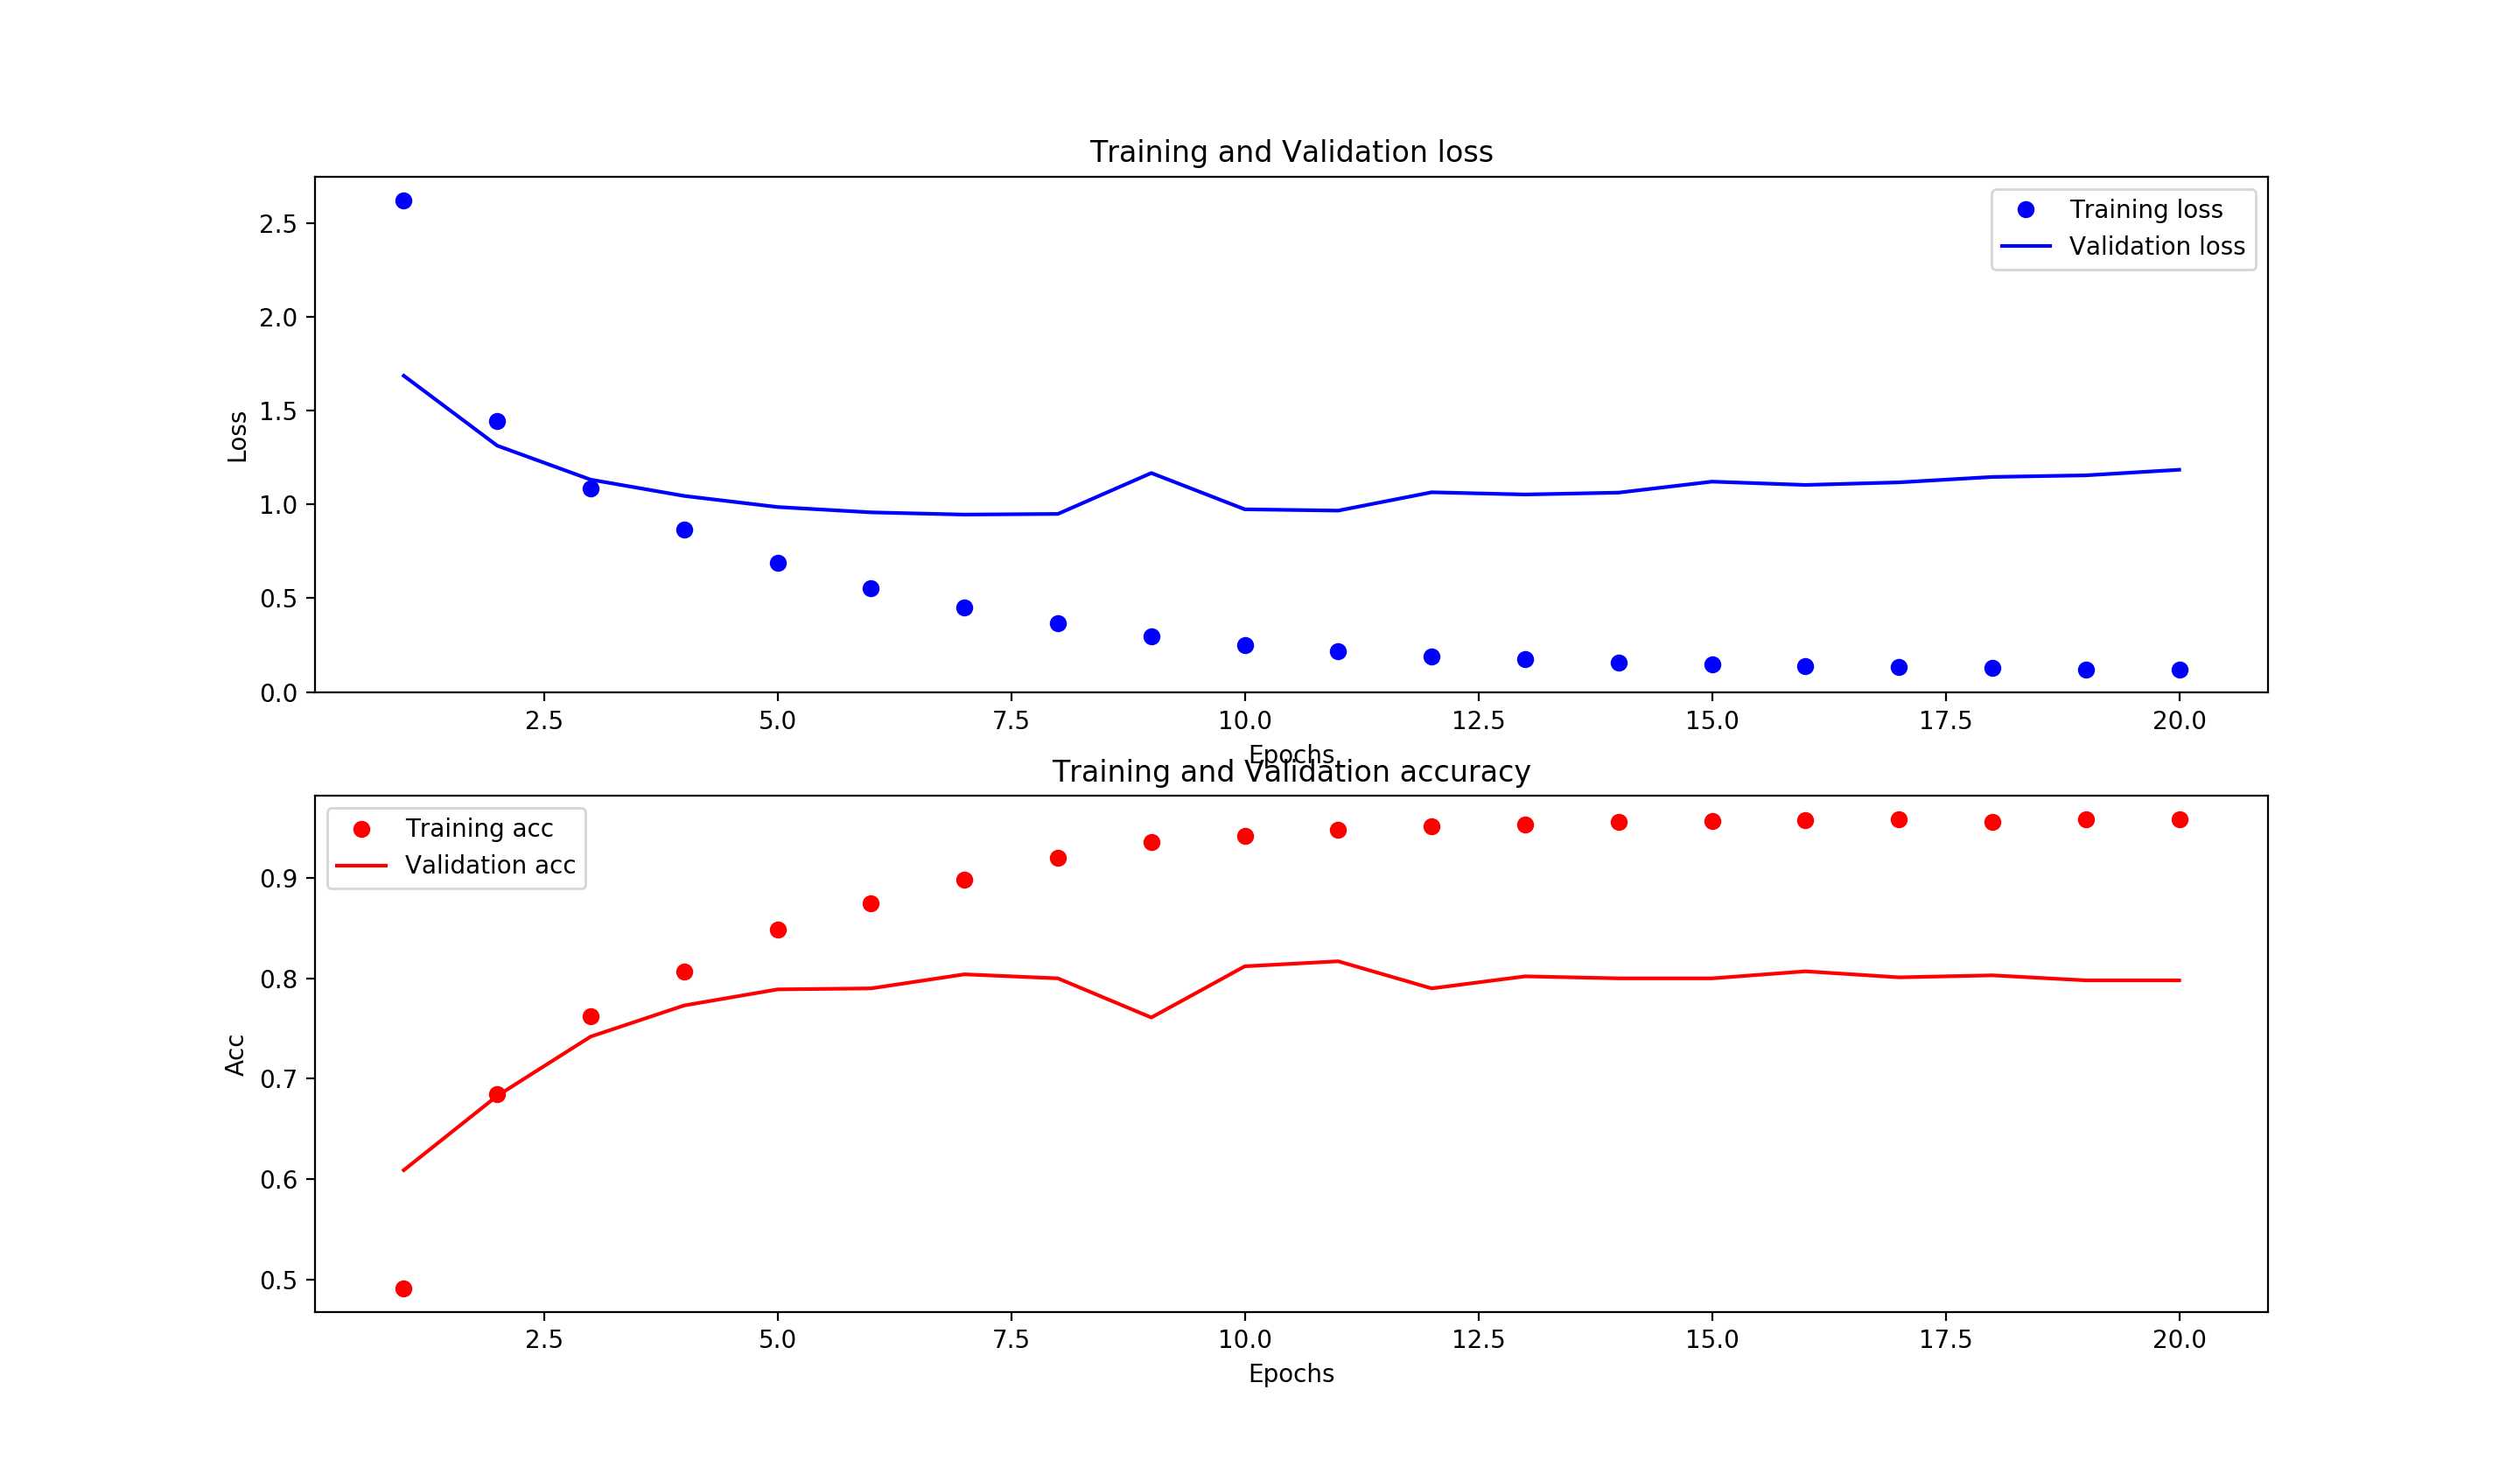
当前代码绘制的图片会出现下图中文字重叠的情况:
plt.subplot(211)
plt.plot(epochs,loss,‘bo‘,label=‘Training loss‘)
plt.plot(epochs,val_loss,‘b‘,label=‘Validation loss‘)
plt.title(‘Training and Validation loss‘)
plt.xlabel(‘Epochs‘)
plt.ylabel(‘Loss‘)
plt.legend()

plt.subplot(212)
plt.plot(epochs,acc,‘ro‘,label=‘Training acc‘)
plt.plot(epochs,val_acc,‘r‘,label=‘Validation acc‘)
plt.title(‘Training and Validation accuracy‘)
plt.xlabel(‘Epochs‘)
plt.ylabel(‘Acc‘)
plt.legend()

plt.show()
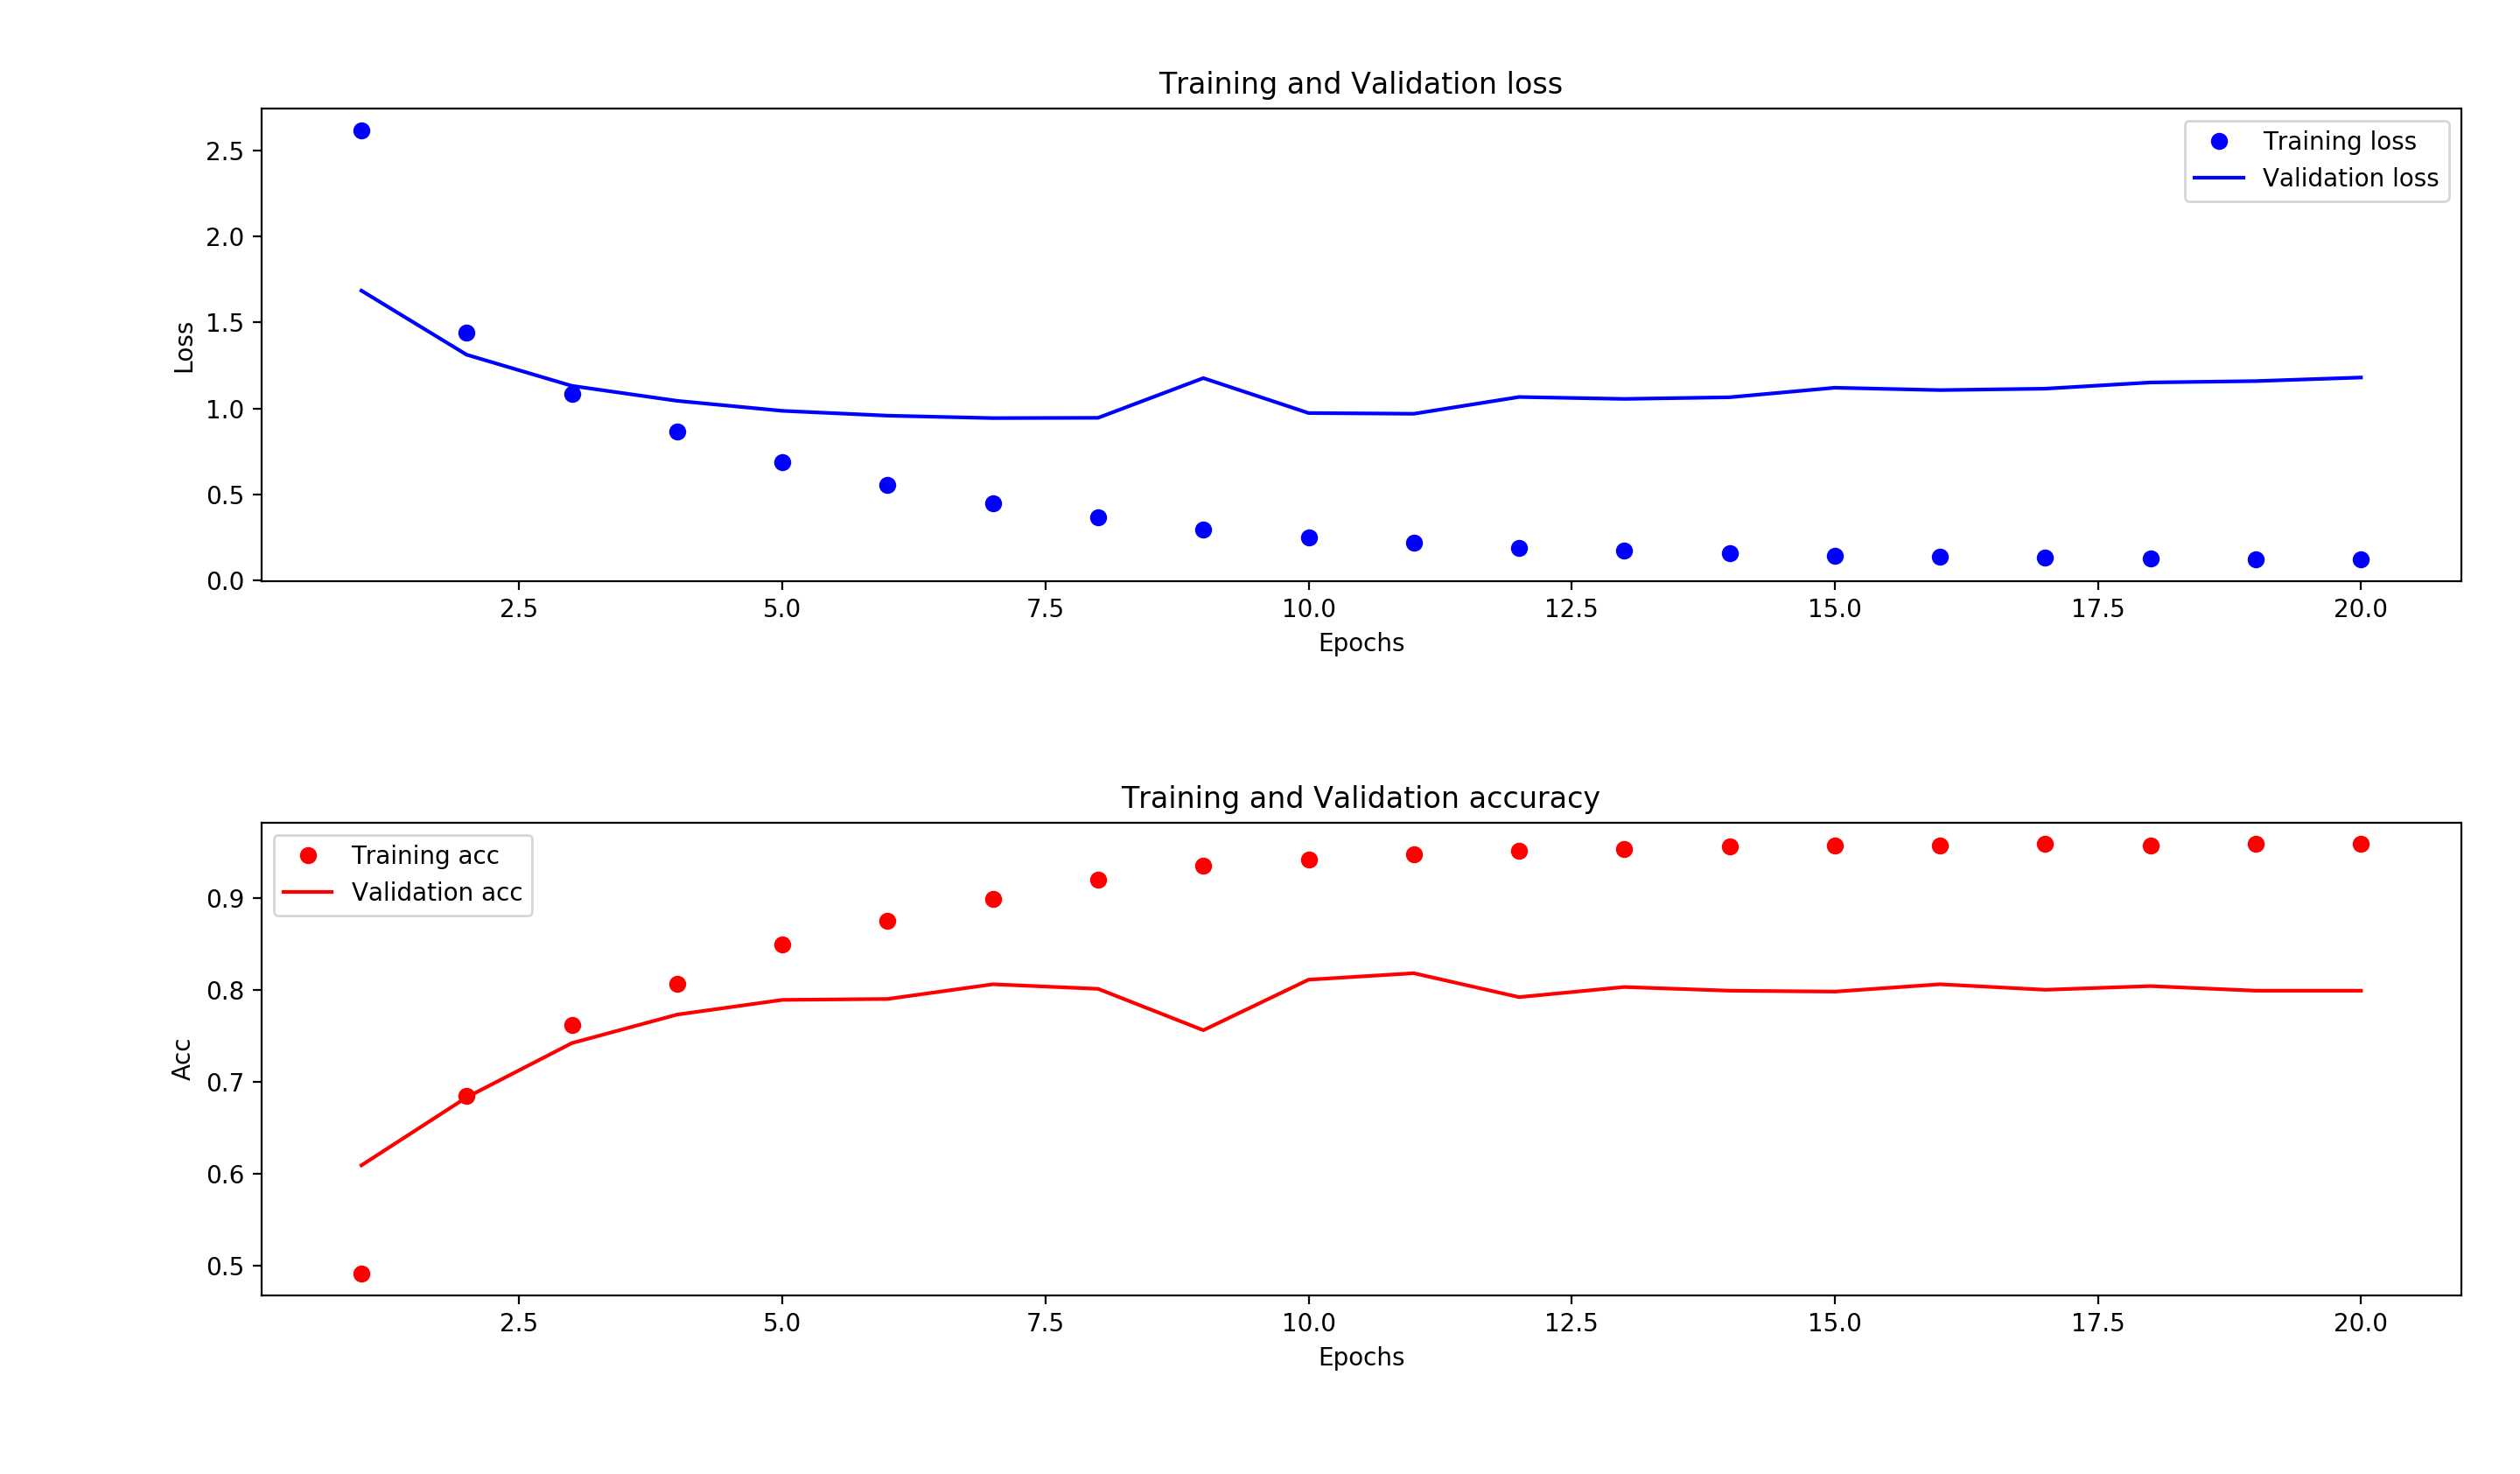
可通过tight_layout()方法解决,可根据自己喜好自动移参数:
plt.subplot(211)
plt.plot(epochs,loss,‘bo‘,label=‘Training loss‘)
plt.plot(epochs,val_loss,‘b‘,label=‘Validation loss‘)
plt.title(‘Training and Validation loss‘)
plt.xlabel(‘Epochs‘)
plt.ylabel(‘Loss‘)
plt.tight_layout()
plt.legend()

plt.subplot(212)
plt.plot(epochs,acc,‘ro‘,label=‘Training acc‘)
plt.plot(epochs,val_acc,‘r‘,label=‘Validation acc‘)
plt.title(‘Training and Validation accuracy‘)
plt.xlabel(‘Epochs‘)
plt.ylabel(‘Acc‘)
plt.tight_layout()
plt.legend()

plt.show()
【python】使用matplotlib绘制多个子图时出现标题、轴标签等文字重叠的解决
标签:pre 重叠 情况 com poc http span ali gen
原文地址:https://www.cnblogs.com/zxingwork/p/12235870.html
