标签:tps 瓶颈 seconds failed error: debug string 添加 rac
## 1. 介绍
对于生产环境中运行的进程,可以用 Go 内置的性能分析工具 pprof 窥测进程的当前状况。
Profiling Go Programs 很好地演示了用 pprof 找到性能瓶颈的过程,这里只演示简单用法。
非常简单,只需要引入 "net/http/pprof",然后启动 http server 就可以了:
import (
    "fmt"
    "log"
    "net/http"
    _ "net/http/pprof"
    "time"
)

func Write(num int, c chan int) {
    for {
        c <- num
    }
}

func main() {
    go func() {
        log.Println(http.ListenAndServe("localhost:6060", nil))
    }()

    c := make(chan int)
    go Write(10, c)
    go Write(20, c)

    for {
        select {
        case v := <-c:
            fmt.Printf("receive %d\n", v)
            time.Sleep(2 * time.Second)
        }
    }
}
直接用浏览器打开 http://127.0.0.1:6060/debug/pprof/ 查看:
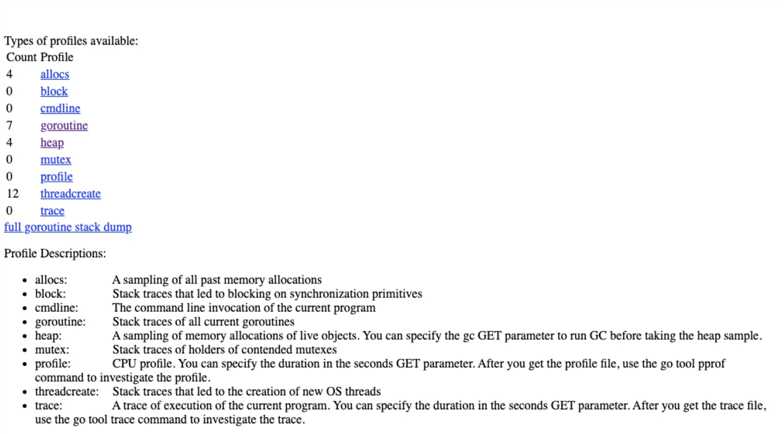
其中 debug/pprof/profile 是 cpu 采样文件,访问时触发,用 seonds 参数控制采集持续时间:
# 默认是 30 秒
http://localhost:6060/debug/pprof/profile?seconds=30对于非常驻运行的 Go 语言程序,可以在程序添加代码,经 pprof 信息写入文件中:
var cpuprofile = flag.String("cpuprofile", "", "write cpu profile to file")

func main() {
    flag.Parse()
    if *cpuprofile != "" {
        f, err := os.Create(*cpuprofile)
        if err != nil {
            log.Fatal(err)
        }
        pprof.StartCPUProfile(f)
        defer pprof.StopCPUProfile()
    }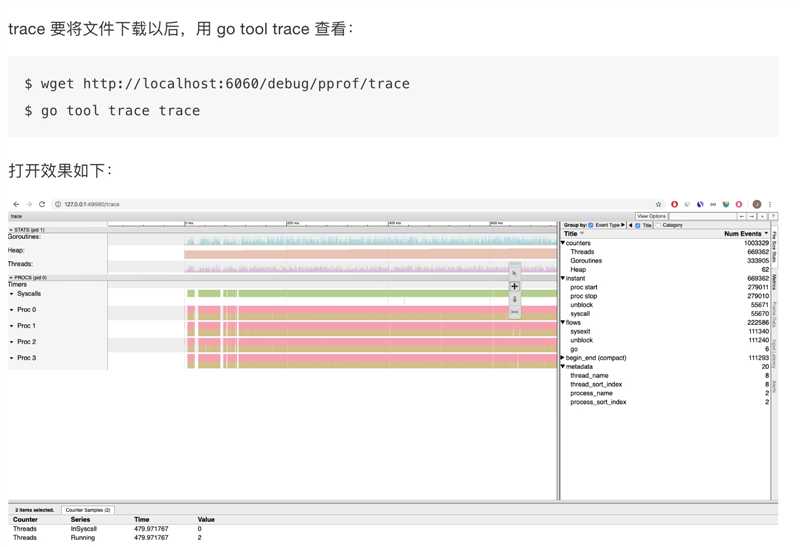
...如何使用 pprof 才是重点,除了 profile 和 trace ,其它 url 可以直接在浏览器中查看,
profile 和 trace 是两个采样文件要分别用 pprof 和 trace 工具查看。
对于离线文件:
$ go tool pprof havlak1 havlak1.prof
Welcome to pprof!  For help, type 'help'.
(pprof)
对于在线地址,以 cpu 采样为例(为了采集到数据把上面程序中的 sleep 时间调整为 0):
$ go tool pprof http://localhost:6060/debug/pprof/profile # 30-second CPU profile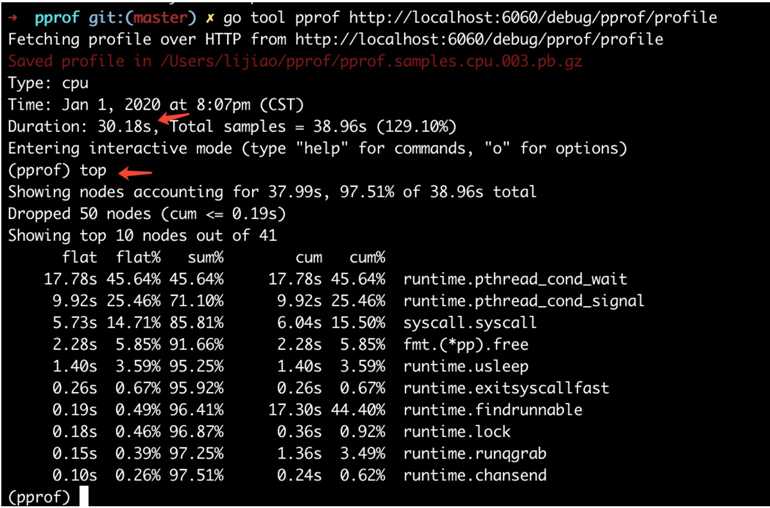
web 命令绘制采样图并用浏览器打开 ,如果遇到下面错误,安装 graphviz:
(pprof) web
failed to execute dot. Is Graphviz installed? Error: exec: "dot": executable file not found in $PATH
MACOS上:
brew install graphviz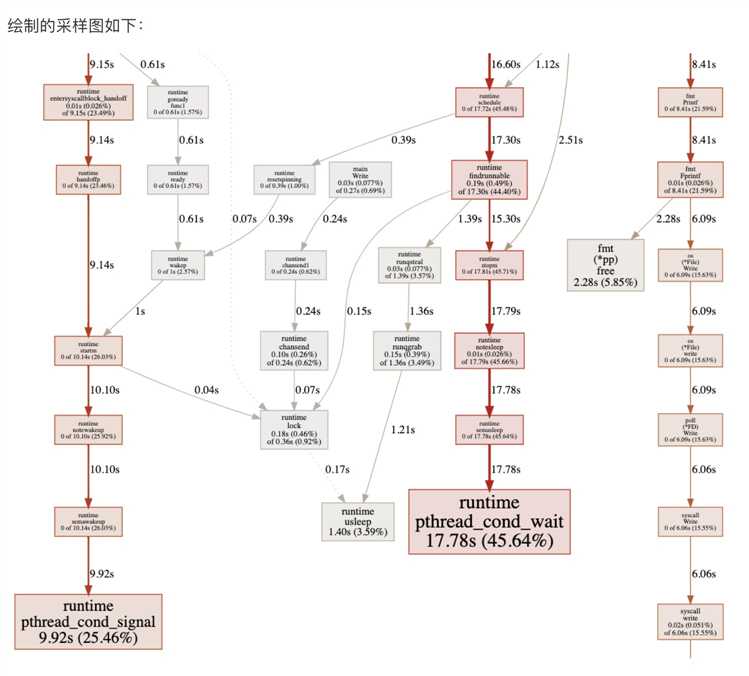
标签:tps 瓶颈 seconds failed error: debug string 添加 rac
原文地址:https://www.cnblogs.com/double12gzh/p/12272486.html