标签:list controls uibutton des 单元 学习 app 功能 spi
有了学习(一)和学习(二)的基础,我直接开门见山,分析其中的核心部分。
相比之前两个的界面,这个界面要高级很多了。首先是整个界面分为两个面板,左面板和右面板。
左面板部分从上到下依次是控件:
标签Data Selection
三个小面板,第一个面板上的title 为location,放着下拉框;
第二个面板的title是Gender,放着两个复选框Male 和 female;
第三个面板的title是smoker,放着两个复选框yes和no
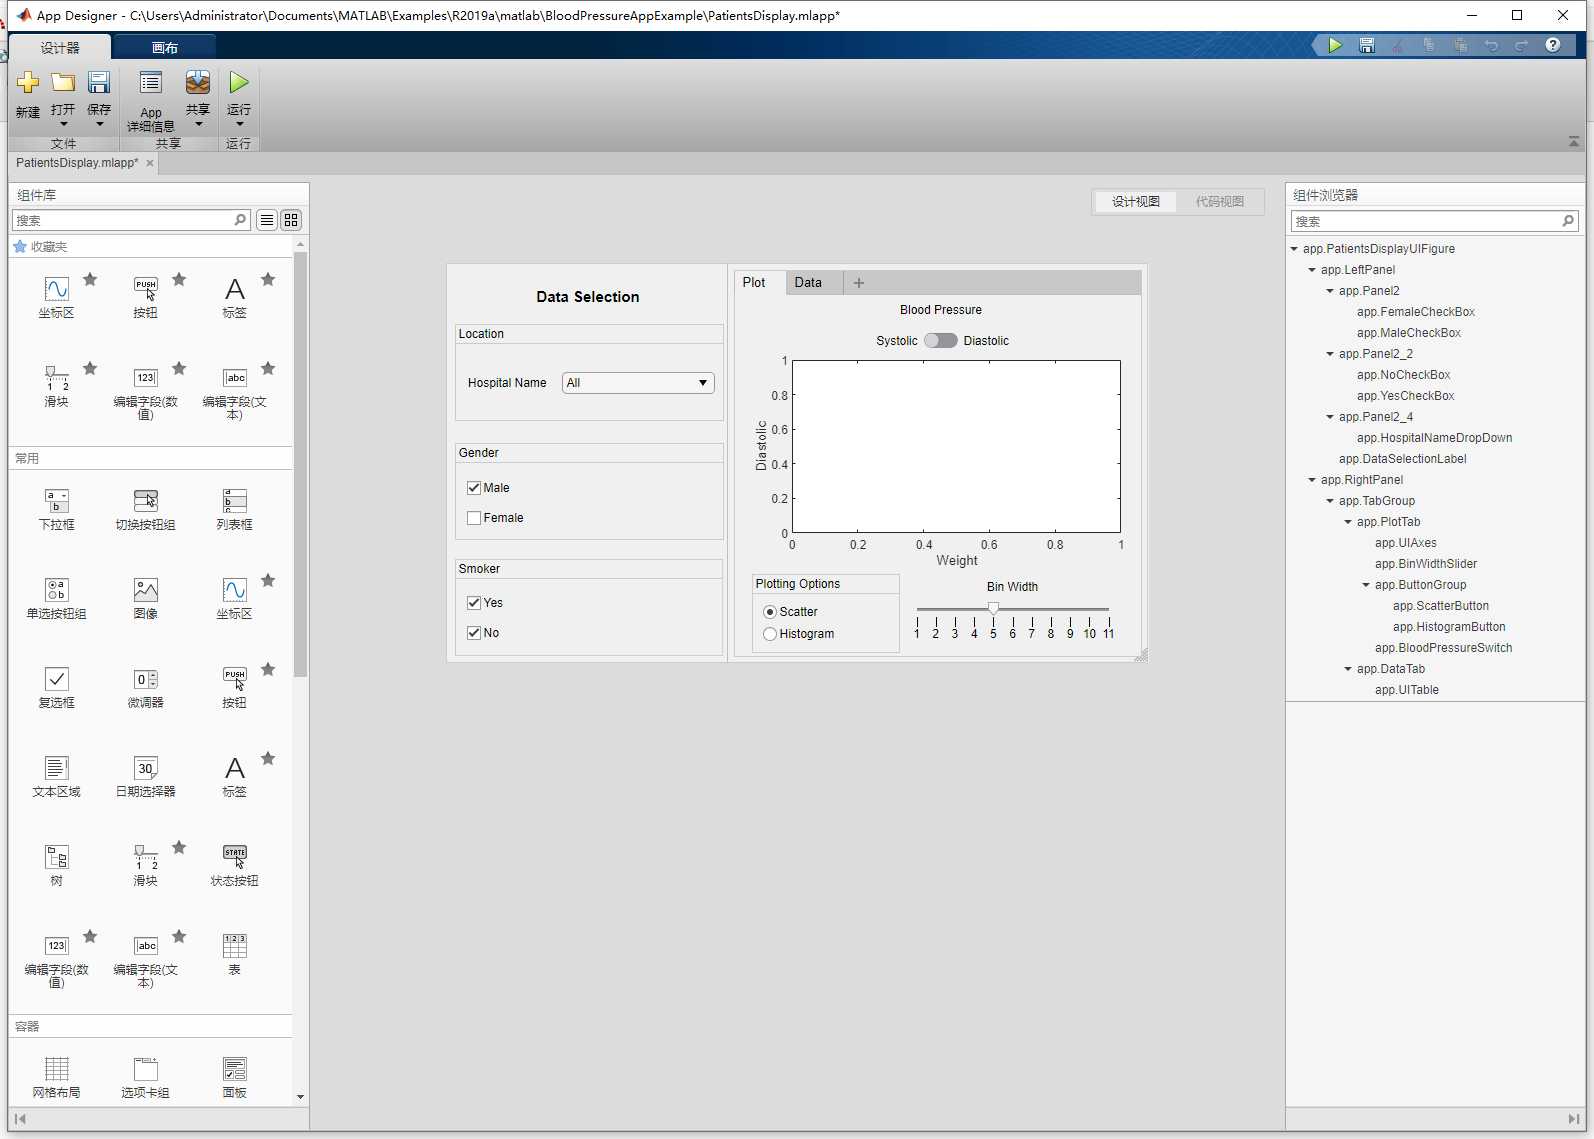
右面板部分上方有图窗工具菜单栏,在第一个子项plot中,从上到下依次是
仪器工具中的开关
绘图区
button组
滑块
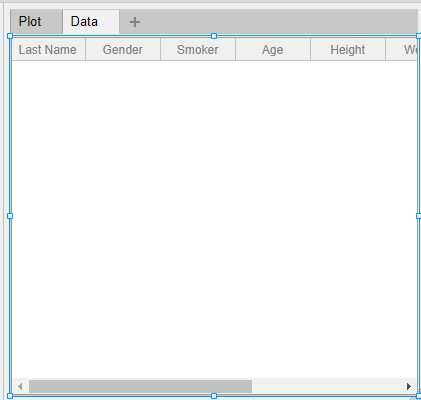
菜单第二个子项data中,放的是
表
如下图。
对控件进行相应的命名、属性的修改。
先把源代码贴过来,代码分析见后。
classdef PatientsDisplay < matlab.apps.AppBase

    % Properties that correspond to app components
    properties (Access = public)
        PatientsDisplayUIFigure    matlab.ui.Figure
        GridLayout                 matlab.ui.container.GridLayout
        LeftPanel                  matlab.ui.container.Panel
        Panel2                     matlab.ui.container.Panel
        FemaleCheckBox             matlab.ui.control.CheckBox
        MaleCheckBox               matlab.ui.control.CheckBox
        Panel2_2                   matlab.ui.container.Panel
        NoCheckBox                 matlab.ui.control.CheckBox
        YesCheckBox                matlab.ui.control.CheckBox
        Panel2_4                   matlab.ui.container.Panel
        HospitalNameDropDownLabel  matlab.ui.control.Label
        HospitalNameDropDown       matlab.ui.control.DropDown
        DataSelectionLabel         matlab.ui.control.Label
        RightPanel                 matlab.ui.container.Panel
        TabGroup                   matlab.ui.container.TabGroup
        PlotTab                    matlab.ui.container.Tab
        UIAxes                     matlab.ui.control.UIAxes
        BinWidthSliderLabel        matlab.ui.control.Label
        BinWidthSlider             matlab.ui.control.Slider
        ButtonGroup                matlab.ui.container.ButtonGroup
        ScatterButton              matlab.ui.control.RadioButton
        HistogramButton            matlab.ui.control.RadioButton
        BloodPressureSwitchLabel   matlab.ui.control.Label
        BloodPressureSwitch        matlab.ui.control.Switch
        DataTab                    matlab.ui.container.Tab
        UITable                    matlab.ui.control.Table
    end

    % Properties that correspond to apps with auto-reflow
    properties (Access = private)
        onePanelWidth = 576;
    end

    % The app displays the data by using the scatter plot, histogram, and table.
    % It makes use of tabs to separate the ploting options output from the table display of the data.
    % There are several graphical elements used such as checkboxes, slider, switch, dropdown, and radiobutton group.
    % The data used in the app is shiped with the product.

    properties (Access = private)
        % Declare properties of the PatientsDisplay class.
        Data
        SelectedGenders
        SelectedColors
        BinWidth
        Histogram = gobjects(0)
        displayedIndices
    end

    methods (Access = private)

        function NBins = numhistbins(app,data)
            % Utility function to compute the number of histogram bins
            binwidth = app.BinWidth;
            range2plot =  floor(min(data)):binwidth:ceil(max(data));
            NBins = size(range2plot,2);
        end

        function annotateScatterPlot(app)
            % Update X and Y Labels
            app.UIAxes.XLabel.String = ‘Weight‘;
            app.UIAxes.YLabel.String = app.BloodPressureSwitch.Value;
            % Dont show the histogram slider
            app.BinWidthSliderLabel.Visible = ‘off‘;
            app.BinWidthSlider.Visible = ‘off‘;
        end

        function annotateHistogram(app)

            % Update X and Y Labels
            app.UIAxes.XLabel.String = app.BloodPressureSwitch.Value;
            app.UIAxes.YLabel.String = ‘# of Patients‘;

            % Show histogram slider
            app.BinWidthSliderLabel.Visible = ‘on‘;
            app.BinWidthSlider.Visible = ‘on‘;
        end

        function filterData(app)
            % Utility function to filter the data according to the controls

            % Initially assume that all data will be displayed and then, subsequently, filter the data
            % based on the controls
            tempIndices = ones([size(app.Data,1),1]);

            % Append a column to tempIndices to indicate data that satisfies the smoker control
            if app.NoCheckBox.Value && ~app.YesCheckBox.Value
                tempIndices = [tempIndices, app.Data.Smoker == 0];
            elseif app.YesCheckBox.Value && ~app.NoCheckBox.Value
                tempIndices = [tempIndices, app.Data.Smoker == 1];
            elseif  ~app.YesCheckBox.Value && ~app.NoCheckBox.Value
                tempIndices = [tempIndices, zeros([size(app.Data,1),1])];
            end

            % Append a column to tempIndices to indicate data that satisfies the gender control
            if app.MaleCheckBox.Value && ~app.FemaleCheckBox.Value
                tempIndices = [tempIndices, app.Data.Gender == "Male"];
            elseif app.FemaleCheckBox.Value && ~app.MaleCheckBox.Value
                tempIndices = [tempIndices, app.Data.Gender == "Female"];
            elseif  ~app.FemaleCheckBox.Value && ~app.MaleCheckBox.Value
                tempIndices = [tempIndices, zeros([size(app.Data,1),1])];
            end

            % Append a column to tempIndices to indicate data that satisfies the location control
            if app.HospitalNameDropDown.Value ~= "All"
                tempIndices = [tempIndices, app.Data.Location == string(app.HospitalNameDropDown.Value)];
            end

            % Determine which data points satisfy all requirements
            app.displayedIndices = (sum(tempIndices,2)/size(tempIndices,2) == 1);
        end
    end

    % Callbacks that handle component events
    methods (Access = private)

        % Code that executes after component creation
        function startupFcn(app)
            % Load the data.
            load(‘patients.mat‘,‘LastName‘,‘Gender‘,‘Smoker‘,‘Age‘,‘Height‘,‘Weight‘,‘Diastolic‘,‘Systolic‘,‘Location‘);

            % Store the data in a table and display it in one of the App‘s tabs.
            app.Data = table(LastName,Gender,Smoker,Age,Height,Weight,Diastolic,Systolic,Location);
            app.UITable.Data = app.Data;
            app.BinWidth = app.BinWidthSlider.Value;

            % Update the axes with the corresponding data.
            updateSelectedGenders(app)
            refreshplot(app)
        end

        % Changes arrangement of the app based on UIFigure width
        function updateAppLayout(app, event)
            currentFigureWidth = app.PatientsDisplayUIFigure.Position(3);
            if(currentFigureWidth <= app.onePanelWidth)
                % Change to a 2x1 grid
                app.GridLayout.RowHeight = {400, 400};
                app.GridLayout.ColumnWidth = {‘1x‘};
                app.RightPanel.Layout.Row = 2;
                app.RightPanel.Layout.Column = 1;
            else
                % Change to a 1x2 grid
                app.GridLayout.RowHeight = {‘1x‘};
                app.GridLayout.ColumnWidth = {282, ‘1x‘};
                app.RightPanel.Layout.Row = 1;
                app.RightPanel.Layout.Column = 2;
            end
        end

        % Value changing function: BinWidthSlider
        function SliderValueChanging(app, event)
            % Update the histogram as the slider value for bindwidth changes.
            app.BinWidth = event.Value;
            for ii=1:length(app.Histogram)
                app.Histogram(ii).NumBins = numhistbins(app,app.Histogram(ii).Data);
            end
        end

        % Callback function: BinWidthSlider, BloodPressureSwitch,
        % ButtonGroup, UITable
        function refreshplot(app, event)
            Genders = app.SelectedGenders;
            Colors = app.SelectedColors;

            % Start with a fresh plot
            cla(app.UIAxes)
            hold(app.UIAxes,‘on‘)
            app.Histogram = gobjects(0);

            % Select relevant segment of data
            xdata = app.Data.Weight;
            ydata = app.Data.(app.BloodPressureSwitch.Value);

            % Filter the data according to the controls
            filterData(app);

            % Create either a scatter plot or histogram, based on selection
            switch app.ButtonGroup.SelectedObject.Text

                case ‘Scatter‘
                    % Build a scatter plot for each selected gender
                    for ii = 1:length(Genders)
                        selectedpatients = ((app.Data.Gender == Genders(ii)) & (app.displayedIndices));
                        scatter(app.UIAxes,xdata((selectedpatients)),ydata(selectedpatients),Colors{ii});
                    end
                    annotateScatterPlot(app)

                case ‘Histogram‘
                    % Build a histogram for each selected gender
                    for ii = 1:length(Genders)
                        selectedpatients = ((app.Data.Gender == Genders(ii)) & (app.displayedIndices));
                        NBins = numhistbins(app,ydata(selectedpatients));
                        h = histogram(app.UIAxes,ydata(selectedpatients),NBins,‘BinLimits‘,[floor(min(ydata)) ceil(max(ydata))]);
                        h.EdgeColor = Colors{ii};
                        h.FaceColor = Colors{ii};
                        app.Histogram = [app.Histogram h];
                    end
                    annotateHistogram(app)

            end

            % Update the table to show only the data that satisfies the controls
            app.UITable.Data = app.Data(app.displayedIndices,:);
            drawnow;
        end

        % Value changed function: FemaleCheckBox,
        % HospitalNameDropDown, MaleCheckBox, NoCheckBox,
        % YesCheckBox
        function updateSelectedGenders(app, event)
            % List which genders and colors to use
            Genders = [];
            Colors = [];
            Smoker = [];

            if app.MaleCheckBox.Value
                Genders = "Male";
                Colors = "blue";
            end
            if app.FemaleCheckBox.Value
                Genders = [Genders "Female"];
                Colors = [Colors "red"];
            end
            if app.YesCheckBox.Value
                Smoker = "Yes";
            end
            if app.NoCheckBox.Value
                Smoker = [Smoker "No"];
            end

            if isempty(Genders) || isempty(Smoker)
                % Disable the switches and buttons if they were on
                app.BloodPressureSwitch.Enable = ‘off‘;
                app.ScatterButton.Enable = ‘off‘;
                app.HistogramButton.Enable = ‘off‘;
                app.BinWidthSliderLabel.Enable = ‘off‘;
                app.BinWidthSlider.Enable = ‘off‘;
            else
                % Enable the switches and buttons if they were off
                app.BloodPressureSwitch.Enable = ‘on‘;
                app.ScatterButton.Enable = ‘on‘;
                app.HistogramButton.Enable = ‘on‘;
                app.BinWidthSliderLabel.Enable = ‘on‘;
                app.BinWidthSlider.Enable = ‘on‘;
            end
            app.SelectedGenders = Genders;
            app.SelectedColors = Colors;

            refreshplot(app)
        end
    end

    % Component initialization
    methods (Access = private)

        % Create UIFigure and components
        function createComponents(app)

            % Create PatientsDisplayUIFigure and hide until all components are created
            app.PatientsDisplayUIFigure = uifigure(‘Visible‘, ‘off‘);
            app.PatientsDisplayUIFigure.AutoResizeChildren = ‘off‘;
            app.PatientsDisplayUIFigure.Position = [100 100 703 400];
            app.PatientsDisplayUIFigure.Name = ‘Patients Display‘;
            app.PatientsDisplayUIFigure.SizeChangedFcn = createCallbackFcn(app, @updateAppLayout, true);

            % Create GridLayout
            app.GridLayout = uigridlayout(app.PatientsDisplayUIFigure);
            app.GridLayout.ColumnWidth = {282, ‘1x‘};
            app.GridLayout.RowHeight = {‘1x‘};
            app.GridLayout.ColumnSpacing = 0;
            app.GridLayout.RowSpacing = 0;
            app.GridLayout.Padding = [0 0 0 0];
            app.GridLayout.Scrollable = ‘on‘;

            % Create LeftPanel
            app.LeftPanel = uipanel(app.GridLayout);
            app.LeftPanel.Layout.Row = 1;
            app.LeftPanel.Layout.Column = 1;
            app.LeftPanel.Scrollable = ‘on‘;

            % Create Panel2
            app.Panel2 = uipanel(app.LeftPanel);
            app.Panel2.AutoResizeChildren = ‘off‘;
            app.Panel2.Title = ‘Gender‘;
            app.Panel2.Position = [9 123 269 97];

            % Create FemaleCheckBox
            app.FemaleCheckBox = uicheckbox(app.Panel2);
            app.FemaleCheckBox.ValueChangedFcn = createCallbackFcn(app, @updateSelectedGenders, true);
            app.FemaleCheckBox.Text = ‘Female‘;
            app.FemaleCheckBox.Position = [12 14 60 16];

            % Create MaleCheckBox
            app.MaleCheckBox = uicheckbox(app.Panel2);
            app.MaleCheckBox.ValueChangedFcn = createCallbackFcn(app, @updateSelectedGenders, true);
            app.MaleCheckBox.Text = ‘Male‘;
            app.MaleCheckBox.Position = [12 44 46 16];
            app.MaleCheckBox.Value = true;

            % Create Panel2_2
            app.Panel2_2 = uipanel(app.LeftPanel);
            app.Panel2_2.AutoResizeChildren = ‘off‘;
            app.Panel2_2.Title = ‘Smoker‘;
            app.Panel2_2.Position = [9 7 268 97];

            % Create NoCheckBox
            app.NoCheckBox = uicheckbox(app.Panel2_2);
            app.NoCheckBox.ValueChangedFcn = createCallbackFcn(app, @updateSelectedGenders, true);
            app.NoCheckBox.Text = ‘No‘;
            app.NoCheckBox.Position = [12 12 60 22];
            app.NoCheckBox.Value = true;

            % Create YesCheckBox
            app.YesCheckBox = uicheckbox(app.Panel2_2);
            app.YesCheckBox.ValueChangedFcn = createCallbackFcn(app, @updateSelectedGenders, true);
            app.YesCheckBox.Text = ‘Yes‘;
            app.YesCheckBox.Position = [12 42 46 22];
            app.YesCheckBox.Value = true;

            % Create Panel2_4
            app.Panel2_4 = uipanel(app.LeftPanel);
            app.Panel2_4.AutoResizeChildren = ‘off‘;
            app.Panel2_4.Title = ‘Location‘;
            app.Panel2_4.Position = [9 242 269 97];

            % Create HospitalNameDropDownLabel
            app.HospitalNameDropDownLabel = uilabel(app.Panel2_4);
            app.HospitalNameDropDownLabel.HorizontalAlignment = ‘right‘;
            app.HospitalNameDropDownLabel.Position = [8 27 84 22];
            app.HospitalNameDropDownLabel.Text = ‘Hospital Name‘;

            % Create HospitalNameDropDown
            app.HospitalNameDropDown = uidropdown(app.Panel2_4);
            app.HospitalNameDropDown.Items = {‘County General Hospital‘, ‘St. Mary‘‘s Medical Center‘, ‘VA Hospital‘, ‘All‘};
            app.HospitalNameDropDown.ValueChangedFcn = createCallbackFcn(app, @updateSelectedGenders, true);
            app.HospitalNameDropDown.Position = [107 27 153 22];
            app.HospitalNameDropDown.Value = ‘All‘;

            % Create DataSelectionLabel
            app.DataSelectionLabel = uilabel(app.LeftPanel);
            app.DataSelectionLabel.HorizontalAlignment = ‘center‘;
            app.DataSelectionLabel.FontSize = 15;
            app.DataSelectionLabel.FontWeight = ‘bold‘;
            app.DataSelectionLabel.Position = [9 356 267 22];
            app.DataSelectionLabel.Text = ‘Data Selection‘;

            % Create RightPanel
            app.RightPanel = uipanel(app.GridLayout);
            app.RightPanel.Layout.Row = 1;
            app.RightPanel.Layout.Column = 2;
            app.RightPanel.Scrollable = ‘on‘;

            % Create TabGroup
            app.TabGroup = uitabgroup(app.RightPanel);
            app.TabGroup.Position = [7 6 408 387];

            % Create PlotTab
            app.PlotTab = uitab(app.TabGroup);
            app.PlotTab.Title = ‘Plot‘;

            % Create UIAxes
            app.UIAxes = uiaxes(app.PlotTab);
            xlabel(app.UIAxes, ‘Weight‘)
            ylabel(app.UIAxes, ‘Diastolic‘)
            app.UIAxes.GridAlpha = 0.15;
            app.UIAxes.MinorGridAlpha = 0.25;
            app.UIAxes.Box = ‘on‘;
            app.UIAxes.Position = [19 89 376 215];

            % Create BinWidthSliderLabel
            app.BinWidthSliderLabel = uilabel(app.PlotTab);
            app.BinWidthSliderLabel.HorizontalAlignment = ‘center‘;
            app.BinWidthSliderLabel.VerticalAlignment = ‘top‘;
            app.BinWidthSliderLabel.Position = [241 63 76 15];
            app.BinWidthSliderLabel.Text = ‘Bin Width‘;

            % Create BinWidthSlider
            app.BinWidthSlider = uislider(app.PlotTab);
            app.BinWidthSlider.Limits = [1 11];
            app.BinWidthSlider.MajorTicks = [1 2 3 4 5 6 7 8 9 10 11];
            app.BinWidthSlider.ValueChangedFcn = createCallbackFcn(app, @refreshplot, true);
            app.BinWidthSlider.ValueChangingFcn = createCallbackFcn(app, @SliderValueChanging, true);
            app.BinWidthSlider.MinorTicks = [];
            app.BinWidthSlider.Position = [183 46 192 3];
            app.BinWidthSlider.Value = 5;

            % Create ButtonGroup
            app.ButtonGroup = uibuttongroup(app.PlotTab);
            app.ButtonGroup.AutoResizeChildren = ‘off‘;
            app.ButtonGroup.SelectionChangedFcn = createCallbackFcn(app, @refreshplot, true);
            app.ButtonGroup.Title = ‘Plotting Options‘;
            app.ButtonGroup.Position = [18 4 148 79];

            % Create ScatterButton
            app.ScatterButton = uiradiobutton(app.ButtonGroup);
            app.ScatterButton.Text = ‘Scatter‘;
            app.ScatterButton.Position = [11 34 103 15];
            app.ScatterButton.Value = true;

            % Create HistogramButton
            app.HistogramButton = uiradiobutton(app.ButtonGroup);
            app.HistogramButton.Text = ‘Histogram‘;
            app.HistogramButton.Position = [11 12 103 15];

            % Create BloodPressureSwitchLabel
            app.BloodPressureSwitchLabel = uilabel(app.PlotTab);
            app.BloodPressureSwitchLabel.HorizontalAlignment = ‘center‘;
            app.BloodPressureSwitchLabel.VerticalAlignment = ‘top‘;
            app.BloodPressureSwitchLabel.Position = [132 340 151 15];
            app.BloodPressureSwitchLabel.Text = ‘Blood Pressure‘;

            % Create BloodPressureSwitch
            app.BloodPressureSwitch = uiswitch(app.PlotTab, ‘slider‘);
            app.BloodPressureSwitch.Items = {‘Systolic‘, ‘Diastolic‘};
            app.BloodPressureSwitch.ValueChangedFcn = createCallbackFcn(app, @refreshplot, true);
            app.BloodPressureSwitch.Position = [190 309 34 15];
            app.BloodPressureSwitch.Value = ‘Systolic‘;

            % Create DataTab
            app.DataTab = uitab(app.TabGroup);
            app.DataTab.Title = ‘Data‘;

            % Create UITable
            app.UITable = uitable(app.DataTab);
            app.UITable.ColumnName = {‘Last Name‘; ‘Gender‘; ‘Smoker‘; ‘Age‘; ‘Height‘; ‘Weight‘; ‘Diastolic‘; ‘Systolic‘; ‘Location‘};
            app.UITable.RowName = {};
            app.UITable.ColumnSortable = true;
            app.UITable.RowStriping = ‘off‘;
            app.UITable.CellSelectionCallback = createCallbackFcn(app, @refreshplot, true);
            app.UITable.Position = [1 1 407 358];

            % Show the figure after all components are created
            app.PatientsDisplayUIFigure.Visible = ‘on‘;
        end
    end

    % App creation and deletion
    methods (Access = public)

        % Construct app
        function app = PatientsDisplay

            % Create UIFigure and components
            createComponents(app)

            % Register the app with App Designer
            registerApp(app, app.PatientsDisplayUIFigure)

            % Execute the startup function
            runStartupFcn(app, @startupFcn)

            if nargout == 0
                clear app
            end
        end

        % Code that executes before app deletion
        function delete(app)

            % Delete UIFigure when app is deleted
            delete(app.PatientsDisplayUIFigure)
        end
    end
end
略去之前已经分析过的部分,在Properties部分,我们看到,除了前面提及的控件属性、窗口宽度外,增加了很大一部分内容,这部分是关于数据载入、直方图/散点图/表格等内容的辅助程序。
 properties (Access = private)
        % Declare properties of the PatientsDisplay class.
        Data
        SelectedGenders
        SelectedColors
        BinWidth
        Histogram = gobjects(0)
        displayedIndices
    end
这个app类叫做PatientsDisplay,这部分声明这个类里私有成分,包括Data、SelectedGenders、SelectedColors、BinWidth、Histogram = gobjects(0)、displayedIndices。
 function NBins = numhistbins(app,data)
            % Utility function to compute the number of histogram bins
            binwidth = app.BinWidth;
            range2plot =  floor(min(data)):binwidth:ceil(max(data));
            NBins = size(range2plot,2);
        end
这个函数是用于计算 直方图 每一条柱的数据: 将滑块读取的BinWidth的值赋值给binwidth,range2plot是最小值到最大值的范围的向量,NBins是直方图每一个条形的宽度。
floor()这个函数是向下取整。
function annotateScatterPlot(app)
            % Update X and Y Labels
            app.UIAxes.XLabel.String = ‘Weight‘;
            app.UIAxes.YLabel.String = app.BloodPressureSwitch.Value;
            % Dont show the histogram slider
            app.BinWidthSliderLabel.Visible = ‘off‘;
            app.BinWidthSlider.Visible = ‘off‘;
        end
绘制散点图时,坐标区的x的名称为Weight,Y坐标的名称根据控件开关的状态更新;滑块及其标签隐藏。
function annotateHistogram(app)

            % Update X and Y Labels
            app.UIAxes.XLabel.String = app.BloodPressureSwitch.Value;
            app.UIAxes.YLabel.String = ‘# of Patients‘;

            % Show histogram slider
            app.BinWidthSliderLabel.Visible = ‘on‘;
            app.BinWidthSlider.Visible = ‘on‘;
        end
绘制直方图时,坐标区的x的名称根据控件状态变化,Y坐标的名称为# of Patients;滑块及其标签显示。
重点: 控制某个控件是否可见,采用:app.XXX.Visible=‘on‘或者 ‘off‘;坐标区的X、Y坐标名称也可以根据控件的状态进行更改,方式为app.XXX.XLabel.String = ‘Weight‘
读取开关控件的值采用的程序语句为:XXX= app.xxx.Value。
function filterData(app)
            % Utility function to filter the data according to the controls

            % Initially assume that all data will be displayed and then, subsequently, filter the data
            % based on the controls
            tempIndices = ones([size(app.Data,1),1]);

            % Append a column to tempIndices to indicate data that satisfies the smoker control
            if app.NoCheckBox.Value && ~app.YesCheckBox.Value
                tempIndices = [tempIndices, app.Data.Smoker == 0];
            elseif app.YesCheckBox.Value && ~app.NoCheckBox.Value
                tempIndices = [tempIndices, app.Data.Smoker == 1];
            elseif  ~app.YesCheckBox.Value && ~app.NoCheckBox.Value
                tempIndices = [tempIndices, zeros([size(app.Data,1),1])];
            end

            % Append a column to tempIndices to indicate data that satisfies the gender control
            if app.MaleCheckBox.Value && ~app.FemaleCheckBox.Value
                tempIndices = [tempIndices, app.Data.Gender == "Male"];
            elseif app.FemaleCheckBox.Value && ~app.MaleCheckBox.Value
                tempIndices = [tempIndices, app.Data.Gender == "Female"];
            elseif  ~app.FemaleCheckBox.Value && ~app.MaleCheckBox.Value
                tempIndices = [tempIndices, zeros([size(app.Data,1),1])];
            end

            % Append a column to tempIndices to indicate data that satisfies the location control
            if app.HospitalNameDropDown.Value ~= "All"
                tempIndices = [tempIndices, app.Data.Location == string(app.HospitalNameDropDown.Value)];
            end

            % Determine which data points satisfy all requirements
            app.displayedIndices = (sum(tempIndices,2)/size(tempIndices,2) == 1);
        end
    end
这部分程序的功能是数据选用。ones(x,y)定义x行y列的单元向量。
接下来的if语句是判别复选框状态的语句。其中,~ app.YesCheckBox.Value中前面的~是非的意思。
其余部分自行理解,这里需要重点说明:
复选框的程序调用方法:
 if app.A.Value && ~app.B.Value
                xxxx;
 elseif app.B.Value && ~app.A.Value
                YYYY;
 elseif  ~app.A.Value && ~app.B.Value
               0000;
 end
下拉框的程序调用方法:
XXX == string(app.DropDown.Value)
  % Callbacks that handle component events
    methods (Access = private)

        % Code that executes after component creation
        function startupFcn(app)
            % Load the data.
            load(‘patients.mat‘,‘LastName‘,‘Gender‘,‘Smoker‘,‘Age‘,‘Height‘,‘Weight‘,‘Diastolic‘,‘Systolic‘,‘Location‘);

            % Store the data in a table and display it in one of the App‘s tabs.
            app.Data = table(LastName,Gender,Smoker,Age,Height,Weight,Diastolic,Systolic,Location);
            app.UITable.Data = app.Data;
            app.BinWidth = app.BinWidthSlider.Value;

            % Update the axes with the corresponding data.
            updateSelectedGenders(app)
            refreshplot(app)
        end
加载数据:load(‘文件名’,‘XXX’);
现将数据赋值给app.Data,再导入table中。
  更新数据:updateSelectedGenders(app)
  刷新绘图:refreshplot(app)
% Changes arrangement of the app based on UIFigure width
        function updateAppLayout(app, event)
            currentFigureWidth = app.PatientsDisplayUIFigure.Position(3);
            if(currentFigureWidth <= app.onePanelWidth)
                % Change to a 2x1 grid
                app.GridLayout.RowHeight = {400, 400};
                app.GridLayout.ColumnWidth = {‘1x‘};
                app.RightPanel.Layout.Row = 2;
                app.RightPanel.Layout.Column = 1;
            else
                % Change to a 1x2 grid
                app.GridLayout.RowHeight = {‘1x‘};
                app.GridLayout.ColumnWidth = {282, ‘1x‘};
                app.RightPanel.Layout.Row = 1;
                app.RightPanel.Layout.Column = 2;
            end
        end
根据界面调整布局,之前在学习(二)中已经详细讲解。
  % Value changing function: BinWidthSlider
        function SliderValueChanging(app, event)
            % Update the histogram as the slider value for bindwidth changes.
            app.BinWidth = event.Value;
            for ii=1:length(app.Histogram)
                app.Histogram(ii).NumBins = numhistbins(app,app.Histogram(ii).Data);
            end
        end
根据滑块的值变动直方图的宽度。
% Callback function: BinWidthSlider, BloodPressureSwitch,
        % ButtonGroup, UITable
        function refreshplot(app, event)
            Genders = app.SelectedGenders;
            Colors = app.SelectedColors;

            % Start with a fresh plot
            cla(app.UIAxes)
            hold(app.UIAxes,‘on‘)
            app.Histogram = gobjects(0);

            % Select relevant segment of data
            xdata = app.Data.Weight;
            ydata = app.Data.(app.BloodPressureSwitch.Value);

            % Filter the data according to the controls
            filterData(app);
重点内容:
清空坐标区内的绘图数据:cla(app.UIAxes)
% Create either a scatter plot or histogram, based on selection
            switch app.ButtonGroup.SelectedObject.Text

                case ‘Scatter‘
                    % Build a scatter plot for each selected gender
                    for ii = 1:length(Genders)
                        selectedpatients = ((app.Data.Gender == Genders(ii)) & (app.displayedIndices));
                        scatter(app.UIAxes,xdata((selectedpatients)),ydata(selectedpatients),Colors{ii});
                    end
                    annotateScatterPlot(app)

                case ‘Histogram‘
                    % Build a histogram for each selected gender
                    for ii = 1:length(Genders)
                        selectedpatients = ((app.Data.Gender == Genders(ii)) & (app.displayedIndices));
                        NBins = numhistbins(app,ydata(selectedpatients));
                        h = histogram(app.UIAxes,ydata(selectedpatients),NBins,‘BinLimits‘,[floor(min(ydata)) ceil(max(ydata))]);
                        h.EdgeColor = Colors{ii};
                        h.FaceColor = Colors{ii};
                        app.Histogram = [app.Histogram h];
                    end
                    annotateHistogram(app)

            end
重点:按钮组的程序调用方法:
采用switch语句,对按钮组进行程序操作
 % Update the table to show only the data that satisfies the controls
            app.UITable.Data = app.Data(app.displayedIndices,:);
            drawnow;
        end
drawnow; 更新图窗并处理回调
% Value changed function: FemaleCheckBox,
        % HospitalNameDropDown, MaleCheckBox, NoCheckBox,
        % YesCheckBox
        function updateSelectedGenders(app, event)
            % List which genders and colors to use
            Genders = [];
            Colors = [];
            Smoker = [];

            if app.MaleCheckBox.Value
                Genders = "Male";
                Colors = "blue";
            end
            if app.FemaleCheckBox.Value
                Genders = [Genders "Female"];
                Colors = [Colors "red"];
            end
            if app.YesCheckBox.Value
                Smoker = "Yes";
            end
            if app.NoCheckBox.Value
                Smoker = [Smoker "No"];
            end

            if isempty(Genders) || isempty(Smoker)
                % Disable the switches and buttons if they were on
                app.BloodPressureSwitch.Enable = ‘off‘;
                app.ScatterButton.Enable = ‘off‘;
                app.HistogramButton.Enable = ‘off‘;
                app.BinWidthSliderLabel.Enable = ‘off‘;
                app.BinWidthSlider.Enable = ‘off‘;
            else
                % Enable the switches and buttons if they were off
                app.BloodPressureSwitch.Enable = ‘on‘;
                app.ScatterButton.Enable = ‘on‘;
                app.HistogramButton.Enable = ‘on‘;
                app.BinWidthSliderLabel.Enable = ‘on‘;
                app.BinWidthSlider.Enable = ‘on‘;
            end
            app.SelectedGenders = Genders;
            app.SelectedColors = Colors;

            refreshplot(app)
        end
    end
isempty()函数是判断数组是否为空,如果为空,返回逻辑真,值为1,如果数组不为空,返回逻辑假,值为0,其他内容便比较容易理解了。
这部分学习的内容包括 下拉框、复选框、按钮组、滑块值、开关、菜单栏、表格、散点图和直方图的绘制等功能。另外对辅助功能如清空绘图区、刷线图窗更新等命令也做了学习。
但是这部分关于编程思想并没有学习透彻,我们之后会专门提到这个问题。因此,本节内容只要掌握这些控件的程序调用方式即可。
下一节我们学习其他的控件,我另起文档介绍,继续跟紧我!
标签:list controls uibutton des 单元 学习 app 功能 spi
原文地址:https://www.cnblogs.com/Sonny-xby/p/12571258.html