标签:val tomcat print setup -o www tip rds type
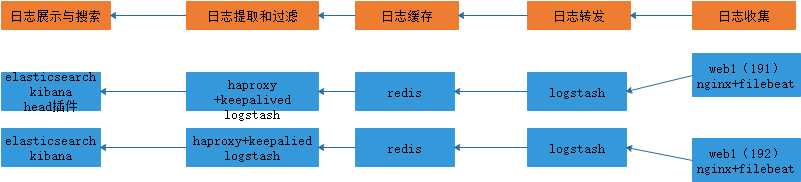
一、日志收集端
1、nginx:nginx-1.16.1.tar.gz
为了kibana收集nginx日志获取字段,先将日志转化为json格式。格式样式如下:
log_format access_json ‘{"@timestamp":"$time_iso8601",‘
    ‘"host":"$server_addr",‘
    ‘"clientip":"$remote_addr",‘
    ‘"size":$body_bytes_sent,‘
    ‘"responsetime":$request_time,‘
    ‘"upstreamtime":"$upstream_response_time",‘
    ‘"upstreamhost":"$upstream_addr",‘
    ‘"http_host":"$host",‘
    ‘"uri":"$uri",‘
    ‘"domain":"$host",‘
    ‘"xff":"$http_x_forwarded_for",‘
    ‘"referer":"$http_referer",‘
    ‘"tcp_xff":"$proxy_protocol_addr",‘
    ‘"http_user_agent":"$http_user_agent",‘
    ‘"status":"$status"}‘;
access_log /apps/nginx/logs/access_json.log access_json;
2、安装完filebeat,安装包:filebeat-7.6.1-amd64.deb
修改它的配置文件,下面为修改的内容:
vim /etc/filebeat/filebeat.yml
filebeat.inputs:
- type: log
  enabled: true
  paths:
    - /usr/local/nginx/logs/access_json.log
  fields:
    type: nginx-access-log         #添加字段(fields.type)
    host: 192.168.134.191
 - type: log
   enabled: true
   fields:
     type: nginx-error-log
     host: 192.168.134.191
   paths:
     - /usr/local/nginx/logs/error.log
 - type: log
   enabled: true
   fields:
     type: nginx-syslog
     host: 192.168.134.191
   paths:
     - /var/log/syslog
二、日志转发端
1、配置 logstash 转发filebeat收集的nginx日志
软件包:logstash-7.6.1.deb,logstash需要Java环境。
安装jdk环境
apt-get update
apt-get install openjdk-8-jdk -y
dpkg -i logstash-7.6.1.deb
由于logstash要收集日志修改logstash的权限,或修改日志权限
vim /etc/logstash/startup.options
LS_USER=root
LS_GROUP=root
运行:
/usr/share/logstash/bin/system-install
systemctl restart logstash
root@logstash-1:/etc/logstash# ps -ef | grep logstash
root      10431      1 99 20:34 ?        00:00:06 /usr/bin/java -Xms1g -Xmx1g -XX:+UseConcMarkSweepGC
2、logstash与filebeat建立联系
https://www.elastic.co/guide/en/logstash/current/plugins-inputs-beats.html
https://www.elastic.co/guide/en/beats/filebeat/current/logstash-output.html
filebeat的配置
filebeat.inputs:
- type: log
  enabled: true
  paths:
    - /usr/local/nginx/logs/access_json.log  #收集日志路径
  fields:    #用于kibana区分的字段
    type: nginx-access-log
    host: 192.168.134.191
- type: log
  enabled: true
  fields:
    type: nginx-error-log
    host: 192.168.134.191
  paths:
    - /usr/local/nginx/logs/error.log
- type: log
  enabled: true
  fields:
    type: nginx-syslog
    host: 192.168.134.191
  paths:
    - /var/log/syslog
filebeat.config.modules:
  path: ${path.config}/modules.d/*.yml
  reload.enabled: false
setup.template.settings:
  index.number_of_shards: 1
setup.kibana:
processors:
  - add_host_metadata: ~
  - add_cloud_metadata: ~
  - add_docker_metadata: ~
  - add_kubernetes_metadata: ~
output.logstash:     #file收集的日志发给logstash
  hosts: ["192.168.134.193:5044", "192.168.134.194:5045"]  #支持多个logstash
  loadbalance: true
  worker: 5
logstash配置
root@logstash-2:~# vim /etc/logstash/conf.d/log-redis.conf

      password => "123456"
      data_type => "list"
      key => "nginx-access-log-192"
      codec => "json"

     }
     }
  if [fields][type] == "nginx-error-log" {
    redis {
      host => "192.168.134.194"
      port => "6379"
      db => "1"
      password => "123456"
      data_type => "list"
      key => "nginx-error-log-192"
     }
     }

  if [fields][type] == "nginx-syslog" {
    redis {
      host => "192.168.134.194"
      port => "6379"
      db => "1"
      password => "123456"
      data_type => "list"
      key => "nginx-syslog-192"

     }

}
}
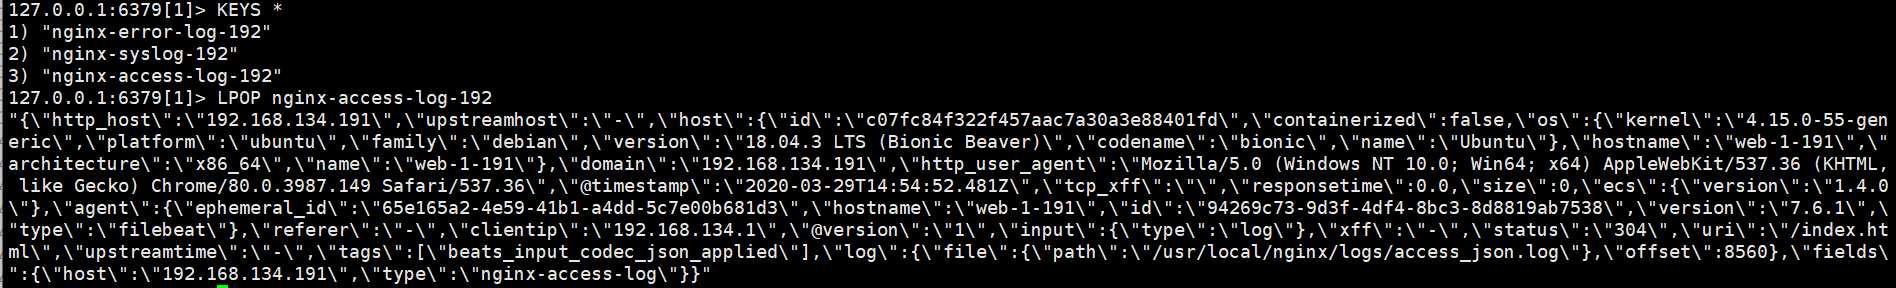
验证是否存入redis
127.0.0.1:6379[1]> KEYS *
1) "nginx-error-log-192"
2) "nginx-syslog-192"
3) "nginx-access-log-192"
三、日志缓存
使用redis做日志缓存
配置redis
[root@linux-host2 redis]# grep "^[a-Z]" redis.conf  #主要改动的地方
bind 0.0.0.0
protected-mode yes
port 6379
tcp-backlog 511
timeout 0
tcp-keepalive 300
daemonize yes
supervised no
pidfile /var/run/redis_6379.pid
loglevel notice
logfile ""
databases 16
requirepass 123456
save ""
rdbcompression no  #是否压缩
rdbchecksum no  #是否校验
日志Json格式:
检测redis收集的日志的条数
#!/usr/bin/env python
#coding:utf-8
import redis
def redis_conn():
     pool=redis.ConnectionPool(host="192.168.134.199",port=6379,db=1,password=123456)
     conn = redis.Redis(connection_pool=pool)
     data = conn.llen(‘tomcat-accesslog-1512‘)
     print(data)
redis_conn()
四、日志提取和过滤
使用logstash日志提取,使用 [fields][type]进行过滤。
input {
    redis {
      host => "192.168.134.194"
      port => "6379"
      db => "1"
      password => "123456"
      data_type => "list"
      key => "nginx-access-log-192"
      codec => "json"
     }
    redis {
      host => "192.168.134.194"
      port => "6379"
      db => "1"
      password => "123456"
      data_type => "list"
      key => "nginx-error-log-192"
     }

    redis {
      host => "192.168.134.194"
      port => "6379"
      db => "1"
      password => "123456"
      data_type => "list"
      key => "nginx-syslog-192"

     }
}

output {
   if [fields][type] == "nginx-access-log" {
     elasticsearch {
      hosts => ["192.168.134.199:9200"]
      index =>  "nginx-access-log-192-%{+YYYY.MM.dd}"
    }

}
   if [fields][type] == "nginx-error-log" {
     elasticsearch {
      hosts => ["192.168.134.199:9200"]
      index =>  "nginx-error-log-192-%{+YYYY.MM.dd}"
    }
}
   if [fields][type] == "nginx-syslog" {
     elasticsearch {
      hosts => ["192.168.134.199:9200"]
      index =>  "nginx-syslog-192-%{+YYYY.MM.dd}"
    }
}
}
五、利用elasticsearch和kibana进行日志展示和搜索
配置 elasticsearch 服务器
安装包:elasticsearch-7.6.1-amd64.deb
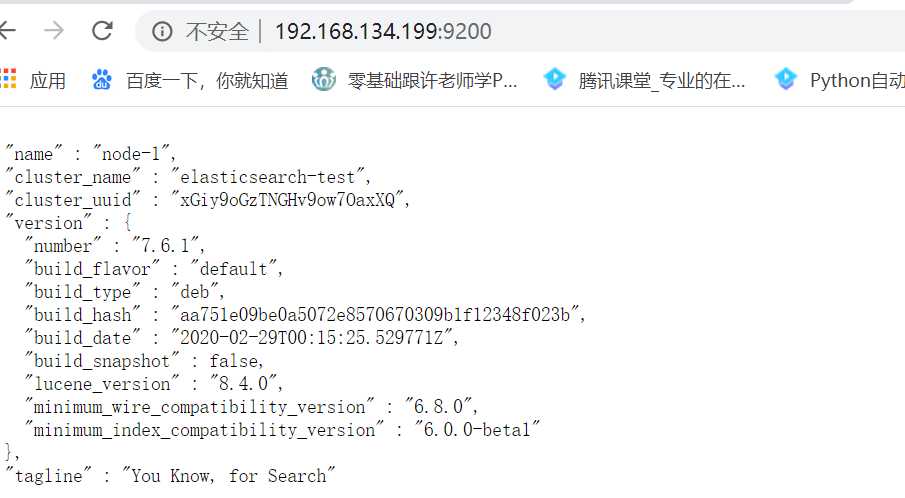
root@elasticsearch-198:~#  grep "^[a-Z]"   /etc/elasticsearch/elasticsearch.yml
cluster.name: elasticsearch-test
node.name: node-1
path.data: /var/lib/elasticsearch
path.logs: /var/log/elasticsearch
bootstrap.memory_lock: true
network.host: 0.0.0.0
http.port: 9200
discovery.seed_hosts: ["192.168.134.199", "192.168.134.198"]
cluster.initial_master_nodes: ["192.168.134.199", "192.168.134.198"]
gateway.recover_after_nodes: 1
action.destructive_requires_name: true
修改内存限制,并同步配置文件:
 vim /usr/lib/systemd/system/elasticsearch.service #修改内存限制 LimitMEMLOCK=infinity  #无限制使用内存
ss -nlt
LISTEN                0                      128                                                 *:9200                                             *:*
LISTEN                0                      128                                                 *:9300                                             *:*
通过浏览器访问 elasticsearch 服务端口:
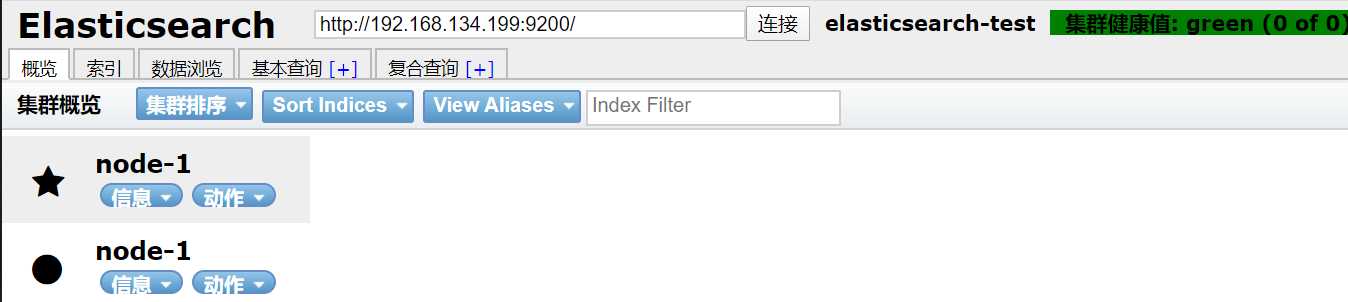
安装 elasticsearch 插件之 head
1、docker 版本启动 head 插件
在 elasticsearch 5.x 版本以后不再支持直接安装 head 插件,而是需要通过启动 一个服务方式,git 地址:https://github.com/mobz/elasticsearch-head
docker run -d -p 9100:9100 mobz/elasticsearch-head:5 #for Elasticsearch 5.x
修改 elasticsearch 服务配置文件:
添加:
http.cors.enabled: true  #开启支持跨域访问
http.cors.allow-origin: "*" #指定允许访问范围
测试:
安装并配置kibana:
安装包:kibana-7.6.1-amd64.deb
root@elasticsearch-198:~# grep -n "^[a-Z]" /etc/kibana/kibana.yml
2:server.port: 5601
7:server.host: "0.0.0.0"
28:elasticsearch.hosts: ["http://192.168.134.198:9200"]
115:i18n.locale: "zh-CN"
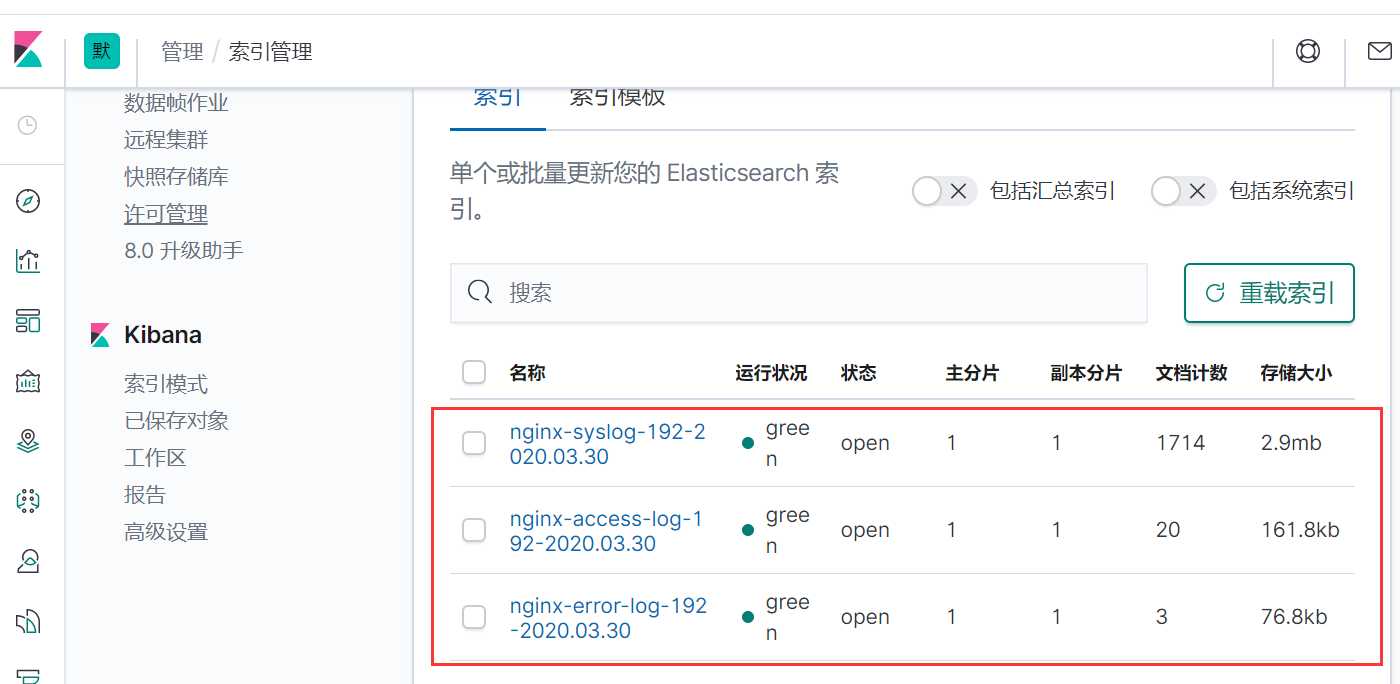
结果展示
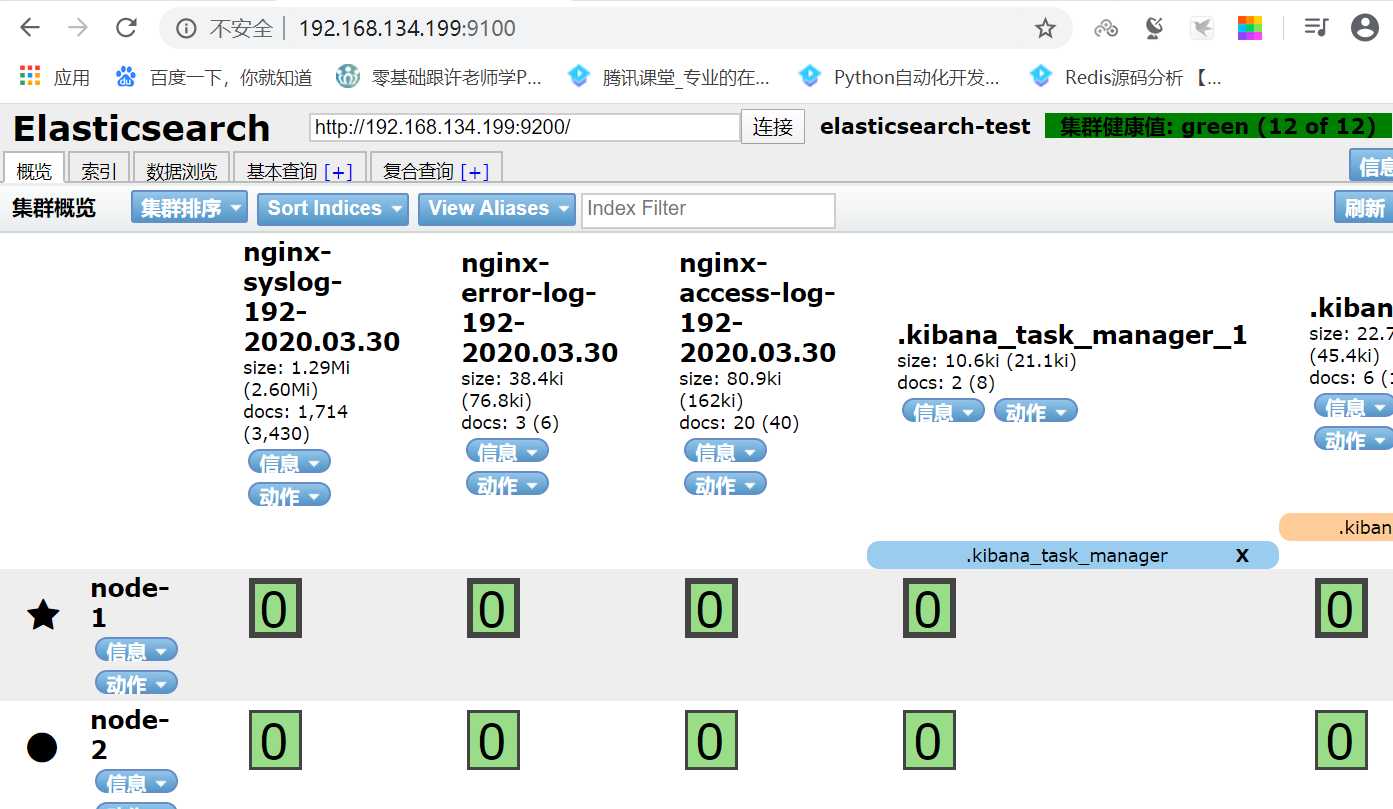
kibana展示:
为了保证高可用
安装haproxy和keepalived。这里仅显示配置信息,完整高可用实验配置这里省略。
keepalived配置:
global_defs {
    notification_email {
    root@localhost
    }
notification_email_from keepalived@localhost
smtp_server 127.0.0.1
smtp_connect_timeout 30
router_id ha1.example.com
vrrp_skip_check_adv_addr
vrrp_strict
vrrp_garp_interval 0
vrrp_gna_interval 0

vrrp_mcast_group4 224.0.0.18
#vrrp_iptables
}

vrrp_instance VI_1 {
state MASTER
interface eth0
virtual_router_id 80
priority 100
advert_int 1
authentication {
auth_type PASS
auth_pass stevenux
}
virtual_ipaddress {
    192.168.134.200 dev eth0 label eth0:0
}
}

haproxy配置
listen stats
    mode http
    bind 0.0.0.0:9999
    stats enable
    log global
    stats uri     /haproxy-status
    stats auth    haadmin:stevenux

listen elasticsearch_elasticsearch
  mode http
  balance roundrobin
  bind 192.168.134.200:19200
  server 192.168.134.199 192.168.134.199:9200 check inter 3s fall 3 rise 5
  server 192.168.134.198 192.168.134.198:9200 check inter 3s fall 3 rise 5


listen elasticsearch_kibana
  mode http
  balance roundrobin
  bind 192.168.134.200:56001
  server 192.168.134.199 192.168.134.199:5601 check inter 3s fall 3 rise 5
  server 192.168.134.198 192.168.134.198:5601 check inter 3s fall 3 rise 5
如何删除多余或过期的的index
#!/bin/bash
DATE=`date -d "2 days ago" +%Y.%m.%d`
index="
nginx-syslog-192-
nginx-error-log-192-
nginx-access-log-192-
"
for NAME in ${index};do
  FULL_NAME="$NAME-$DATE"
  curl -XDELETE http://192.168.134.200:19200/${FULL_NAME}
done
标签:val tomcat print setup -o www tip rds type
原文地址:https://www.cnblogs.com/lummg-DAY/p/12593988.html