标签:return out oat square function put run env 去掉
将训练过程可视化出来
import tensorflow as tf
import numpy as np
import matplotlib.pyplot as plt

# 去掉警告
import warnings
warnings.filterwarnings("ignore",".*GUI is implemented.*")

import os
os.environ[‘TF_CPP_MIN_LOG_LEVEL‘] = ‘2‘

def add_layer(inputs, in_size, out_size, activation_function = None):
    Weights = tf.Variable(tf.random_normal([in_size, out_size]))
    biases = tf.Variable(tf.zeros([1, out_size]) + 0.1) # 保证 biases 不为 0
    Wx_plus_b = tf.matmul(inputs, Weights) + biases
    if activation_function == None:
        outputs = Wx_plus_b
    else:
        outputs = activation_function(Wx_plus_b)
    return outputs

x_data = np.linspace(-1, 1, 300) #(300,)
x_data = x_data.reshape(300,1) # (300, 1)

noise = np.random.normal(0, 0.05, x_data.shape)
y_data = np.square(x_data) - 0.5 + noise

# 为 batch 做准备
xs = tf.placeholder(tf.float32, [None, 1])
ys = tf.placeholder(tf.float32, [None, 1])

l1 = add_layer(xs, 1, 10, activation_function = tf.nn.relu)
prediction = add_layer(l1, 10, 1, activation_function = None)

loss = tf.reduce_mean(tf.reduce_sum(tf.square(ys - prediction), 1))

train_step = tf.train.GradientDescentOptimizer(0.1).minimize(loss)

init = tf.global_variables_initializer()

# 画图
fig = plt.figure()
ax = fig.add_subplot(1,1,1)
ax.scatter(x_data, y_data)
plt.ion()

with tf.Session() as sess:
    sess.run(init)
    for step in range(1000):
        sess.run(train_step, feed_dict = {xs: x_data, ys: y_data})
        if step % 20 == 0:
            #print(‘loss = ‘, sess.run(loss, feed_dict = {xs: x_data, ys: y_data}))
#            try:
#                ax.lines.remove(lines[0])
#            except Exception:
#                pass

            prediction_value = sess.run(prediction, feed_dict = {xs:x_data})
#            print(prediction_value)
            lines = ax.plot(x_data, prediction_value,‘b-‘, lw = 3)

            plt.pause(0.1)
            ax.lines.remove(lines[0])
        step += 1
        plt.show()
在训练过程中遇到的问题即解决办法:
1、显示不出蓝线
2、不能动态显示
解决办法:
1、在spyder中,将tools----preferences----IPython console----Graphics----Backend----改成Automatic,最后需要再对Spyder软件进行重新启动,没有重启则不能实现设置效果。这样就可以显示出单独的窗口,并可以实现动态的figure显示,
2、step += 1,我刚开始运行的时候没有加这句,就会导致结果被剔除,就没有红线
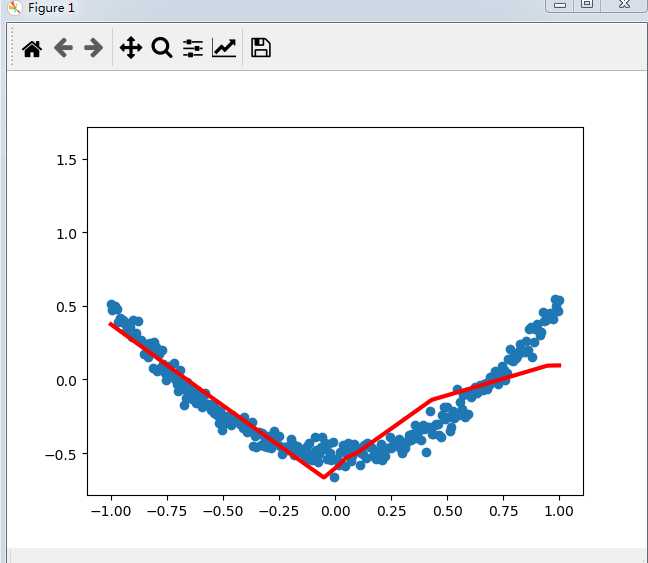
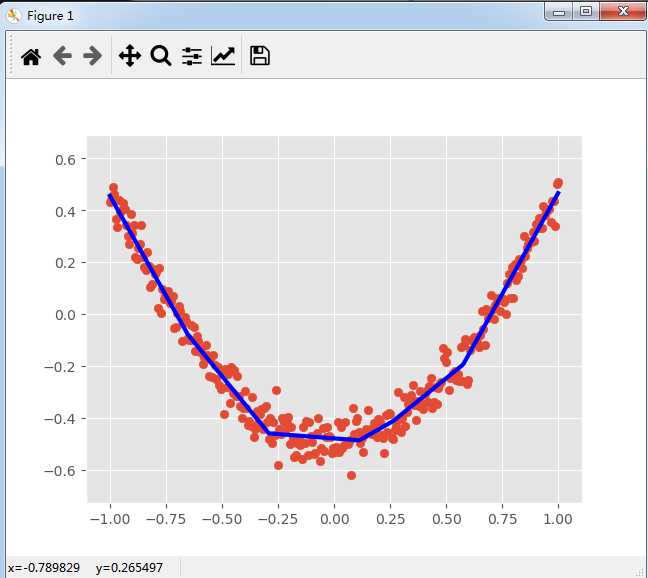
可以看出最后会越接近给出的数据
标签:return out oat square function put run env 去掉
原文地址:https://www.cnblogs.com/gaona666/p/12638705.html