标签:变换 user 了解 requests 转化 web ica tick 线性回归
一.主题式网络爬虫设计方案
1.主题式网络爬虫名称:搜狗热搜榜综艺最红榜排名
2.主题式网络爬虫爬取的内容:综艺最红榜的名称、排名、搜索指数
3.设计方案概述:
实现思路:首先通过爬虫采集搜狗热搜榜的综艺排名数据,并对采集到的数据进行清洗;然后,对清洗后的数据进行可视化分析,探索隐藏在数据背后的规律,对所有数据的概括总结。
技术难点:网页页面分类较多,对爬取文本位置增加了一定的难度
二、主题页面的结构特征分析
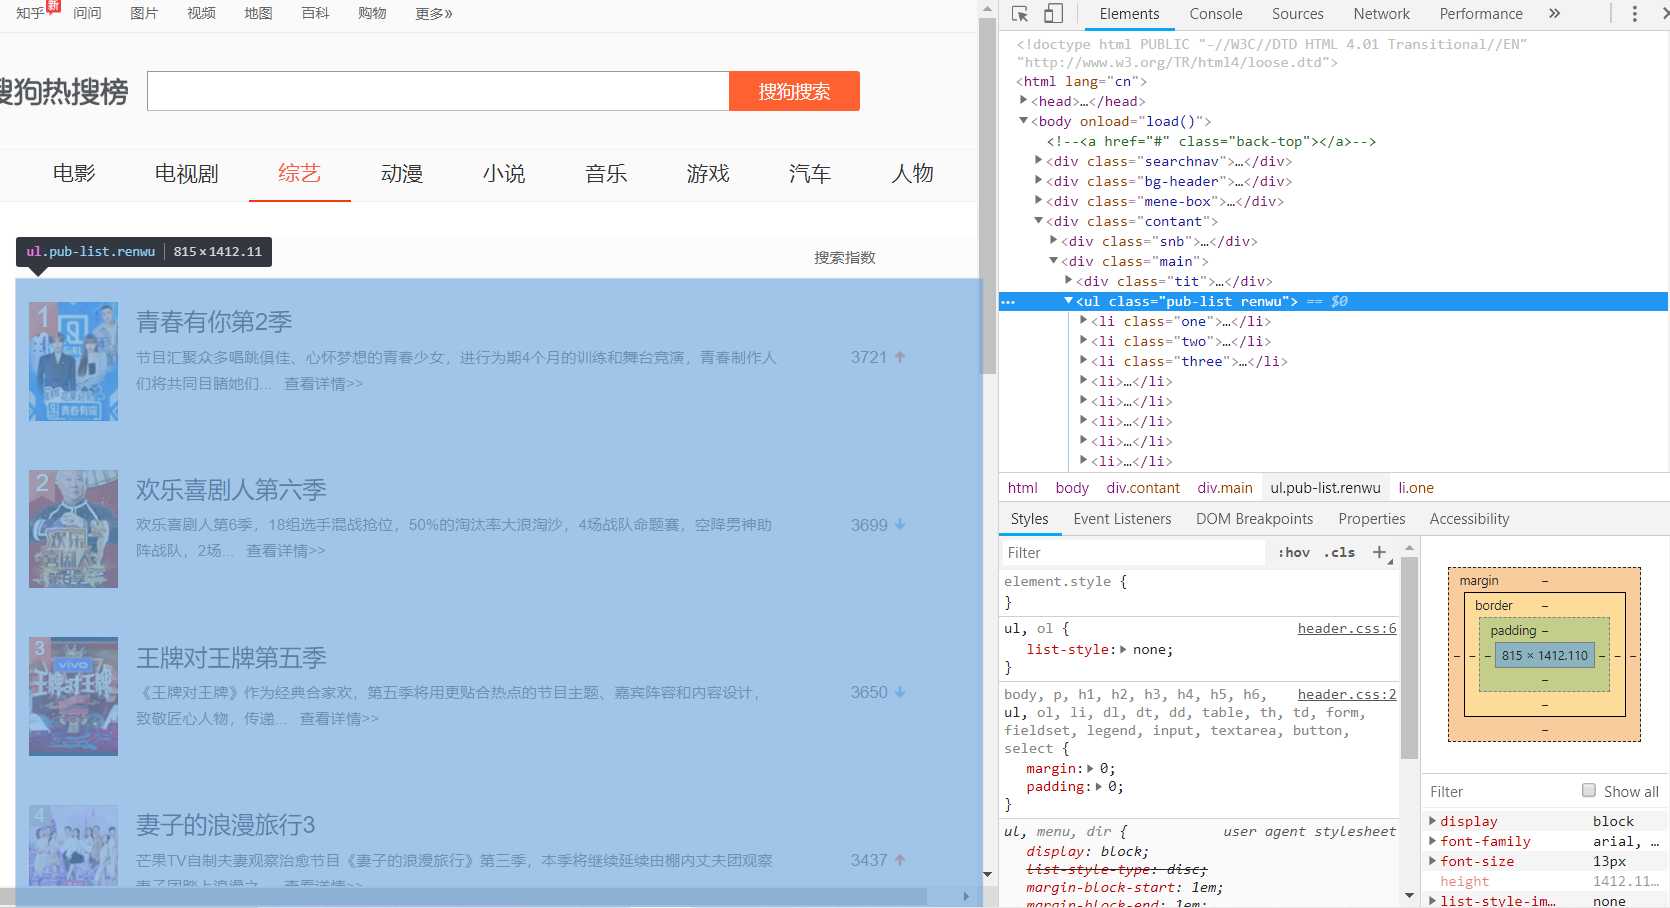
1.主题页面的结构与特征分析:如图所示,为我们需要的数据都在该页面里,包括我们可以看到综艺的名称、排名、搜索指数三类。

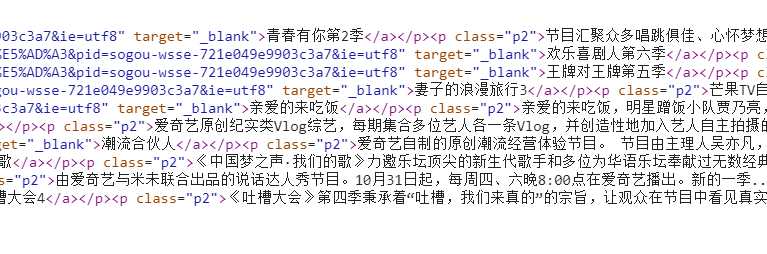
通过查看网页源代码来定位元素
①为程序中每次http请求构造header并且每次变换http请求header信息头中USER_AGENTS数据项的值,让请求信息看起来像是从不同浏览器发出的访问请求。②爬虫程序每处理完一次http请求和响应后,随机睡眠1-3秒。
 1 user_agent_list= [
 2 "Mozilla/5.0 (Windows NT 6.1; WOW64) AppleWebKit/537.1 (KHTML, like Gecko) Chrome/22.0.1207.1 Safari/537.1",
 3 "Mozilla/5.0 (X11; CrOS i686 2268.111.0) AppleWebKit/536.11 (KHTML, like Gecko) Chrome/20.0.1132.57 Safari/536.11",
 4 "Mozilla/5.0 (Windows NT 6.1; WOW64) AppleWebKit/536.6 (KHTML, like Gecko) Chrome/20.0.1092.0 Safari/536.6",
 5 "Mozilla/5.0 (Windows NT 6.2) AppleWebKit/536.6 (KHTML, like Gecko) Chrome/20.0.1090.0 Safari/536.6",
 6 "Mozilla/5.0 (Windows NT 6.2; WOW64) AppleWebKit/537.1 (KHTML, like Gecko) Chrome/19.77.34.5 Safari/537.1",
 7 "Mozilla/5.0 (X11; Linux x86_64) AppleWebKit/536.5 (KHTML, like Gecko) Chrome/19.0.1084.9 Safari/536.5",
 8 "Mozilla/5.0 (Windows NT 6.0) AppleWebKit/536.5 (KHTML, like Gecko) Chrome/19.0.1084.36 Safari/536.5",
 9 "Mozilla/5.0 (Windows NT 6.1; WOW64) AppleWebKit/536.3 (KHTML, like Gecko) Chrome/19.0.1063.0 Safari/536.3",
10 "Mozilla/5.0 (Windows NT 5.1) AppleWebKit/536.3 (KHTML, like Gecko) Chrome/19.0.1063.0 Safari/536.3",
11 "Mozilla/5.0 (Macintosh; Intel Mac OS X 10_8_0) AppleWebKit/536.3 (KHTML, like Gecko) Chrome/19.0.1063.0 Safari/536.3",
12 Mozilla/5.0 (Windows NT 6.2) AppleWebKit/536.3 (KHTML, like Gecko) Chrome/19.0.1062.0 Safari/536.3",
13 "Mozilla/5.0 (Windows NT 6.1; WOW64) AppleWebKit/536.3 (KHTML, like Gecko) Chrome/19.0.1062.0 Safari/536.3",
14 "Mozilla/5.0 (Windows NT 6.2) AppleWebKit/536.3 (KHTML, like Gecko) Chrome/19.0.1061.1 Safari/536.3",
15 "Mozilla/5.0 (Windows NT 6.1; WOW64) AppleWebKit/536.3 (KHTML, like Gecko) Chrome/19.0.1061.1 Safari/536.3",
16 Mozilla/5.0 (Windows NT 6.1) AppleWebKit/536.3 (KHTML, like Gecko) Chrome/19.0.1061.1 Safari/536.3",
17 "Mozilla/5.0 (Windows NT 6.2) AppleWebKit/536.3 (KHTML, like Gecko) Chrome/19.0.1061.0 Safari/536.3",
18 "Mozilla/5.0 (X11; Linux x86_64) AppleWebKit/535.24 (KHTML, like Gecko) Chrome/19.0.1055.1 Safari/535.24",
19 "Mozilla/5.0 (Windows NT 6.2; WOW64) AppleWebKit/535.24 (KHTML, like Gecko) Chrome/19.0.1055.1 Safari/535.24"
20 ]
21 UserAgent = random.choice(user_agent_list)
22 headers = {‘User-Agent‘: UserAgent}
23 response = requests.get(url, headers=headers)
24 time.sleep(3)
三、网络爬虫程序设计
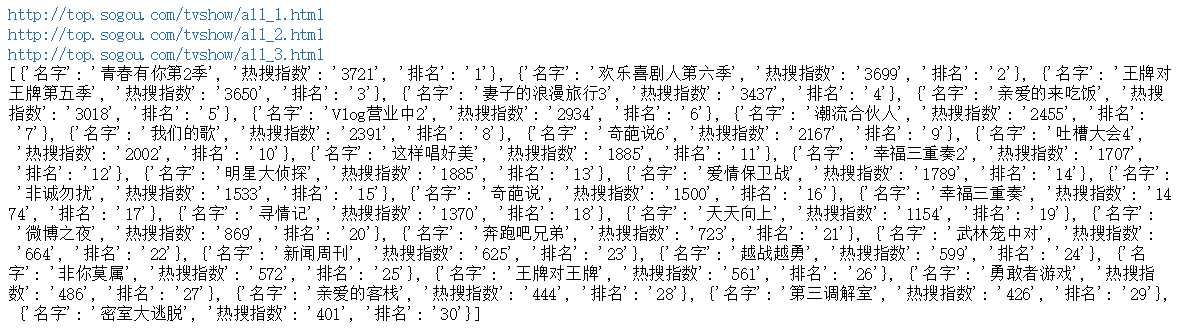
1.数据爬取与采集
我们要在爬取的页面中按F12,在Elements中找到想要爬取的位置,我们可以知道所要爬取的内容在<ul class=”pub-list renwu”>
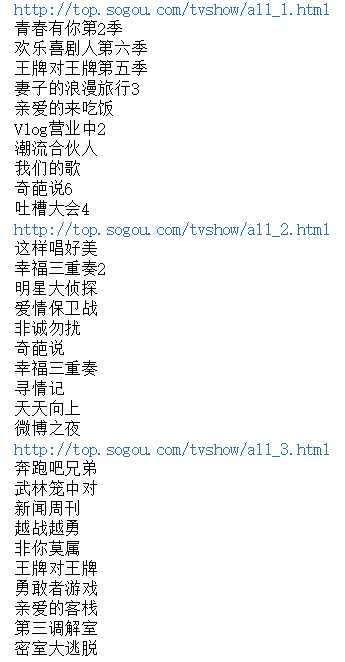
 1 import requests#在代码的最后命名保存的文件的名称
 2 import pandas as pd
 3 from lxml import etree
 4 import time
 5 import random
 6 import matplotlib.pyplot as plt
 7 import numpy as np
 8 cha_list=[]
 9 for i in range(1,4):#新香洲的房间信息一共有44页,我们把44+1=45,相当于循环44次,
10     #如果有57页,只需要把数字改成58
11     url = ‘http://top.sogou.com/tvshow/all_‘ + str(i)+‘.html‘
12     #如果我们爬取的是香洲区下的新香洲,新香洲的网址是https://zh.lianjia.com/ershoufang/xinxiangzhou/rs珠海/
13     #只需要在后面加pg就可以了,具体可以参照上面的url
14     print(url)
15     user_agent_list= [
16     "Mozilla/5.0 (Windows NT 6.1; WOW64) AppleWebKit/537.1 (KHTML, like Gecko) Chrome/22.0.1207.1 Safari/537.1",
17     "Mozilla/5.0 (X11; CrOS i686 2268.111.0) AppleWebKit/536.11 (KHTML, like Gecko) Chrome/20.0.1132.57 Safari/536.11",
18     "Mozilla/5.0 (Windows NT 6.1; WOW64) AppleWebKit/536.6 (KHTML, like Gecko) Chrome/20.0.1092.0 Safari/536.6",
19     "Mozilla/5.0 (Windows NT 6.2) AppleWebKit/536.6 (KHTML, like Gecko) Chrome/20.0.1090.0 Safari/536.6",
20     "Mozilla/5.0 (Windows NT 6.2; WOW64) AppleWebKit/537.1 (KHTML, like Gecko) Chrome/19.77.34.5 Safari/537.1",
21     "Mozilla/5.0 (X11; Linux x86_64) AppleWebKit/536.5 (KHTML, like Gecko) Chrome/19.0.1084.9 Safari/536.5",
22     "Mozilla/5.0 (Windows NT 6.0) AppleWebKit/536.5 (KHTML, like Gecko) Chrome/19.0.1084.36 Safari/536.5",
23     "Mozilla/5.0 (Windows NT 6.1; WOW64) AppleWebKit/536.3 (KHTML, like Gecko) Chrome/19.0.1063.0 Safari/536.3",
24     "Mozilla/5.0 (Windows NT 5.1) AppleWebKit/536.3 (KHTML, like Gecko) Chrome/19.0.1063.0 Safari/536.3",
25     "Mozilla/5.0 (Macintosh; Intel Mac OS X 10_8_0) AppleWebKit/536.3 (KHTML, like Gecko) Chrome/19.0.1063.0 Safari/536.3",
26     "Mozilla/5.0 (Windows NT 6.2) AppleWebKit/536.3 (KHTML, like Gecko) Chrome/19.0.1062.0 Safari/536.3",
27     "Mozilla/5.0 (Windows NT 6.1; WOW64) AppleWebKit/536.3 (KHTML, like Gecko) Chrome/19.0.1062.0 Safari/536.3",
28     "Mozilla/5.0 (Windows NT 6.2) AppleWebKit/536.3 (KHTML, like Gecko) Chrome/19.0.1061.1 Safari/536.3",
29     "Mozilla/5.0 (Windows NT 6.1; WOW64) AppleWebKit/536.3 (KHTML, like Gecko) Chrome/19.0.1061.1 Safari/536.3",
30     "Mozilla/5.0 (Windows NT 6.1) AppleWebKit/536.3 (KHTML, like Gecko) Chrome/19.0.1061.1 Safari/536.3",
31     "Mozilla/5.0 (Windows NT 6.2) AppleWebKit/536.3 (KHTML, like Gecko) Chrome/19.0.1061.0 Safari/536.3",
32     "Mozilla/5.0 (X11; Linux x86_64) AppleWebKit/535.24 (KHTML, like Gecko) Chrome/19.0.1055.1 Safari/535.24",
33     "Mozilla/5.0 (Windows NT 6.2; WOW64) AppleWebKit/535.24 (KHTML, like Gecko) Chrome/19.0.1055.1 Safari/535.24"
34     ]
35     UserAgent = random.choice(user_agent_list)
36     headers = {‘User-Agent‘: UserAgent}
37     response = requests.get(url, headers=headers)
38     time.sleep(3)
39     html_str = response.content.decode()
40     html = etree.HTML(html_str)
41     #print(html)
42     content_list=html.xpath(‘//ul[@class="pub-list renwu"]//li‘)
43     #print(content_list)
44     for content in content_list:
45         item={}
46         a=content.xpath(‘.//a[@target="_blank"]/text()‘)[0]
47         x=content.xpath(‘./span[@class="s3"]/text()‘)
48         c= content.xpath(‘.//i/text()‘)
49         item[‘名字‘]=‘‘.join(a)
50         item[‘热搜指数‘]=‘‘.join(x)
51         item[‘排名‘]= ‘‘.join(c)
52         print(a)
53         cha_list.append(item)
54 df = pd.DataFrame(cha_list)
55 df.to_excel(r‘搜狗热搜综艺榜.xlsx‘)
结果如下:
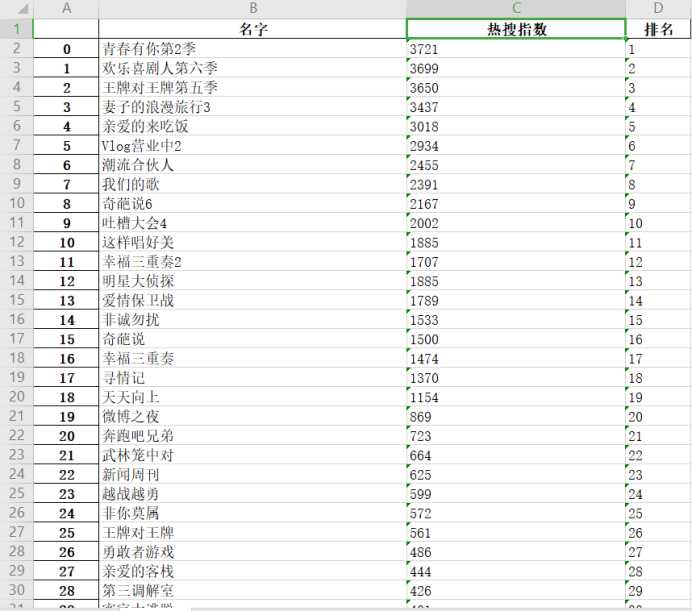
打开保存的文件

搜索“搜狗热搜综艺榜”,鼠标静置可以看到该文件的位置
点击该文件后,可得如下图
2.对数据进行清洗和处理
对于爬虫程序采集得到的数据并不能直接分析,需要先去掉一些“脏”数据,修正一些错误数据,统一所有数据字段的格式,将这些零散的数据规整成统一的结构化数据。
主要需要清洗的数据部分如下:
1)去除一些不必要的信息
2)清洗一些数据项格式
 1 df_li = cha_list
 2 all_lists = []
 3 for s_li in df_li:
 4     all_lists.append(s_li["热搜指数"])
 5 # 横轴标签
 6 keys = ["0-500","500-1000","1000-1500","1500-2000",‘2000-2500‘,‘2500-3000‘,‘3000以上‘]
 7 # 创建空词典
 8 results = {}
 9 for key in keys:
10     results.update({key:[]})
11 # 将数据存储到词典
12 for i in all_lists:
13     if int(i) >= 0 and int(i) <= 500:
14         results[keys[0]].append(i)
15     elif int(i) >= 500and int(i) <= 1000:
16         results[keys[1]].append(i)
17     elif int(i) >= 1000and int(i) <= 1500:
18         results[keys[2]].append(i)
19     elif int(i) >= 1500and int(i) <= 2000:
20         results[keys[3]].append(i)
21     elif int(i) >= 2000and int(i) <= 2500:
22         results[keys[4]].append(i)
23     elif int(i) >= 2500and int(i) <= 3000:
24         results[keys[5]].append(i)
25     elif int(i) >=3000:
26         results[keys[6]].append(i)
27 rate1 = []
28 print(df_li)
数据清洗结果
3.数据分析与可视化
在数据清洗完成后,我们就可以开始对数据进行可视化分析。该阶段主要是对数据做一个探索性分析并将结果可视化呈现,帮助人们更好、更直观的认识数据,把隐藏在大量数据背后的信息集中和提炼出来。
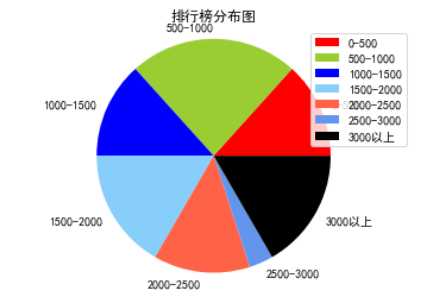
(1)分布图
 1 import matplotlib.pyplot as plt
 2 import pandas as pd
 3 #解决中文显示问题
 4 plt.rcParams[‘font.sans-serif‘] = [‘SimHei‘] # 指定默认字体
 5 plt.rcParams[‘axes.unicode_minus‘] = False # 解决保存图像是负号‘-‘显示为方块的问题
 6 # 读取excel数据
 7 data = pd.read_excel(r"C:\Users\F8633\搜狗热搜综艺榜.xlsx",encoding=‘gbk‘)
 8 # 转化列表
 9 df_li = data[‘热搜指数‘]
10 # 转化列表
11 all_lists = []
12 for s_li in df_li:
13     all_lists.append(s_li)
14 # 横轴标签
15 keys = ["0-500","500-1000","1000-1500","1500-2000",‘2000-2500‘,‘2500-3000‘,‘3000以上‘]
16 # 创建空词典
17 results = {}
18 for key in keys:
19     results.update({key:[]})
20 a=0
21 b=0
22 c=0
23 d=0
24 e=0
25 f=0
26 g=0
27 # 将数据存储到词典
28 for i in all_lists:
29     if int(i) >= 0 and int(i) <= 500:
30         a = a + 1
31     elif int(i) >= 500 and int(i) <= 1000:
32         b = b + 1
33     elif int(i) >=1000 and int(i) <= 1500:
34         c = c + 1
35     elif int(i) >= 1500 and int(i) <= 2000:
36         d = d + 1
37     elif int(i) >= 2000 and int(i) <= 2500:
38         e = e+ 1
39     elif int(i) >= 2500 and int(i) <= 3000:
40         f = f+ 1
41     elif int(i) >= 3000:
42         g = g+ 1
43 results[keys[0]].append(a)
44 results[keys[1]].append(b)
45 results[keys[2]].append(c)
46 results[keys[3]].append(d)
47 results[keys[4]].append(e)
48 results[keys[5]].append(f)
49 results[keys[6]].append(g)
50 # 分布图标题
51 plt.title(‘排行榜分布图‘)
52 # 分布图颜色
53 colors = [‘red‘,‘yellowgreen‘,‘blue‘,‘lightskyblue‘,‘tomato‘,‘cornflowerblue‘,‘black‘]
54 # 分布图
55 plt.pie(results.values(),labels=results.keys(),colors=colors)
56 # 分布图右侧标签
57 plt.legend(loc=‘upper right‘)
58 # 分布图
59 plt.axis(‘equal‘)
60 plt.savefig("Pie_chart.png",right=0.7)
61 plt.show()
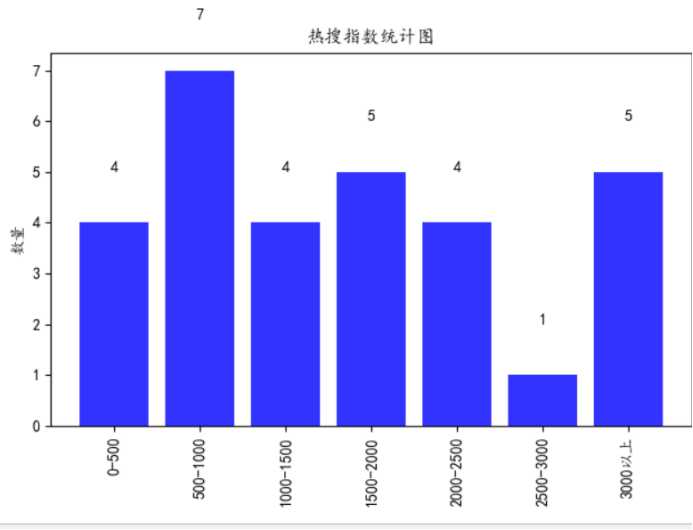
(2)柱形图(直方图)
 1 import pandas as pd
 2 import matplotlib.pyplot as plt
 3 #解决中文显示问题
 4 plt.rcParams[‘font.sans-serif‘] = [‘SimHei‘] # 指定默认字体
 5 plt.rcParams[‘axes.unicode_minus‘] = False # 解决保存图像是负号‘-‘显示为方块的问题
 6 # 读取excel数据
 7 data = pd.read_excel(r"C:\Users\F8633\搜狗热搜综艺榜.xlsx",encoding=‘gbk‘)
 8 # 转化列表
 9 df_li = data.values.tolist()
10 # 转化列表
11 all_lists = []
12 for s_li in df_li:
13     all_lists.append(s_li[2])
14 # 横轴标签
15 keys = ["0-500","500-1000","1000-1500","1500-2000",‘2000-2500‘,‘2500-3000‘,‘3000以上‘]
16 # 创建空词典
17 results = {}
18 for key in keys:
19     results.update({key:[]})
20 # 将数据存储到词典
21 for i in all_lists:
22     if int(i) >= 0 and int(i) <= 500:
23         results[keys[0]].append(i)
24     elif int(i) >= 500and int(i) <= 1000:
25         results[keys[1]].append(i)
26     elif int(i) >= 1000and int(i) <= 1500:
27         results[keys[2]].append(i)
28     elif int(i) >= 1500and int(i) <= 2000:
29         results[keys[3]].append(i)
30     elif int(i) >= 2000and int(i) <= 2500:
31         results[keys[4]].append(i)
32     elif int(i) >= 2500and int(i) <= 3000:
33         results[keys[5]].append(i)
34     elif int(i) >=3000:
35         results[keys[6]].append(i)
36 print(results)
37 # 统计面积的个数
38 for result in results:
39     results[result] = len(results[result])
40 # 柱形图(直方图)标题
41 plt.title(‘热搜指数统计图‘)
42 #构建数据
43 GDP=results.values()
44 print(GDP)
45 #绘图
46 plt.bar(range(len(GDP)),GDP, align=‘center‘,color=‘blue‘,alpha=0.8)
47 #添加轴标签
48 plt.ylabel(‘数量‘)
49 #添加刻度标签
50 plt.xticks(range(len(GDP)),results.keys())
51 # 横轴标签旋转90度
52 plt.xticks(rotation = 90)
53 #为每一个图形加数值标签
54 for x,y in enumerate(GDP):
55     plt.text(x,y+1,y,ha=‘center‘)
56 # 保存图像
57 plt.savefig(‘Bar_Graph.png‘)
58 #显示图形
59 plt.show()
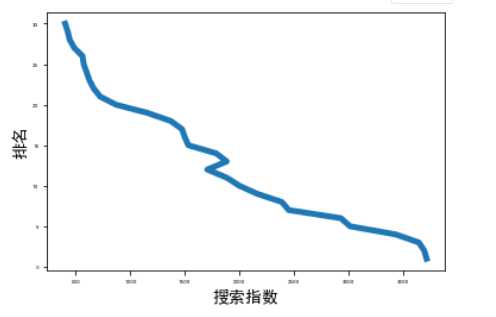
(3)曲线图
 1 import matplotlib.pyplot as plt
 2 import pandas as pd
 3 # 读取excel数据
 4 data = pd.read_excel(r"C:\Users\F8633\搜狗热搜综艺榜.xlsx",encoding=‘gbk‘)
 5 # 转化成列表
 6 df_li = data.values.tolist()
 7 rate1 = []
 8 #解决中文显示问题
 9 plt.rcParams[‘font.sans-serif‘] = [‘SimHei‘] # 指定默认字体
10 plt.rcParams[‘axes.unicode_minus‘] = False # 解决保存图像是负号‘-‘显示为方块的问题
11 for s_li in df_li:
12     rate1.append(s_li[2])
13 rate2 = []
14 for s_li in df_li:
15     rate2.append(s_li[3])
16 input_value = rate1
17 squares = rate2
18 plt.plot(input_value, squares, linewidth=5)
19 # 设置图表标题,并给坐标轴加标签
20 plt.xlabel("搜索指数", fontsize=14)
21 plt.ylabel("排名", fontsize=14)
22 # 设置刻度标记的大小
23 plt.tick_params(axis=‘both‘, labelsize=5)
24 # 展示图像
25 plt.show()
26 # 保存图片
27 plt.savefig("line_chart.png",right=0.7)
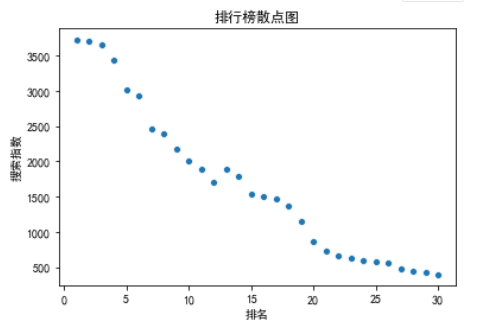
(4)散点图
 1 import matplotlib.pyplot as plt
 2 import numpy as np
 3 import pandas as pd
 4 import seaborn as sns
 5 #解决中文显示问题
 6 plt.rcParams[‘font.sans-serif‘] = [‘SimHei‘] # 指定默认字体
 7 plt.rcParams[‘axes.unicode_minus‘] = False # 解决保存图像是负号‘-‘显示为方块的问题
 8 # 读取excel数据
 9 data = pd.read_excel(r"C:\Users\F8633\搜狗热搜综艺榜.xlsx",encoding=‘gbk‘)
10 sns.scatterplot(x=data[‘排名‘], y=data[‘热搜指数‘])
11 plt.title(‘排行榜散点图‘)
12 plt.xlabel(‘排名‘)
13 plt.ylabel(‘搜索指数‘)
14 plt.show()
15 plt.savefig("Scatter.png",right=0.7)
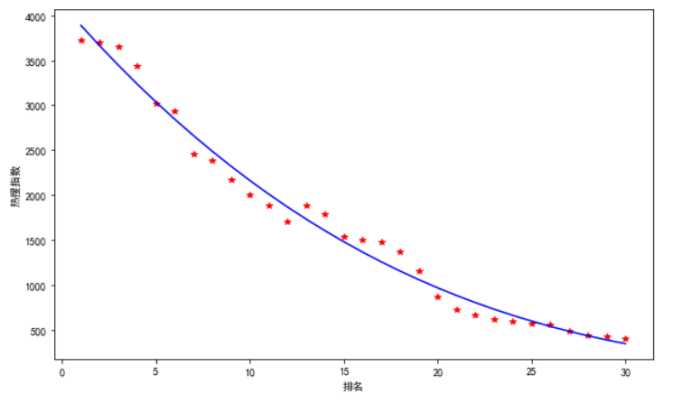
4.线性回归方程图
 1 import matplotlib.pyplot as plt
 2 import numpy as np
 3 import pandas as pd
 4 import seaborn as sns
 5 #解决中文显示问题
 6 plt.rcParams[‘font.sans-serif‘] = [‘SimHei‘] # 指定默认字体
 7 plt.rcParams[‘axes.unicode_minus‘] = False # 解决保存图像是负号‘-‘显示为方块的问题
 8 # 读取excel数据
 9 data = pd.read_excel(r"C:\Users\F8633\搜狗热搜综艺榜.xlsx",encoding=‘gbk‘)
10 y1 =data[‘热搜指数‘]
11 x1 =data[‘排名‘]
12 plt.figure(figsize=(10, 6))#设置大小
13 z=np.polyfit(x1,y1,3)#三次多项式拟合
14 p=np.poly1d(z)
15 yvals=p(x1)#拟合后的y值
16 plt.xlabel(‘排名‘)
17 plt.ylabel(‘热搜指数‘)
18 plot1=plt.plot(x1,y1,‘r*‘,label=‘original values‘)
19 plot2=plt.plot(x1,yvals,‘b‘,label=‘original values‘)
5.代码汇总
  1 import requests#在代码的最后命名保存的文件的名称
  2 import pandas as pd
  3 from lxml import etree
  4 import time
  5 import random
  6 import matplotlib.pyplot as plt
  7 import numpy as np
  8 import seaborn as sns
  9 cha_list=[]
 10 for i in range(1,4):#新香洲的房间信息一共有44页,我们把44+1=45,相当于循环44次,
 11     #如果有57页,只需要把数字改成58
 12     url = ‘http://top.sogou.com/tvshow/all_‘ + str(i)+‘.html‘
 13     #如果我们爬取的是香洲区下的新香洲,新香洲的网址是https://zh.lianjia.com/ershoufang/xinxiangzhou/rs珠海/
 14     #只需要在后面加pg就可以了,具体可以参照上面的url
 15     print(url)
 16     user_agent_list= [
 17     "Mozilla/5.0 (Windows NT 6.1; WOW64) AppleWebKit/537.1 (KHTML, like Gecko) Chrome/22.0.1207.1 Safari/537.1",
 18     "Mozilla/5.0 (X11; CrOS i686 2268.111.0) AppleWebKit/536.11 (KHTML, like Gecko) Chrome/20.0.1132.57 Safari/536.11",
 19     "Mozilla/5.0 (Windows NT 6.1; WOW64) AppleWebKit/536.6 (KHTML, like Gecko) Chrome/20.0.1092.0 Safari/536.6",
 20     "Mozilla/5.0 (Windows NT 6.2) AppleWebKit/536.6 (KHTML, like Gecko) Chrome/20.0.1090.0 Safari/536.6",
 21     "Mozilla/5.0 (Windows NT 6.2; WOW64) AppleWebKit/537.1 (KHTML, like Gecko) Chrome/19.77.34.5 Safari/537.1",
 22     "Mozilla/5.0 (X11; Linux x86_64) AppleWebKit/536.5 (KHTML, like Gecko) Chrome/19.0.1084.9 Safari/536.5",
 23     "Mozilla/5.0 (Windows NT 6.0) AppleWebKit/536.5 (KHTML, like Gecko) Chrome/19.0.1084.36 Safari/536.5",
 24     "Mozilla/5.0 (Windows NT 6.1; WOW64) AppleWebKit/536.3 (KHTML, like Gecko) Chrome/19.0.1063.0 Safari/536.3",
 25     "Mozilla/5.0 (Windows NT 5.1) AppleWebKit/536.3 (KHTML, like Gecko) Chrome/19.0.1063.0 Safari/536.3",
 26     "Mozilla/5.0 (Macintosh; Intel Mac OS X 10_8_0) AppleWebKit/536.3 (KHTML, like Gecko) Chrome/19.0.1063.0 Safari/536.3",
 27     "Mozilla/5.0 (Windows NT 6.2) AppleWebKit/536.3 (KHTML, like Gecko) Chrome/19.0.1062.0 Safari/536.3",
 28     "Mozilla/5.0 (Windows NT 6.1; WOW64) AppleWebKit/536.3 (KHTML, like Gecko) Chrome/19.0.1062.0 Safari/536.3",
 29     "Mozilla/5.0 (Windows NT 6.2) AppleWebKit/536.3 (KHTML, like Gecko) Chrome/19.0.1061.1 Safari/536.3",
 30     "Mozilla/5.0 (Windows NT 6.1; WOW64) AppleWebKit/536.3 (KHTML, like Gecko) Chrome/19.0.1061.1 Safari/536.3",
 31     "Mozilla/5.0 (Windows NT 6.1) AppleWebKit/536.3 (KHTML, like Gecko) Chrome/19.0.1061.1 Safari/536.3",
 32     "Mozilla/5.0 (Windows NT 6.2) AppleWebKit/536.3 (KHTML, like Gecko) Chrome/19.0.1061.0 Safari/536.3",
 33     "Mozilla/5.0 (X11; Linux x86_64) AppleWebKit/535.24 (KHTML, like Gecko) Chrome/19.0.1055.1 Safari/535.24",
 34     "Mozilla/5.0 (Windows NT 6.2; WOW64) AppleWebKit/535.24 (KHTML, like Gecko) Chrome/19.0.1055.1 Safari/535.24"
 35     ]
 36     UserAgent = random.choice(user_agent_list)
 37     headers = {‘User-Agent‘: UserAgent}
 38     response = requests.get(url, headers=headers)
 39     time.sleep(3)
 40     html_str = response.content.decode()
 41     html = etree.HTML(html_str)
 42     #print(html)
 43     content_list=html.xpath(‘//ul[@class="pub-list renwu"]//li‘)
 44     #print(content_list)
 45     for content in content_list:
 46         item={}
 47         a=content.xpath(‘.//a[@target="_blank"]/text()‘)[0]
 48         x=content.xpath(‘./span[@class="s3"]/text()‘)
 49         c= content.xpath(‘.//i/text()‘)
 50         item[‘名字‘]=‘‘.join(a)
 51         item[‘热搜指数‘]=‘‘.join(x)
 52         item[‘排名‘]= ‘‘.join(c)
 53         print(a)
 54         cha_list.append(item)
 55 df = pd.DataFrame(cha_list)
 56 df.to_excel(r‘搜狗热搜综艺榜.xlsx‘)
 57 df_li = cha_list
 58 all_lists = []
 59 for s_li in df_li:
 60     all_lists.append(s_li["热搜指数"])
 61 # 横轴标签
 62 keys = ["0-500","500-1000","1000-1500","1500-2000",‘2000-2500‘,‘2500-3000‘,‘3000以上‘]
 63 # 创建空词典
 64 results = {}
 65 for key in keys:
 66     results.update({key:[]})
 67 # 将数据存储到词典
 68 for i in all_lists:
 69     if int(i) >= 0 and int(i) <= 500:
 70         results[keys[0]].append(i)
 71     elif int(i) >= 500and int(i) <= 1000:
 72         results[keys[1]].append(i)
 73     elif int(i) >= 1000and int(i) <= 1500:
 74         results[keys[2]].append(i)
 75     elif int(i) >= 1500and int(i) <= 2000:
 76         results[keys[3]].append(i)
 77     elif int(i) >= 2000and int(i) <= 2500:
 78         results[keys[4]].append(i)
 79     elif int(i) >= 2500and int(i) <= 3000:
 80         results[keys[5]].append(i)
 81     elif int(i) >=3000:
 82         results[keys[6]].append(i)
 83 rate1 = []
 84 print(df_li)
 85 #分布图
 86 #解决中文显示问题
 87 plt.rcParams[‘font.sans-serif‘] = [‘SimHei‘] # 指定默认字体
 88 plt.rcParams[‘axes.unicode_minus‘] = False # 解决保存图像是负号‘-‘显示为方块的问题
 89 # 读取excel数据
 90 data = pd.read_excel(r"C:\Users\F8633\搜狗热搜综艺榜.xlsx",encoding=‘gbk‘)
 91 # 转化列表
 92 df_li = data[‘热搜指数‘]
 93 # 转化列表
 94 all_lists = []
 95 for s_li in df_li:
 96     all_lists.append(s_li)
 97 # 横轴标签
 98 keys = ["0-500","500-1000","1000-1500","1500-2000",‘2000-2500‘,‘2500-3000‘,‘3000以上‘]
 99 # 创建空词典
100 results = {}
101 for key in keys:
102     results.update({key:[]})
103 a=0
104 b=0
105 c=0
106 d=0
107 e=0
108 f=0
109 g=0
110 # 将数据存储到词典
111 for i in all_lists:
112     if int(i) >= 0 and int(i) <= 500:
113         a = a + 1
114     elif int(i) >= 500 and int(i) <= 1000:
115         b = b + 1
116     elif int(i) >=1000 and int(i) <= 1500:
117         c = c + 1
118     elif int(i) >= 1500 and int(i) <= 2000:
119         d = d + 1
120     elif int(i) >= 2000 and int(i) <= 2500:
121         e = e+ 1
122     elif int(i) >= 2500 and int(i) <= 3000:
123         f = f+ 1
124     elif int(i) >= 3000:
125         g = g+ 1
126 results[keys[0]].append(a)
127 results[keys[1]].append(b)
128 results[keys[2]].append(c)
129 results[keys[3]].append(d)
130 results[keys[4]].append(e)
131 results[keys[5]].append(f)
132 results[keys[6]].append(g)
133 # 分布图标题
134 plt.title(‘排行榜分布图‘)
135 # 分布图颜色
136 colors = [‘red‘,‘yellowgreen‘,‘blue‘,‘lightskyblue‘,‘tomato‘,‘cornflowerblue‘,‘black‘]
137 # 分布图
138 plt.pie(results.values(),labels=results.keys(),colors=colors)
139 # 分布图右侧标签
140 plt.legend(loc=‘upper right‘)
141 # 分布图
142 plt.axis(‘equal‘)
143 plt.savefig("Pie_chart.png",right=0.7)
144 plt.show()
145 #柱形图(直方图)
146 #解决中文显示问题
147 plt.rcParams[‘font.sans-serif‘] = [‘SimHei‘] # 指定默认字体
148 plt.rcParams[‘axes.unicode_minus‘] = False # 解决保存图像是负号‘-‘显示为方块的问题
149 # 读取excel数据
150 data = pd.read_excel(r"C:\Users\F8633\搜狗热搜综艺榜.xlsx",encoding=‘gbk‘)
151 # 转化列表
152 df_li = data.values.tolist()
153 # 转化列表
154 all_lists = []
155 for s_li in df_li:
156     all_lists.append(s_li[2])
157 # 横轴标签
158 keys = ["0-500","500-1000","1000-1500","1500-2000",‘2000-2500‘,‘2500-3000‘,‘3000以上‘]
159 # 创建空词典
160 results = {}
161 for key in keys:
162     results.update({key:[]})
163 # 将数据存储到词典
164 for i in all_lists:
165     if int(i) >= 0 and int(i) <= 500:
166         results[keys[0]].append(i)
167     elif int(i) >= 500and int(i) <= 1000:
168         results[keys[1]].append(i)
169     elif int(i) >= 1000and int(i) <= 1500:
170         results[keys[2]].append(i)
171     elif int(i) >= 1500and int(i) <= 2000:
172         results[keys[3]].append(i)
173     elif int(i) >= 2000and int(i) <= 2500:
174         results[keys[4]].append(i)
175     elif int(i) >= 2500and int(i) <= 3000:
176         results[keys[5]].append(i)
177     elif int(i) >=3000:
178         results[keys[6]].append(i)
179 print(results)
180 # 统计面积的个数
181 for result in results:
182     results[result] = len(results[result])
183 # 柱形图(直方图)标题
184 plt.title(‘热搜指数统计图‘)
185 #构建数据
186 GDP=results.values()
187 print(GDP)
188 #绘图
189 plt.bar(range(len(GDP)),GDP, align=‘center‘,color=‘blue‘,alpha=0.8)
190 #添加轴标签
191 plt.ylabel(‘数量‘)
192 #添加刻度标签
193 plt.xticks(range(len(GDP)),results.keys())
194 # 横轴标签旋转90度
195 plt.xticks(rotation = 90)
196 #为每一个图形加数值标签
197 for x,y in enumerate(GDP):
198     plt.text(x,y+1,y,ha=‘center‘)
199 # 保存图像
200 plt.savefig(‘Bar_Graph.png‘)
201 #显示图形
202 plt.show()
203 #曲线图
204 # 读取excel数据
205 data = pd.read_excel(r"C:\Users\F8633\搜狗热搜综艺榜.xlsx",encoding=‘gbk‘)
206 # 转化成列表
207 df_li = data.values.tolist()
208 rate1 = []
209 #解决中文显示问题
210 plt.rcParams[‘font.sans-serif‘] = [‘SimHei‘] # 指定默认字体
211 plt.rcParams[‘axes.unicode_minus‘] = False # 解决保存图像是负号‘-‘显示为方块的问题
212 for s_li in df_li:
213     rate1.append(s_li[2])
214 rate2 = []
215 for s_li in df_li:
216     rate2.append(s_li[3])
217 input_value = rate1
218 squares = rate2
219 plt.plot(input_value, squares, linewidth=5)
220 # 设置图表标题,并给坐标轴加标签
221 plt.xlabel("搜索指数", fontsize=14)
222 plt.ylabel("排名", fontsize=14)
223 # 设置刻度标记的大小
224 plt.tick_params(axis=‘both‘, labelsize=5)
225 # 展示图像
226 plt.show()
227 # 保存图片
228 plt.savefig("line_chart.png",right=0.7)
229 #散点图
230 #解决中文显示问题
231 plt.rcParams[‘font.sans-serif‘] = [‘SimHei‘] # 指定默认字体
232 plt.rcParams[‘axes.unicode_minus‘] = False # 解决保存图像是负号‘-‘显示为方块的问题
233 # 读取excel数据
234 data = pd.read_excel(r"C:\Users\F8633\搜狗热搜综艺榜.xlsx",encoding=‘gbk‘)
235 sns.scatterplot(x=data[‘排名‘], y=data[‘热搜指数‘])
236 plt.title(‘排行榜散点图‘)
237 plt.xlabel(‘排名‘)
238 plt.ylabel(‘搜索指数‘)
239 plt.show()
240 plt.savefig("Scatter.png",right=0.7)
241 #线性回归方程图
242 #解决中文显示问题
243 plt.rcParams[‘font.sans-serif‘] = [‘SimHei‘] # 指定默认字体
244 plt.rcParams[‘axes.unicode_minus‘] = False # 解决保存图像是负号‘-‘显示为方块的问题
245 # 读取excel数据
246 data = pd.read_excel(r"C:\Users\F8633\搜狗热搜综艺榜.xlsx",encoding=‘gbk‘)
247 y1 =data[‘热搜指数‘]
248 x1 =data[‘排名‘]
249 plt.figure(figsize=(10, 6))#设置大小
250 z=np.polyfit(x1,y1,3)#三次多项式拟合
251 p=np.poly1d(z)
252 yvals=p(x1)#拟合后的y值
253 plt.xlabel(‘排名‘)
254 plt.ylabel(‘热搜指数‘)
255 plot1=plt.plot(x1,y1,‘r*‘,label=‘original values‘)
256 plot2=plt.plot(x1,yvals,‘b‘,label=‘original values‘)
四.结论
1.通过对搜狗热搜旁的数据分析及可视化,我们可以发现排名与热搜指数之前的关系趋于直线,说明二者之间存在线性关系。
2.通过这次的爬虫情况让对数据采集多了新的思路,并且对可视化的重要性有了进一步的了解,在这次任务中可以扩展我们数据分析的思维,以及对数据的不同角度的分析,对数据分析有了更深一层的理解,但也有不足之处,由于水平有限,代码太过于冗杂,可以省略重复的代码,精简一点,所以还有上升空间。
标签:变换 user 了解 requests 转化 web ica tick 线性回归
原文地址:https://www.cnblogs.com/f-jp/p/12737775.html