标签:软件 eth lis 一个 memcach 各类 alert gate 中心
prometheus入门(一)官方站点: https://prometheus.io
官方架构图: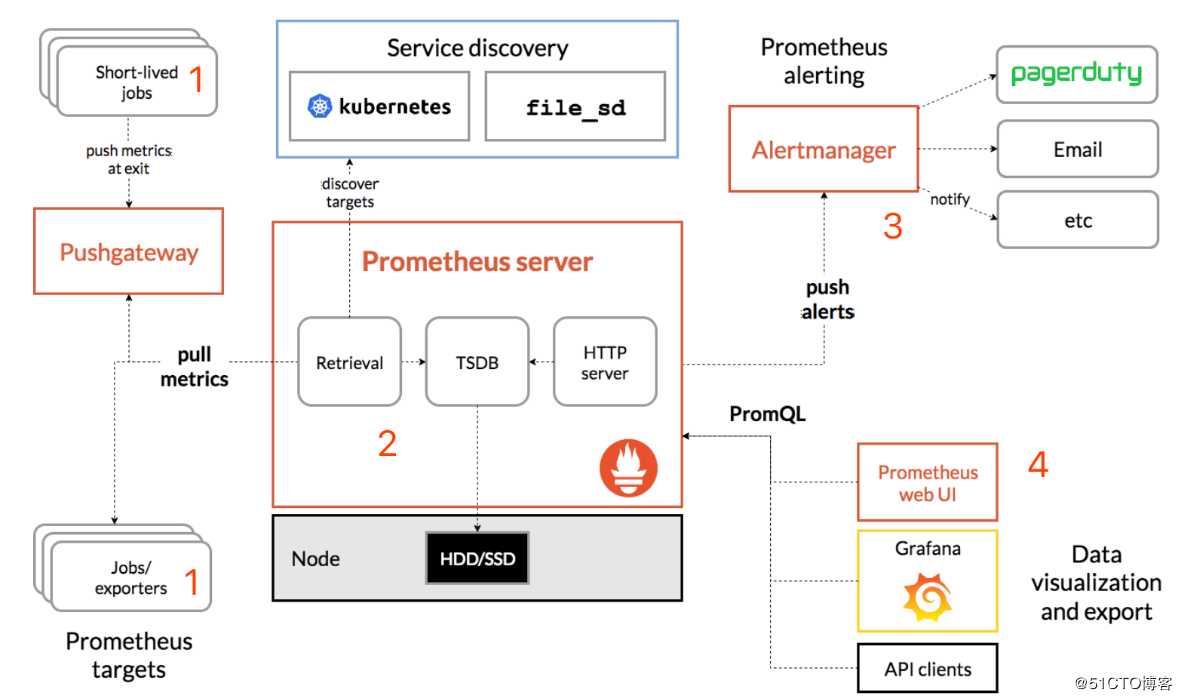
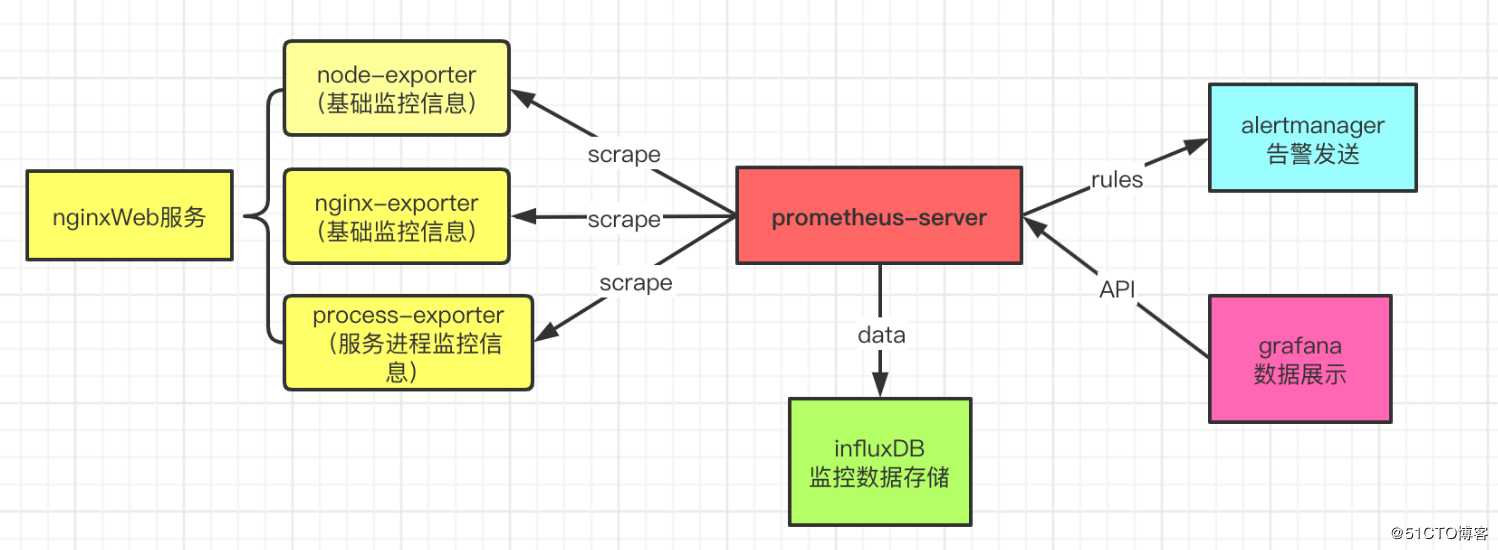
相对核心的组件:
注意事项:
> wget https://github.com/prometheus/prometheus/releases/download/v2.18.1/prometheus-2.18.1.linux-amd64.tar.gz
> tar xf prometheus-2.18.1.linux-amd64.tar.gz
> mv prometheus-2.18.1.linux-amd64/* /usr/local/bin/
------------写入启动文件
> cat /etc/systemd/system/prometheus.service
[Unit]
Description=Prometheus Monitoring System
Documentation=Prometheus Monitoring System

[Service]
ExecStart=/usr/local/bin/prometheus   --config.file=/etc/prometheus/prometheus.yml   --web.listen-address=:9090

[Install]
WantedBy=multi-user.target
-------准备配置文件
> cat /etc/prometheus/prometheus.yml
global:
  scrape_interval:     15s # Set the scrape interval to every 15 seconds. Default is every 1 minute.
  evaluation_interval: 15s # Evaluate rules every 15 seconds. The default is every 1 minute.
# Alertmanager configuration
alerting:
  alertmanagers:
  - static_configs:
    - targets:
      # - alertmanager:9093
rule_files:
  # - "first_rules.yml"
  # - "second_rules.yml"
scrape_configs:
  - job_name: ‘prometheus‘
    static_configs:
- targets: [‘localhost:9090‘]> promtool check config /etc/prometheus/prometheus.yml # 检测配置文件正确性
> systemctl enable prometheus && systemctl start prometheus #服务启动与开机自启动标签:软件 eth lis 一个 memcach 各类 alert gate 中心
原文地址:https://blog.51cto.com/13812615/2494500