标签:变形 scale function else red col log 数值 end
先放成熟的平行坐标图绘制网址:https://www.r-graph-gallery.com/parallel-plot.html
library(ggplot2)
library(tidyr)#数据变形包
pcp_data<-function(df){
is_numeric<-vapply(df,is.numeric,logical(1))#筛选出数值列
rescale01<-function(x){
rng<-range(x,na.rm=TRUE)
(x-rng[1])/(rng[2]-rng[1])
}#将数值列归一化到[0,1]区间
df[is_numeric]<-lapply(df[is_numeric],rescale01)
df$.row<-rownames(df)
tidyr::gather_(df,"variable","value",names(df)[is_numeric])#数据变形
}
pcp<-function(df,...){
df<-pcp_data(df)
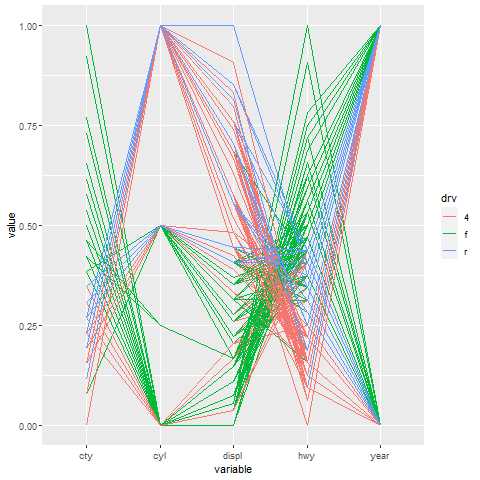
ggplot(df,aes(variable,value,group=.row))+geom_line(...)
}
pcp(mpg,aes(colour=drv))
图形如下:
library(ggplot2)
rescale01<-function(x){
      rng<-range(x,na.rm=TRUE)
      (x-rng[1])/(rng[2]-rng[1])
}
df<-mpg
df$col<-ifelse(df$drv=="4","red",ifelse(df$drv=="f","green","purple"))
is_numeric<-vapply(df,is.numeric,logical(1))
df[is_numeric]<-lapply(df[is_numeric],rescale01)
plot.new()
plot.window(xlim=c(0.8,7),ylim=c(0,1))
apply(df,1,function(x){lines(1:5,x[c("cty","cyl","displ","hwy","year")],col=x["col"])})
#平行坐标实际上每一条线就是一个观测,刚好用apply()函数对每行添加线条
legend(5.5,0.5,legend=c("4","f","r"),col=c("red","green","purple"),cex=1.5,lty=1,title="drv")
axis(1,at=1:5,labels=c("cty","cyl","displ","hwy","year"))
axis(2)
mtext(text="value",side=2,line=2,adj=0.5,cex=1.5)
mtext(text="variable",side=1,line=2,adj=0.5,cex=1.5)
abline(v=1:5,lty="dotted")
图形如下:
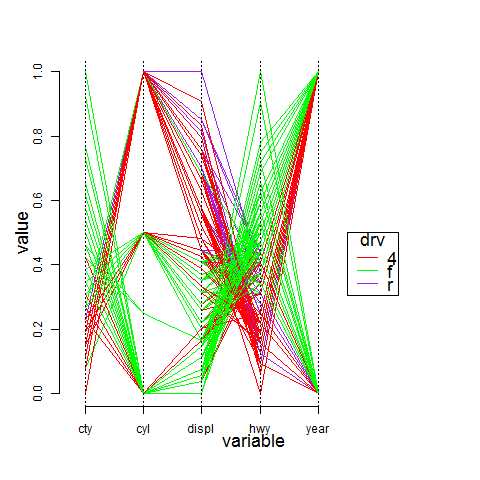
R仿图:base plot画平行坐标图,仿《ggplot2:数据分析与图形艺术》
标签:变形 scale function else red col log 数值 end
原文地址:https://www.cnblogs.com/Enjoy-Respect-9527/p/12905464.html