标签:service 设置 document 数据 com 启动 start file idf
这里介绍使用prometheus+grafana+node_exporter实现linux系统的监控。下面针对这三个组件进行具体的说明
这里我们基于centos7.5系统进行监控系统的部署。
这里我们可以在github上获取最新的版本:https://github.com/prometheus/prometheus
[root@monitor ~]# wget https://github.com/prometheus/prometheus/releases/download/v2.18.1/prometheus-2.18.1.linux-amd64.tar.gz
[root@monitor ~]# tar -xvf prometheus-2.18.1.linux-amd64.tar.gz
[root@monitor ~]# cp /root/prometheus-2.18.1.linux-amd64/{prometheus,promtool} /usr/local/bin/
[root@monitor ~]# mkdir -p /etc/prometheus && mkdir -p /var/lib/prometheus
[root@monitor ~]# vi /usr/lib/systemd/system/prometheus.service
[Unit]
Description=Prometheus: the monitoring system
Documentation=http://prometheus.io/docs/

[Service]
ExecStart=/usr/local/bin/prometheus --config.file=/etc/prometheus/prometheus.yml --storage.tsdb.path=/var/lib/prometheus
Restart=always
StartLimitInterval=0
RestartSec=10

[Install]
WantedBy=multi-user.target
[root@monitor ~]# cp -p /root/prometheus-2.18.1.linux-amd64/prometheus.yml /etc/prometheus
[root@monitor ~]# systemctl daemon-reload && systemctl restart prometheus
[root@monitor ~]# systemctl status prometheus
● prometheus.service - Prometheus: the monitoring system
   Loaded: loaded (/usr/lib/systemd/system/prometheus.service; disabled; vendor preset: disabled)
   Active: active (running) since Fri 2020-05-29 18:15:15 CST; 11s ago
     Docs: http://prometheus.io/docs/
 Main PID: 2726 (prometheus)
    Tasks: 8
   Memory: 16.5M
   CGroup: /system.slice/prometheus.service
           └─2726 /usr/local/bin/prometheus --config.file=/etc/prometheus/prometheus.yml --storage.tsdb.path=/var/lib/prometheus

May 29 18:15:15 monitor prometheus[2726]: level=info ts=2020-05-29T10:15:15.974Z caller=main.go:678 msg="Starting TSDB ..."
May 29 18:15:15 monitor prometheus[2726]: level=info ts=2020-05-29T10:15:15.975Z caller=web.go:523 component=web msg="Start listening for connections" address=0.0.0.0:9090
May 29 18:15:15 monitor prometheus[2726]: level=info ts=2020-05-29T10:15:15.988Z caller=head.go:575 component=tsdb msg="Replaying WAL, this may take awhile"
May 29 18:15:15 monitor prometheus[2726]: level=info ts=2020-05-29T10:15:15.988Z caller=head.go:624 component=tsdb msg="WAL segment loaded" segment=0 maxSegment=0
May 29 18:15:15 monitor prometheus[2726]: level=info ts=2020-05-29T10:15:15.988Z caller=head.go:627 component=tsdb msg="WAL replay completed" duration=582.4μs
May 29 18:15:15 monitor prometheus[2726]: level=info ts=2020-05-29T10:15:15.992Z caller=main.go:694 fs_type=XFS_SUPER_MAGIC
May 29 18:15:15 monitor prometheus[2726]: level=info ts=2020-05-29T10:15:15.992Z caller=main.go:695 msg="TSDB started"
May 29 18:15:15 monitor prometheus[2726]: level=info ts=2020-05-29T10:15:15.992Z caller=main.go:799 msg="Loading configuration file" filename=/etc/prometheus/prometheus.yml
May 29 18:15:16 monitor prometheus[2726]: level=info ts=2020-05-29T10:15:16.100Z caller=main.go:827 msg="Completed loading of configuration file" filename=/etc...etheus.yml
May 29 18:15:16 monitor prometheus[2726]: level=info ts=2020-05-29T10:15:16.100Z caller=main.go:646 msg="Server is ready to receive web requests."
Hint: Some lines were ellipsized, use -l to show in full.
[root@monitor ~]# wget https://dl.grafana.com/oss/release/grafana-6.0.2-1.x86_64.rpm
[root@monitor ~]# yum localinstall grafana-6.0.2-1.x86_64.rpm
[root@monitor ~]# systemctl daemon-reload && systemctl start grafana-server && systemctl enable grafana-server
[root@monitor ~]# systemctl status grafana-server
● grafana-server.service - Grafana instance
   Loaded: loaded (/usr/lib/systemd/system/grafana-server.service; enabled; vendor preset: disabled)
   Active: active (running) since Fri 2020-05-29 19:05:19 CST; 5s ago
     Docs: http://docs.grafana.org
 Main PID: 3628 (grafana-server)
   CGroup: /system.slice/grafana-server.service
           └─3628 /usr/sbin/grafana-server --config=/etc/grafana/grafana.ini --pidfile=/var/run/grafana/grafana-server.pid --packaging=rpm cfg:default.paths.logs=/var/lo...

May 29 19:05:19 monitor grafana-server[3628]: t=2020-05-29T19:05:19+0800 lvl=info msg="Initializing UsageStatsService" logger=server
May 29 19:05:19 monitor grafana-server[3628]: t=2020-05-29T19:05:19+0800 lvl=info msg="Initializing UserAuthTokenService" logger=server
May 29 19:05:19 monitor grafana-server[3628]: t=2020-05-29T19:05:19+0800 lvl=info msg="Initializing CleanUpService" logger=server
May 29 19:05:19 monitor grafana-server[3628]: t=2020-05-29T19:05:19+0800 lvl=info msg="Initializing NotificationService" logger=server
May 29 19:05:19 monitor grafana-server[3628]: t=2020-05-29T19:05:19+0800 lvl=info msg="Initializing ProvisioningService" logger=server
May 29 19:05:19 monitor grafana-server[3628]: t=2020-05-29T19:05:19+0800 lvl=info msg="Initializing TracingService" logger=server
May 29 19:05:19 monitor systemd[1]: Started Grafana instance.
May 29 19:05:19 monitor grafana-server[3628]: t=2020-05-29T19:05:19+0800 lvl=info msg="Initializing Stream Manager"
May 29 19:05:19 monitor grafana-server[3628]: t=2020-05-29T19:05:19+0800 lvl=info msg="HTTP Server Listen" logger=http.server address=0.0.0.0:3000 protocol=htt...l= socket=
May 29 19:05:19 monitor grafana-server[3628]: t=2020-05-29T19:05:19+0800 lvl=info msg="cleanup of expired auth tokens done" logger=auth count=0
Hint: Some lines were ellipsized, use -l to show in full.
下载地址:https://github.com/prometheus/node_exporter/releases
[root@monitor ~]# wget https://github.com/prometheus/node_exporter/releases/download/v0.18.1/node_exporter-0.18.1.linux-amd64.tar.gz
[root@monitor ~]# tar -xvf node_exporter-0.18.1.linux-amd64.tar.gz
[root@monitor ~]# mv /root/node_exporter-0.18.1.linux-amd64/node_exporter /usr/local/bin
[root@monitor ~]# vi /etc/systemd/system/node_exporter.service
[Unit]
Description=node_exporter
Documentation=https://prometheus.io/
After=network.target
[Service]
ExecStart=/usr/local/bin/node_exporter
Restart=on-failure
[Install]
WantedBy=multi-user.target
[root@monitor ~]# systemctl daemon-reload && systemctl restart node_exporter && systemctl enable node_exporter
# 查看node_exporter状态
[root@monitor ~]# systemctl status node_exporter
● node_exporter.service - node_exporter
   Loaded: loaded (/etc/systemd/system/node_exporter.service; enabled; vendor preset: disabled)
   Active: active (running) since Fri 2020-05-29 19:16:21 CST; 17s ago
     Docs: https://prometheus.io/
 Main PID: 3731 (node_exporter)
   CGroup: /system.slice/node_exporter.service
           └─3731 /usr/local/bin/node_exporter

May 29 19:16:21 monitor node_exporter[3731]: time="2020-05-29T19:16:21+08:00" level=info msg=" - sockstat" source="node_exporter.go:104"
May 29 19:16:21 monitor node_exporter[3731]: time="2020-05-29T19:16:21+08:00" level=info msg=" - stat" source="node_exporter.go:104"
May 29 19:16:21 monitor node_exporter[3731]: time="2020-05-29T19:16:21+08:00" level=info msg=" - textfile" source="node_exporter.go:104"
May 29 19:16:21 monitor node_exporter[3731]: time="2020-05-29T19:16:21+08:00" level=info msg=" - time" source="node_exporter.go:104"
May 29 19:16:21 monitor node_exporter[3731]: time="2020-05-29T19:16:21+08:00" level=info msg=" - timex" source="node_exporter.go:104"
May 29 19:16:21 monitor node_exporter[3731]: time="2020-05-29T19:16:21+08:00" level=info msg=" - uname" source="node_exporter.go:104"
May 29 19:16:21 monitor node_exporter[3731]: time="2020-05-29T19:16:21+08:00" level=info msg=" - vmstat" source="node_exporter.go:104"
May 29 19:16:21 monitor node_exporter[3731]: time="2020-05-29T19:16:21+08:00" level=info msg=" - xfs" source="node_exporter.go:104"
May 29 19:16:21 monitor node_exporter[3731]: time="2020-05-29T19:16:21+08:00" level=info msg=" - zfs" source="node_exporter.go:104"
May 29 19:16:21 monitor node_exporter[3731]: time="2020-05-29T19:16:21+08:00" level=info msg="Listening on :9100" source="node_exporter.go:170"
# 启动后,配置prometheus.yml
[root@monitor ~]# vi /etc/prometheus/prometheus.yml
scrape_configs:
  # The job name is added as a label `job=<job_name>` to any timeseries scraped from this config.
  - job_name: ‘prometheus‘

    # metrics_path defaults to ‘/metrics‘
    # scheme defaults to ‘http‘.

    static_configs:
    - targets: [‘localhost:9090‘]
  # 新增,采集node_exporter监控数据
  - job_name: "node info"
    static_configs:
    - targets: [‘192.168.2.92:9100‘]
# 重新启动prometheus
[root@monitor ~]# systemctl restart prometheus
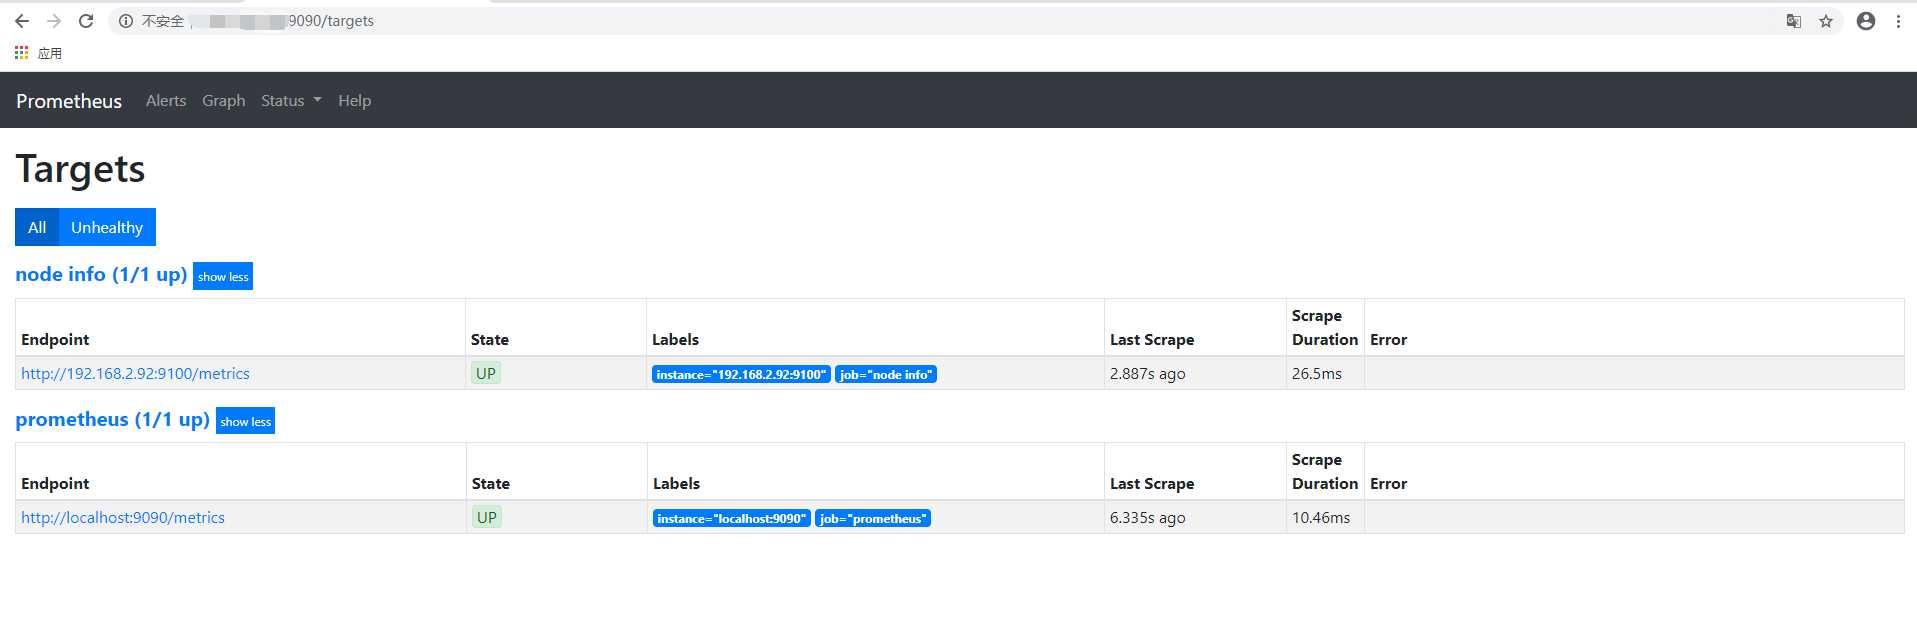
这里访问http://${IP}:9090,进入prometheus server,可以看到node info处于up状态,表示prometheus能正常从node_exporter获取数据:
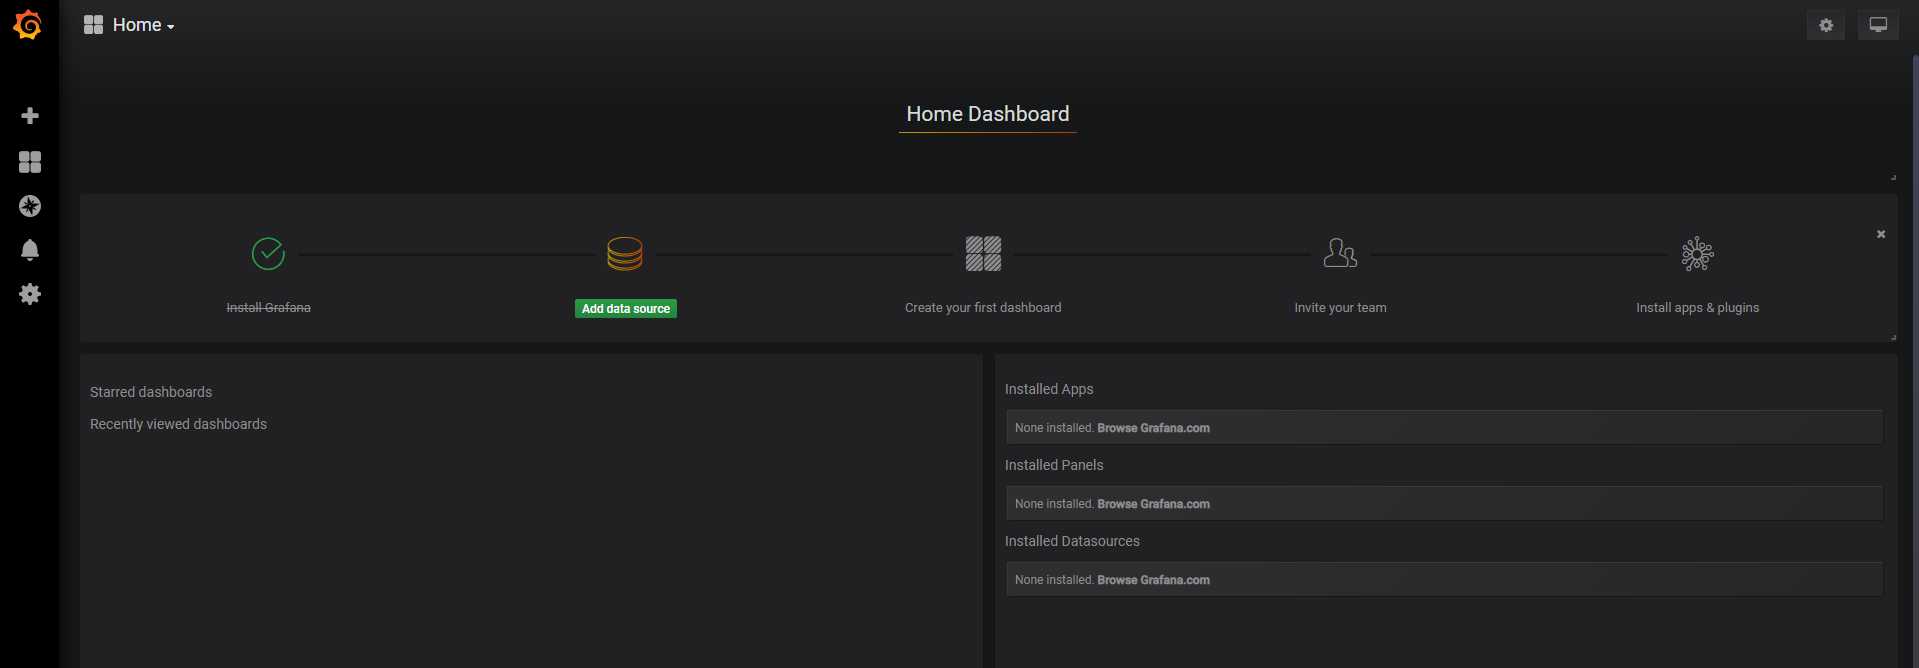
这里通过访问http://${IP}:3000,默认账户密码admin,admin进行登录:

在Grafana的首页中显示默认的使用向导,包括:安装、添加数据源、创建Dashboard、邀请成员、以及安装应用插件等:
这里添加prometheus作为默认的数据源,如下图所示,指定数据源的类型为prometheus并且设置prometheus的访问地址即可:
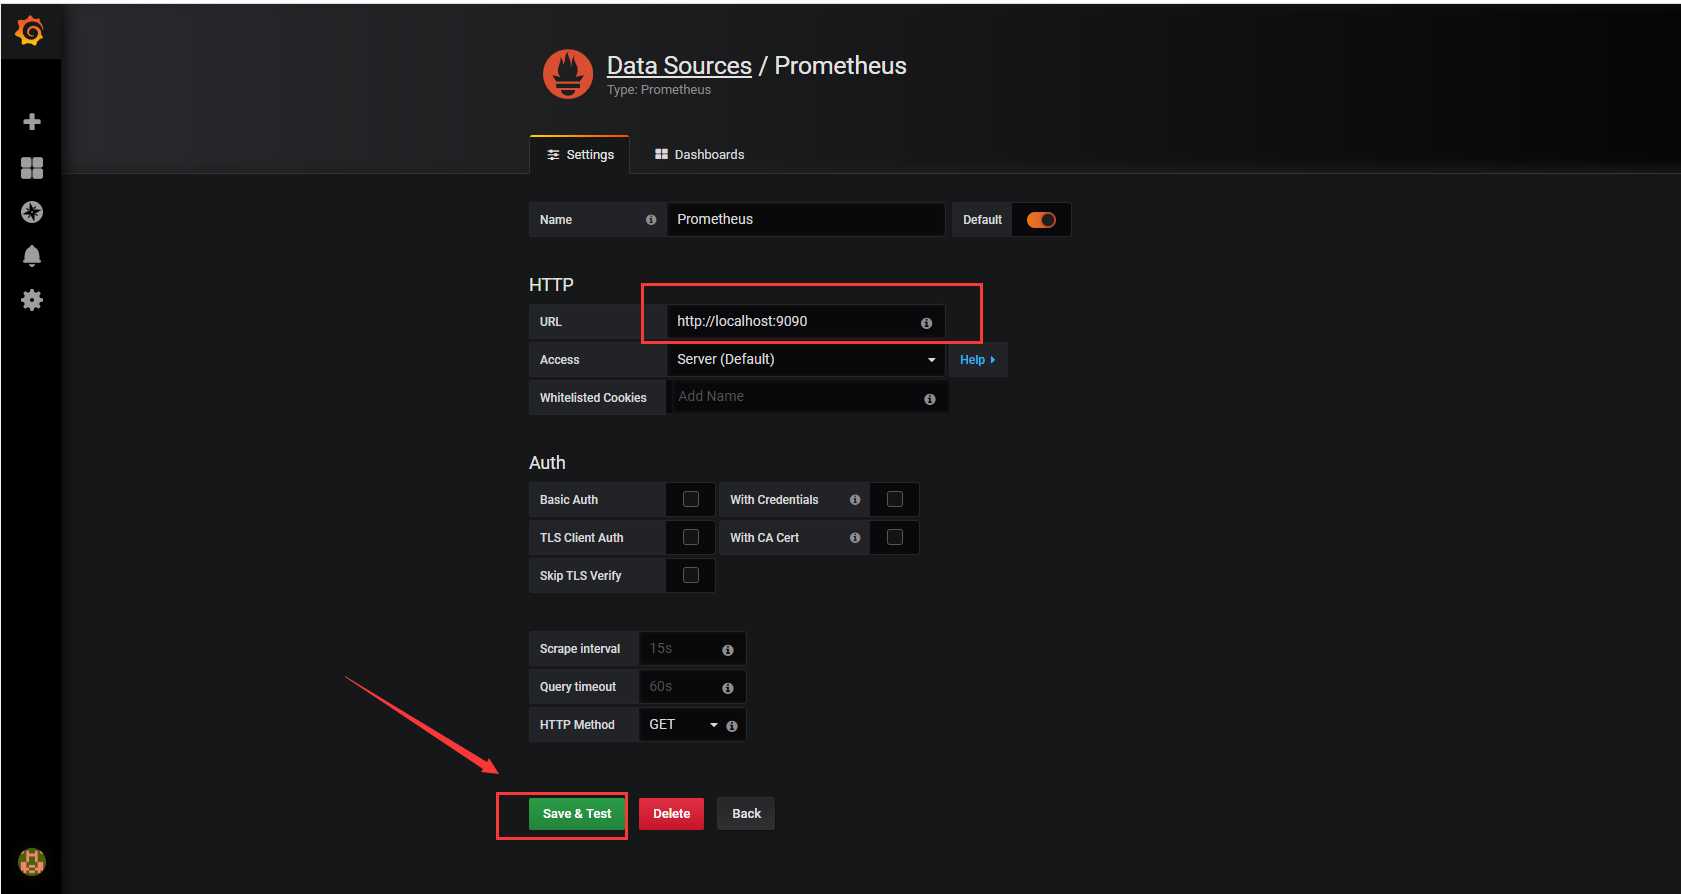
这里添加成功后,点击Save&Test如何连接成功会显示:Data source is working
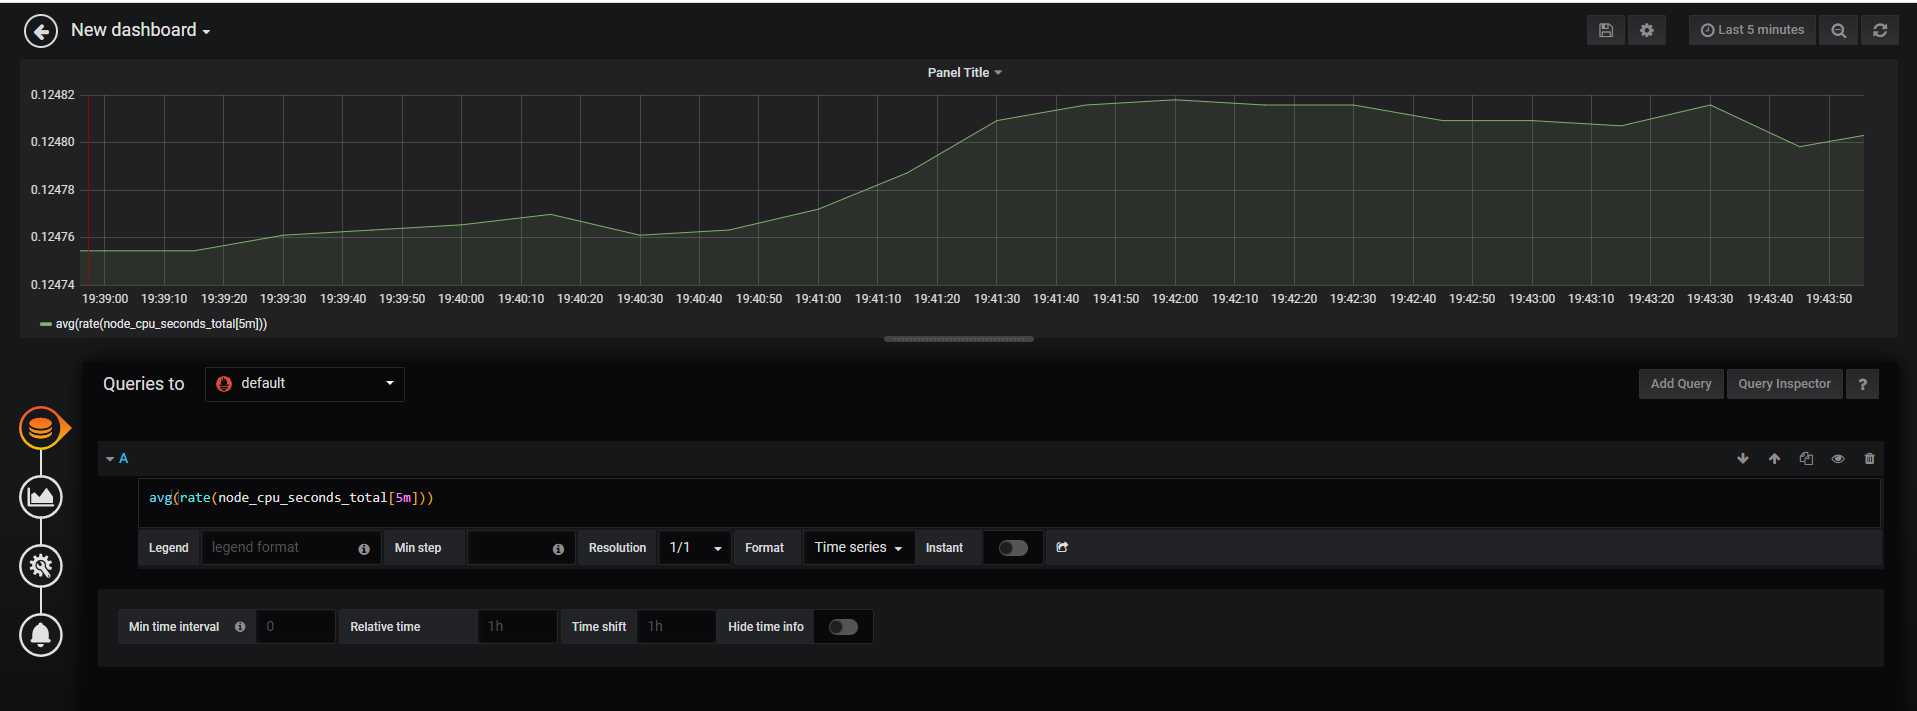
在完成数据源的添加之后,就可以在Grafana中创建我们可视化Dashboard了,Grafana提供了PromQL的完整支持。通过如下的方式可以通过Garafa添加一个"Graph"的面板,并在改面板的"Metrics"选项下通过PromQL查询需要可视化的数据:
这里,我们还可以通过Grafana官网添加我们喜欢的Dashboard:
地址:https://grafana.com/dashboards
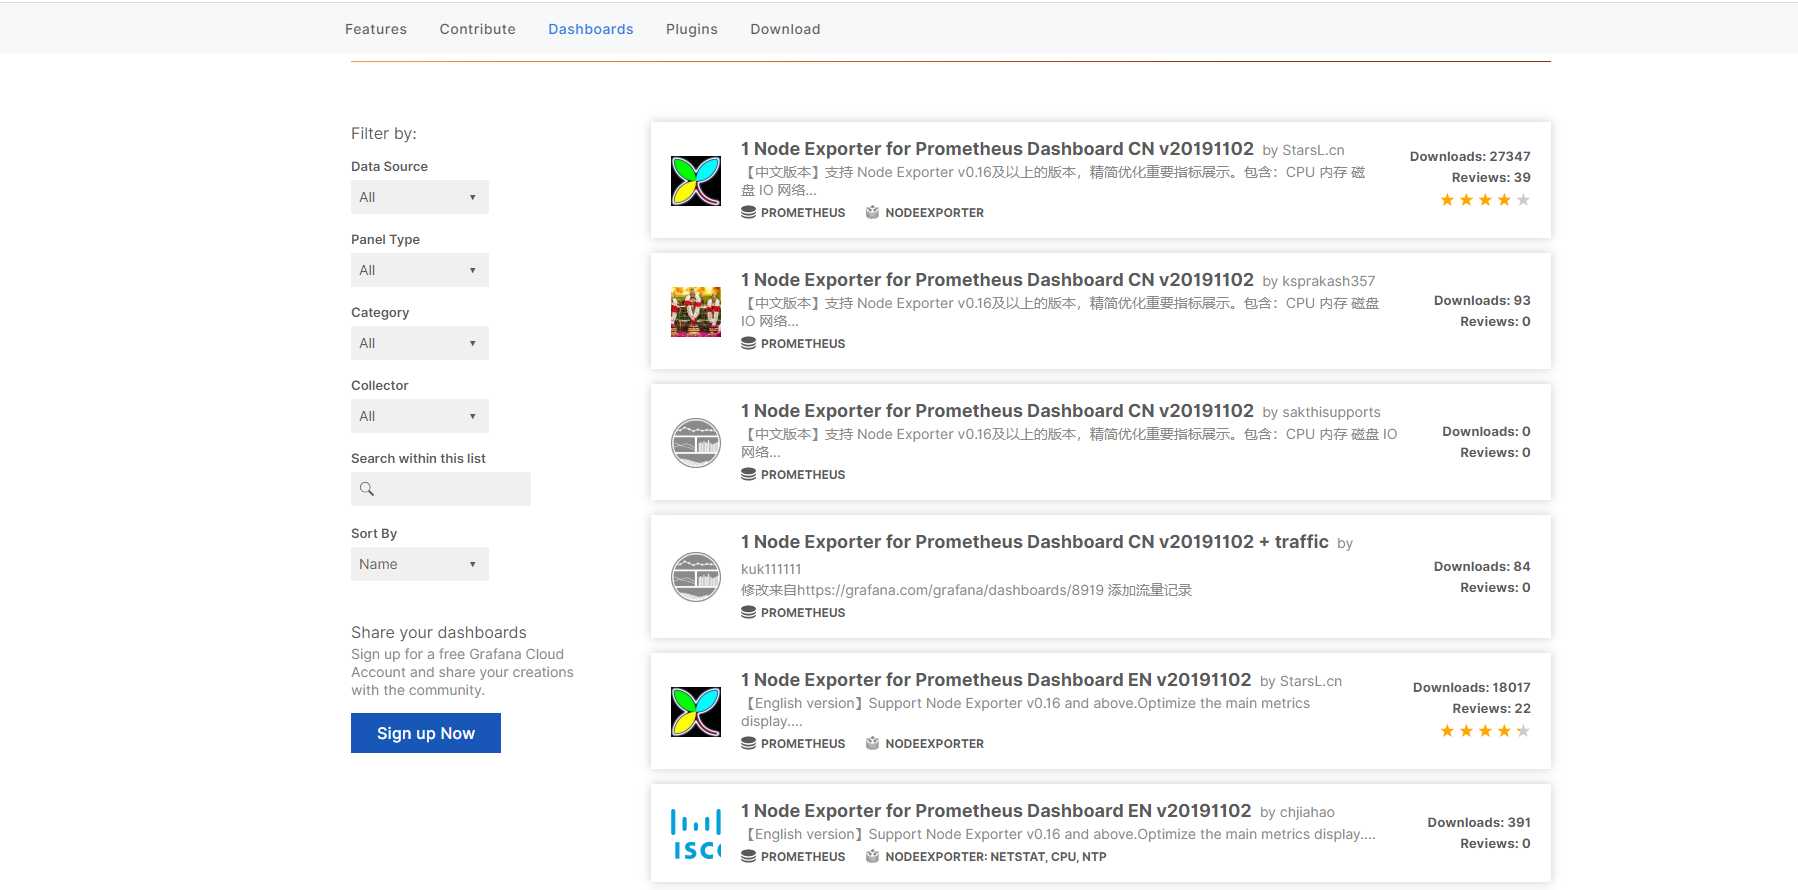
Grafana中所有的Dashboard通过JSON进行共享,下载并且导入这些JSON文件,就可以直接使用这些已经定义好的Dashboard:
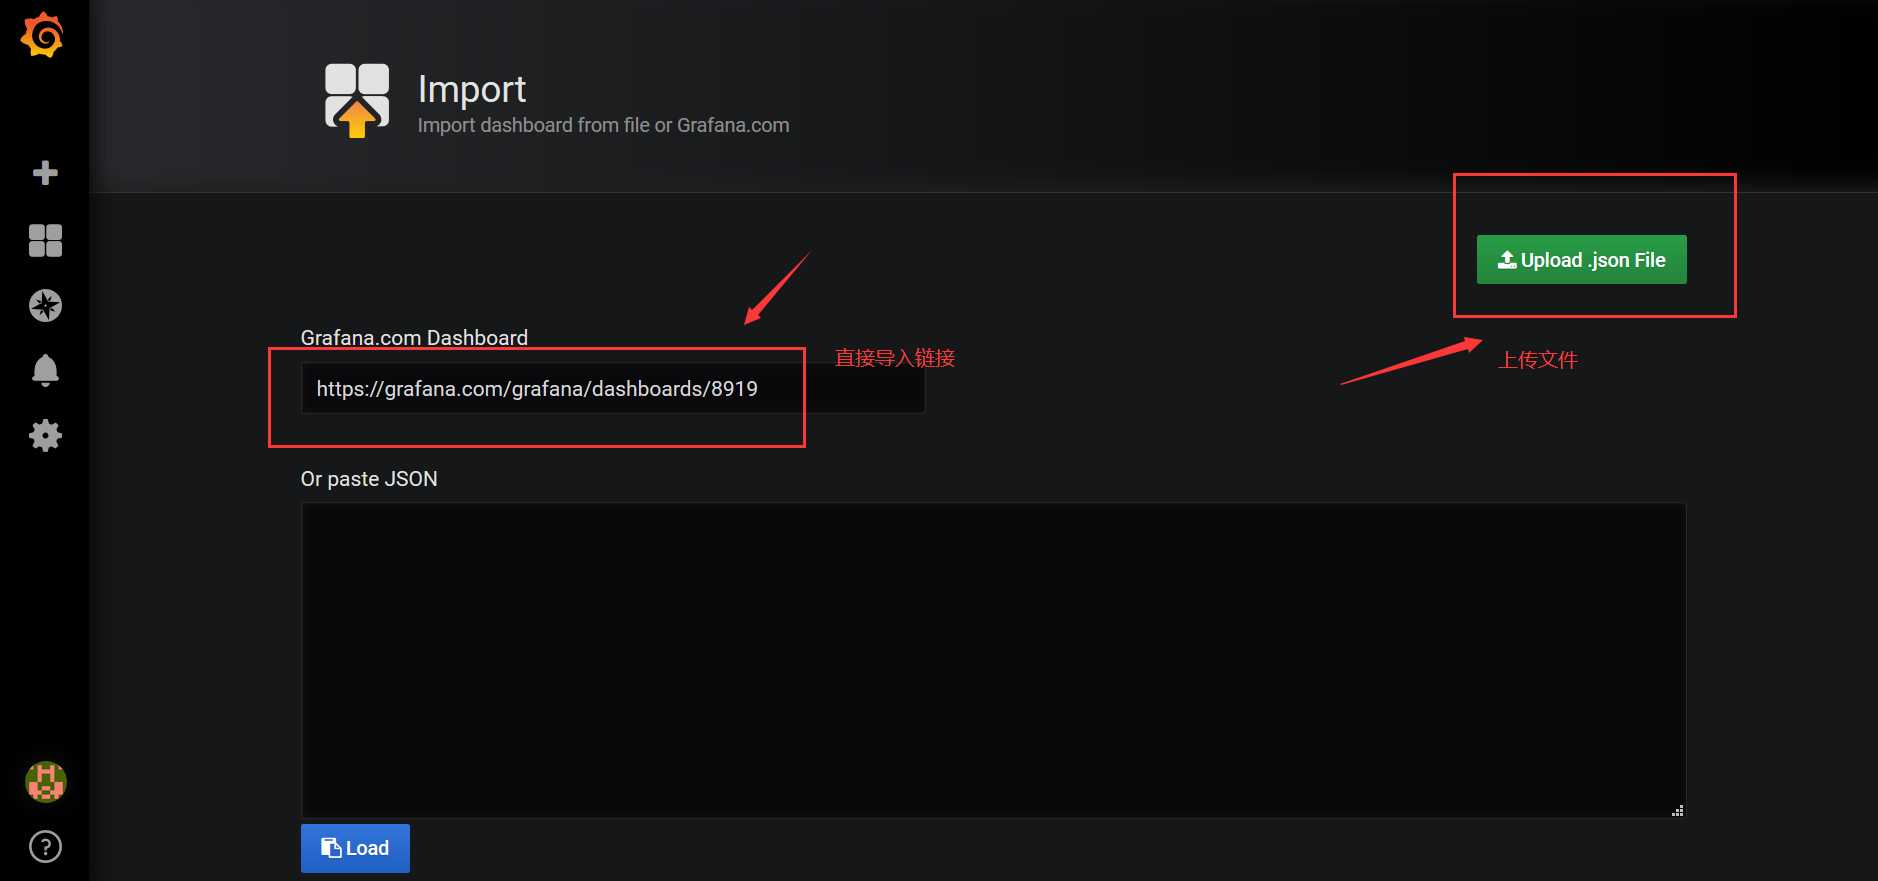
这里我们通过在dashboard找想选用的模板例如:"https://grafana.com/grafana/dashboards/8919",这里如果能够连接外网直接导入链接或者在grafana官网下载Dashboard的json文件upload上去:
效果展示:
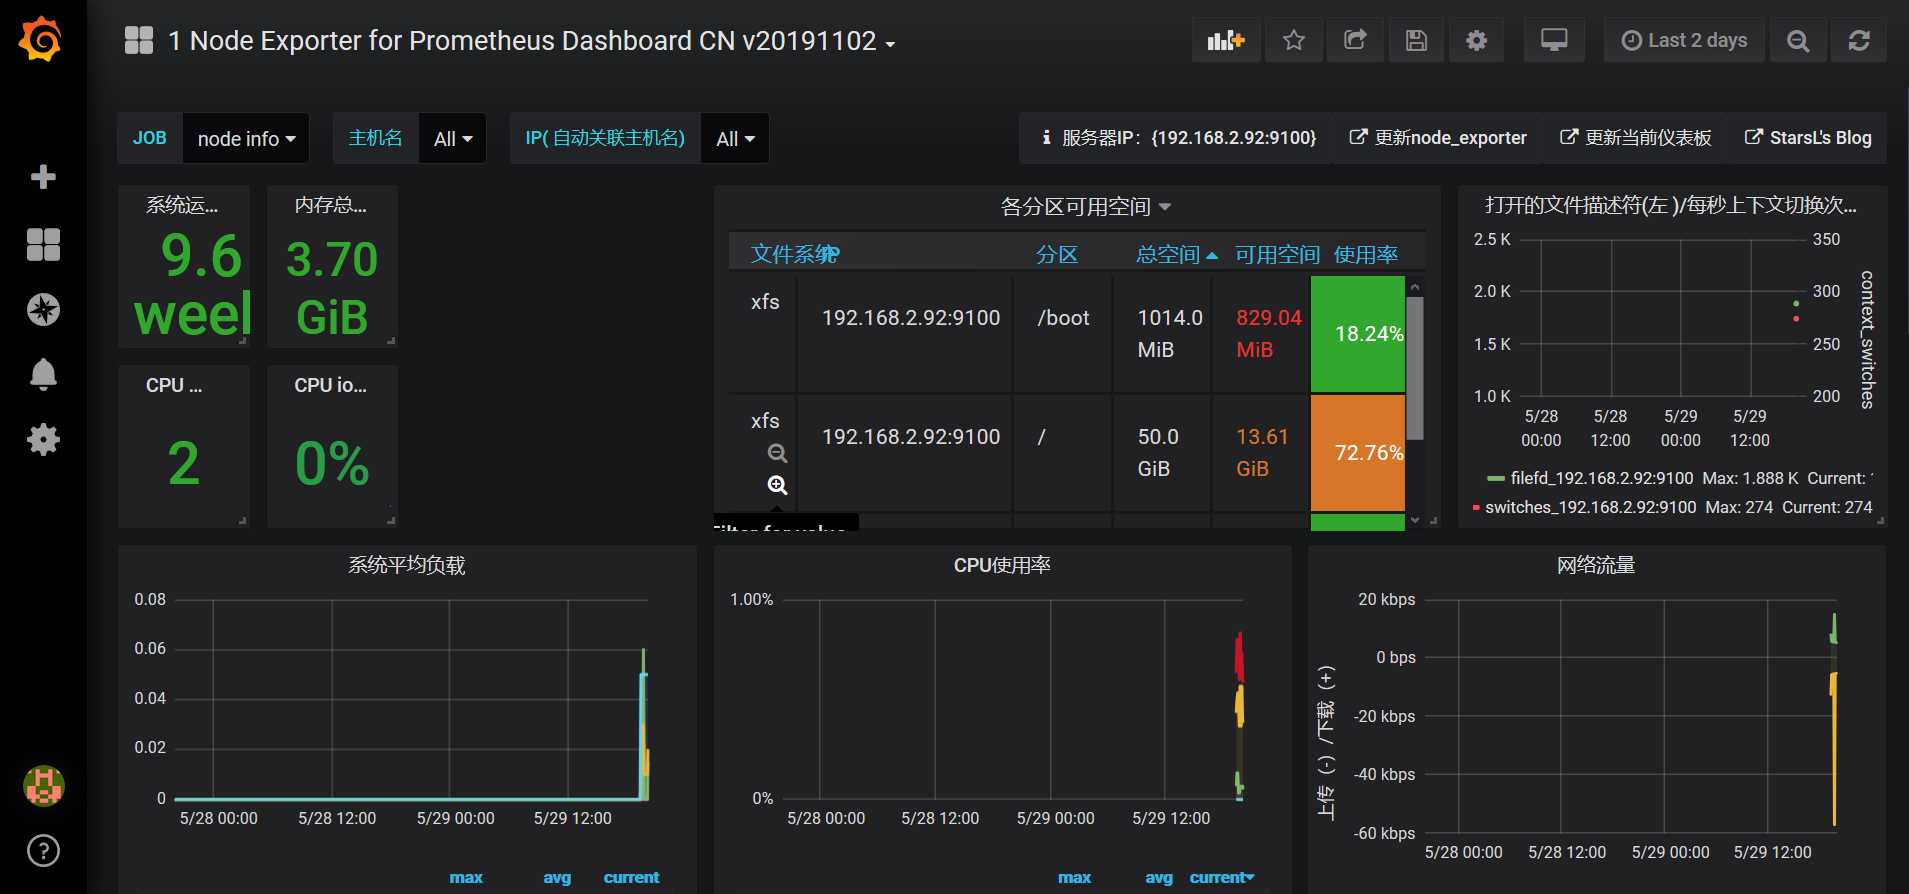
Grafana+Prometheus+Node_exporter监控Linux系统
标签:service 设置 document 数据 com 启动 start file idf
原文地址:https://www.cnblogs.com/yuhaohao/p/12989150.html