标签:logstash tip index 根据 stream add head gen x86_64
Elasticsearch    #数据库,存数据       JAVA
Logstash         #收集日志,过滤数据    JAVA
Kibana           #分析,过滤,展示      JAVA
Filebeat         #收集日志,传输到ES   GO

#日志收集分类
代理层:nginx,haproxy
web层:nginx,tomcat
数据库层:mysql,redis,mongo,elasticsearch
操作系统层:source,message
| 主机名 | ip地址 | 服务 |
|---|---|---|
| elast01 | 10.0.1.101 | es、kibana、nginx、filebeat |
| web02 | 10.0.1.8 | nginx、filebeat |
| docker01 | 10.0.1.205 | docker、filebeat |
#ES安装
[root@elast01 ~]# yum -y install java-1.8.0
[root@elast01 ~]# mkdir -p /server/tools
[root@elast01 tools]# ll
total 111388
-rw-r--r-- 1 root root 114059630 Feb 25  2019 elasticsearch-6.6.0.rpm
[root@elast01 tools]#
[root@elast01 tools]# rpm -ivh elasticsearch-6.6.0.rpm
[root@elast01 ~]# grep  "^[a-Z]" /etc/elasticsearch/elasticsearch.yml
node.name: node-1
path.data: /data/elasticsearch
path.logs: /var/log/elasticsearch
network.host: 10.0.1.101,127.0.0.1
http.port: 9200
[root@elast01 tools]# systemctl daemon-reload
[root@elast01 ~]# systemctl restart elasticsearch.service

#安装kibana
[root@elast01 tools]# rpm -ivh kibana-6.6.0-x86_64.rpm
[root@elast01 tools]# grep ‘^[a-Z]‘ /etc/kibana/kibana.yml
server.port: 5601
server.host: "10.0.1.101"
server.name: "elast01"
elasticsearch.hosts: ["http://localhost:9200"]
kibana.index: ".kibana"
[root@elast01 tools]# systemctl start kibana.service
[root@elast01 tools]# systemctl enable kibana.service
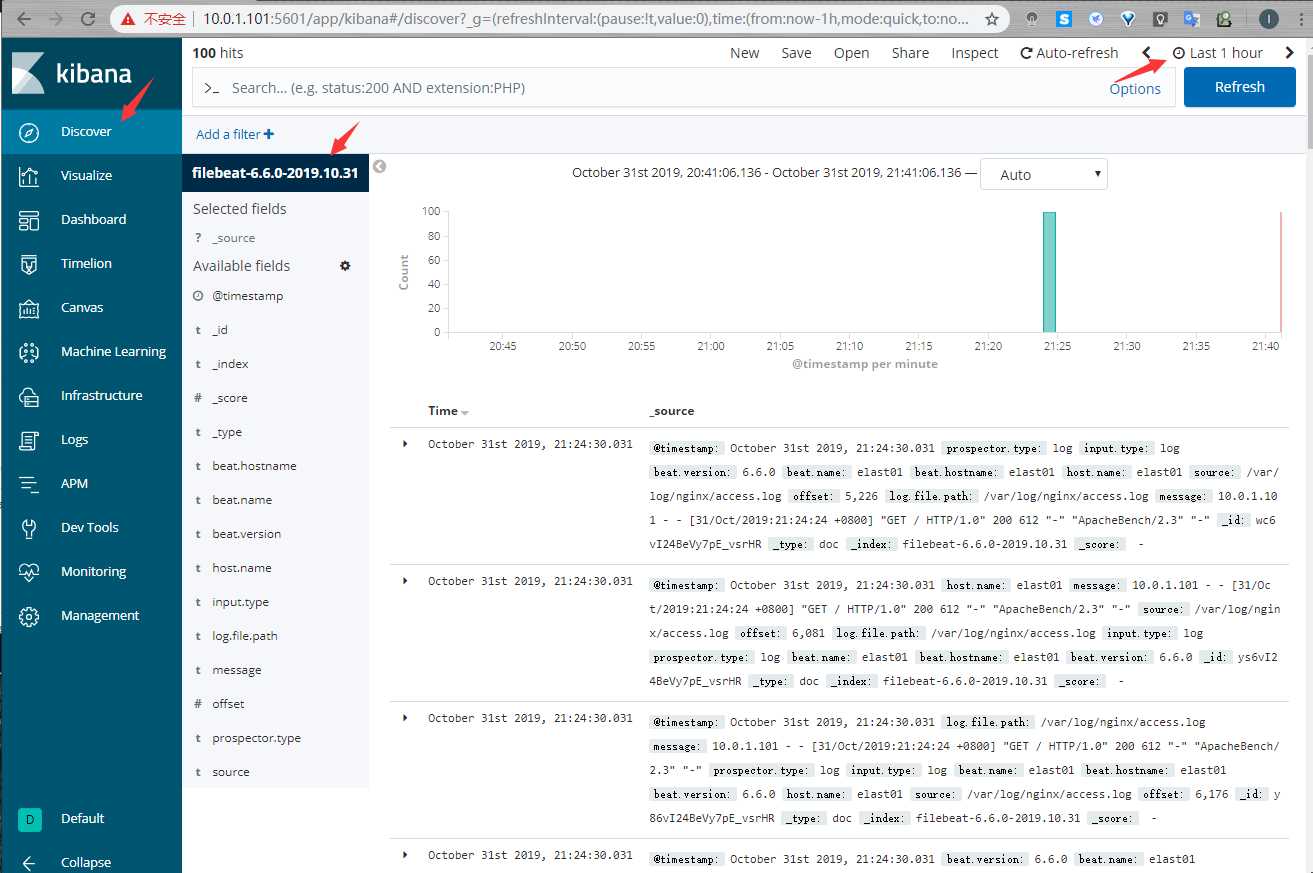
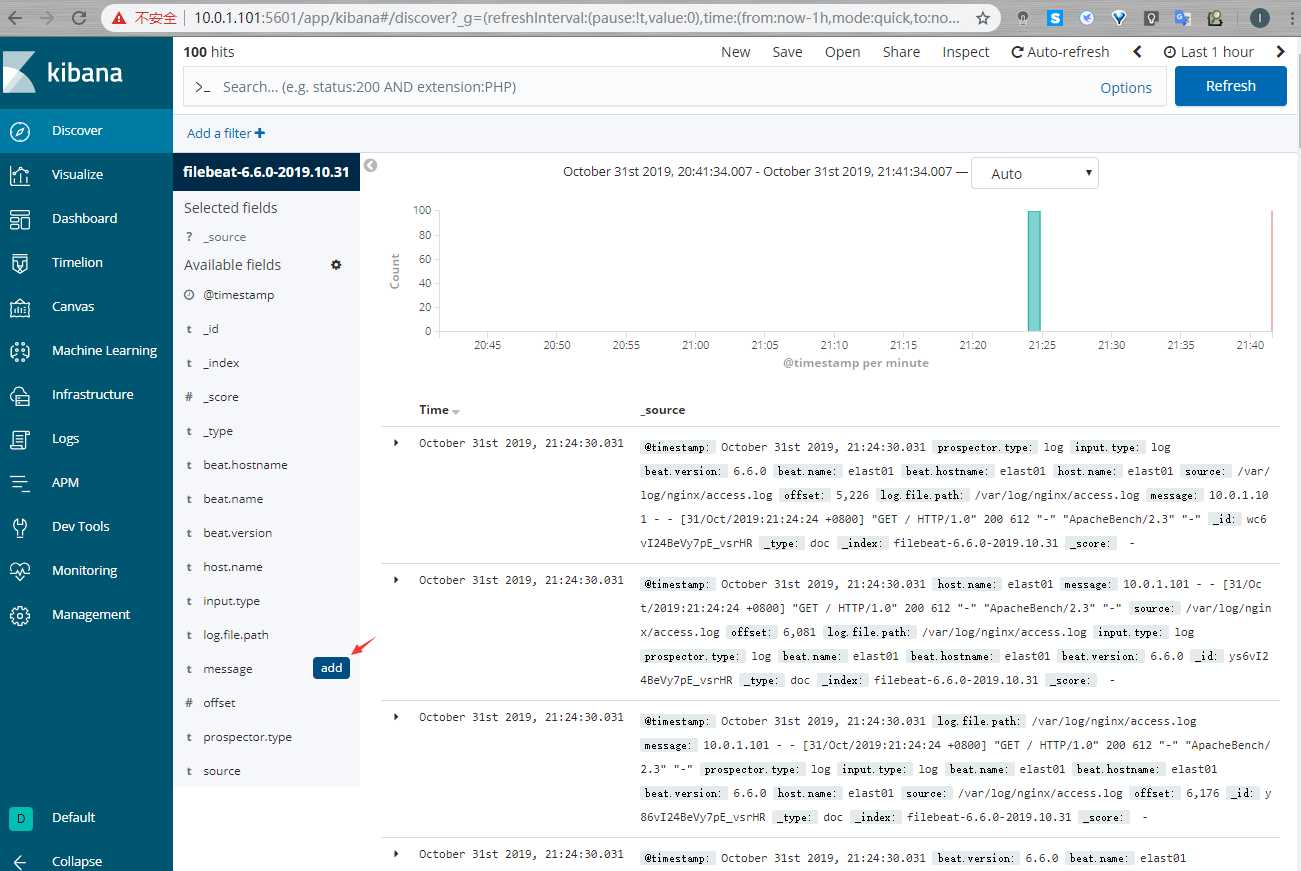
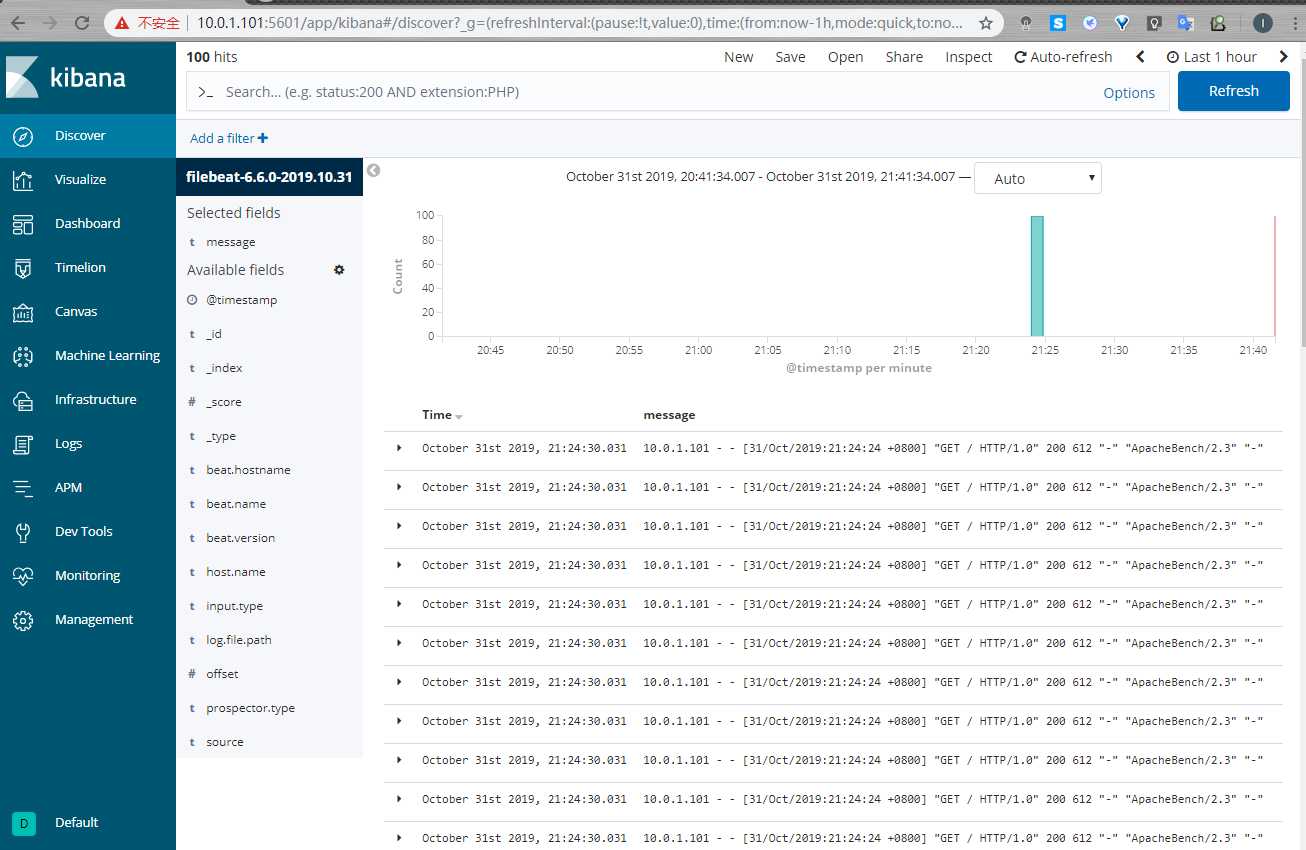
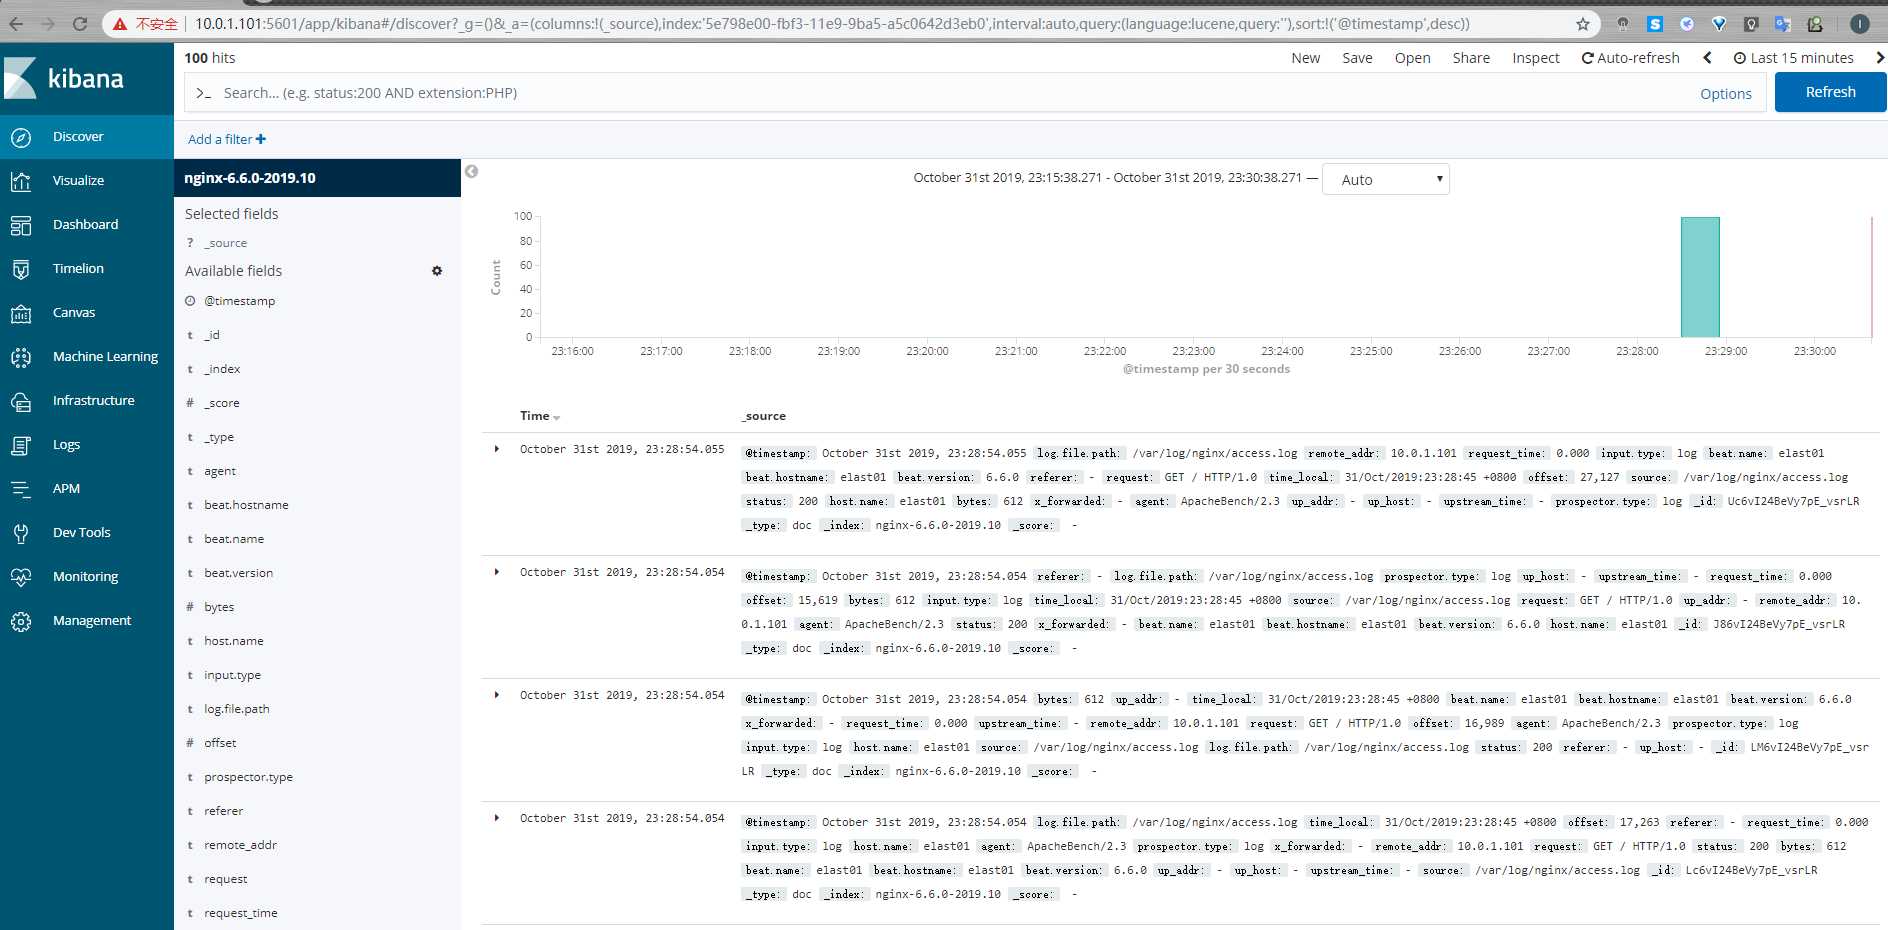
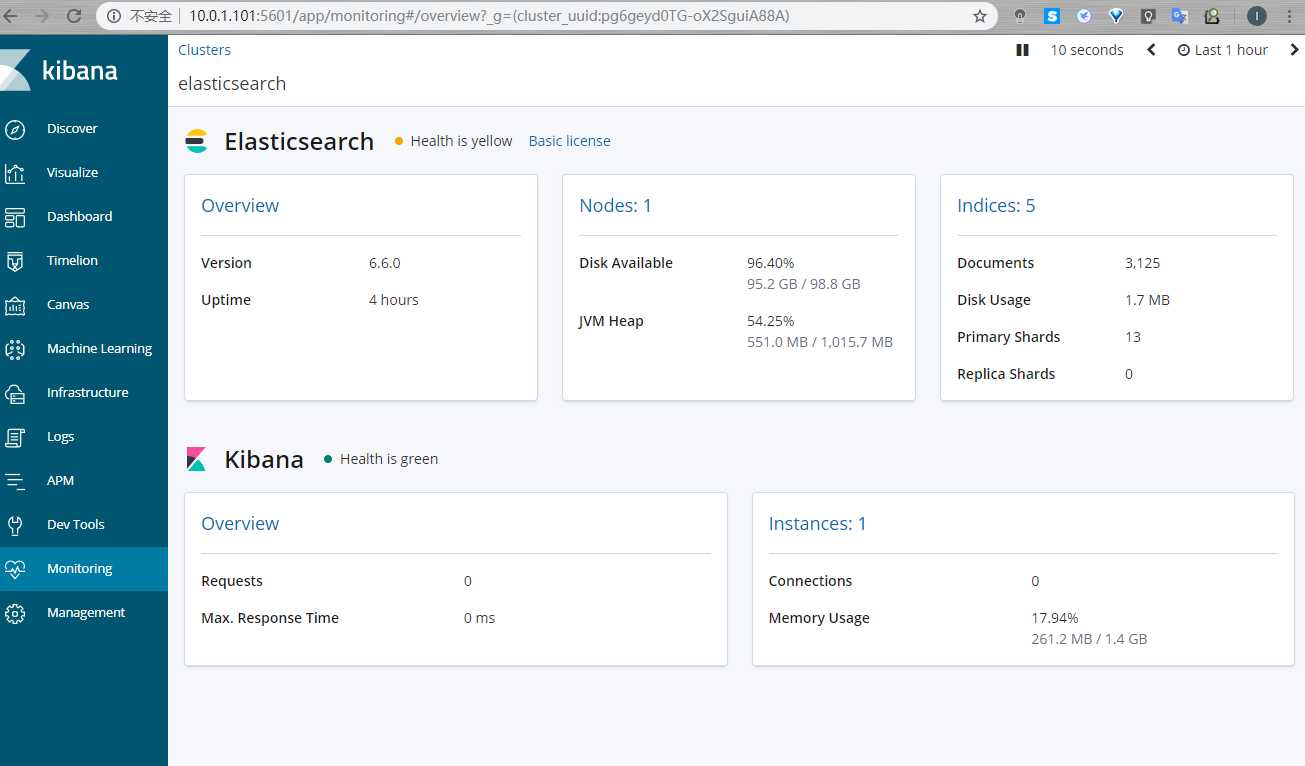
浏览器输入:http://10.0.1.101:5601
#安装nginx
[root@elast01 ~]# cat /etc/yum.repos.d/nginx.repo
[nginx-stable]
name=nginx stable repo
baseurl=http://nginx.org/packages/centos/$releasever/$basearch/
gpgcheck=1
enabled=1
gpgkey=https://nginx.org/keys/nginx_signing.key
module_hotfixes=true
[root@elast01 ~]# yum -y install nginx httpd-tools
[root@elast01 ~]# systemctl start nginx

#进行压测
[root@elast01 ~]# ab -n 100 -c 100 http://10.0.1.101/

#安装filebeat
[root@elast01 tools]# rpm -ivh filebeat-6.6.0-x86_64.rpm
[root@elast01 tools]# cat /etc/filebeat/filebeat.yml
filebeat.inputs:
- type: log
  enabled: true
  paths:
    - /var/log/nginx/access.log

output.elasticsearch:
  hosts: ["10.0.1.101:9200"]

[root@elast01 tools]#
[root@elast01 tools]# systemctl restart filebeat

#nginx修改配置文件
[root@elast01 ~]# grep -Ev ‘#|^$‘ /etc/nginx/nginx.conf
user  nginx;
worker_processes  1;
error_log  /var/log/nginx/error.log warn;
pid        /var/run/nginx.pid;
events {
    worker_connections  1024;
}
http {
    include       /etc/nginx/mime.types;
    default_type  application/octet-stream;
    log_format json  ‘{ "time_local": "$time_local", ‘
                          ‘"remote_addr": "$remote_addr", ‘
                          ‘"referer": "$http_referer", ‘
                          ‘"request": "$request", ‘
                          ‘"status": $status, ‘
                          ‘"bytes": $body_bytes_sent, ‘
                          ‘"agent": "$http_user_agent", ‘
                          ‘"x_forwarded": "$http_x_forwarded_for", ‘
                          ‘"up_addr": "$upstream_addr",‘
                          ‘"up_host": "$upstream_http_host",‘
                          ‘"upstream_time": "$upstream_response_time",‘
                          ‘"request_time": "$request_time"‘
‘ }‘;
    access_log  /var/log/nginx/access.log  json;
    sendfile        on;
    keepalive_timeout  65;
    include /etc/nginx/conf.d/*.conf;
}
[root@elast01 ~]#
[root@elast01 ~]# echo > /var/log/nginx/access.log

#修改filebeat文件
[root@elast01 ~]# cat /etc/filebeat/filebeat.yml
filebeat.inputs:
- type: log
  enabled: true
  paths:
    - /var/log/nginx/access.log
  json.keys_under_root: true
  json.overwrite_keys: true               #加这两条可以将日志解析成JSON格式

setup.kibana:
  host: "10.0.1.101:5601"

output.elasticsearch:
  hosts: ["10.0.1.101:9200"]
  index: "nginx-%{[beat.version]}-%{+yyyy.MM}"     #按月存储日志
setup.template.name: "nginx"          #重新命名模板
setup.template.pattern: "nginx-*"     #以这个名字开头的名字使用重命名的模板
setup.template.enabled: false         #不使用官方的模板
setup.template.overwrite: true        #是否覆盖原来的模板
[root@elast01 ~]#
[root@elast01 ~]# systemctl restart filebeat.service

#进行压测
[root@elast01 ~]# ab -n 100 -c 100 http://10.0.1.101/
#web02操作
#安装nginx
[root@web02 ~]# cat /etc/yum.repos.d/nginx.repo
[nginx-stable]
name=nginx stable repo
baseurl=http://nginx.org/packages/centos/$releasever/$basearch/
gpgcheck=1
enabled=1
gpgkey=https://nginx.org/keys/nginx_signing.key
module_hotfixes=true
[root@web02 ~]# yum -y install nginx
[root@web02 ~]# yum -y install nginx httpd-tools
#elast01操作
[root@elast01 ~]# scp /etc/nginx/nginx.conf root@10.0.1.8:/etc/nginx/
#web02操作
#安装filebeat
[root@web02 ~]# mkdir -p /server/tools
[root@web02 tools]# rpm -ivh filebeat-6.6.0-x86_64.rpm
#修改filebeat文件
[root@web02 ~]# cat /etc/filebeat/filebeat.yml
filebeat.inputs:
- type: log
enabled: true
paths:
- /var/log/nginx/access.log
json.keys_under_root: true
json.overwrite_keys: true
tags: ["access"]
- type: log
enabled: true
paths:
- /var/log/nginx/error.log
tags: ["error"]
setup.kibana:
host: "10.0.1.101:5601"
output.elasticsearch:
hosts: ["10.0.1.101:9200"]
indices:
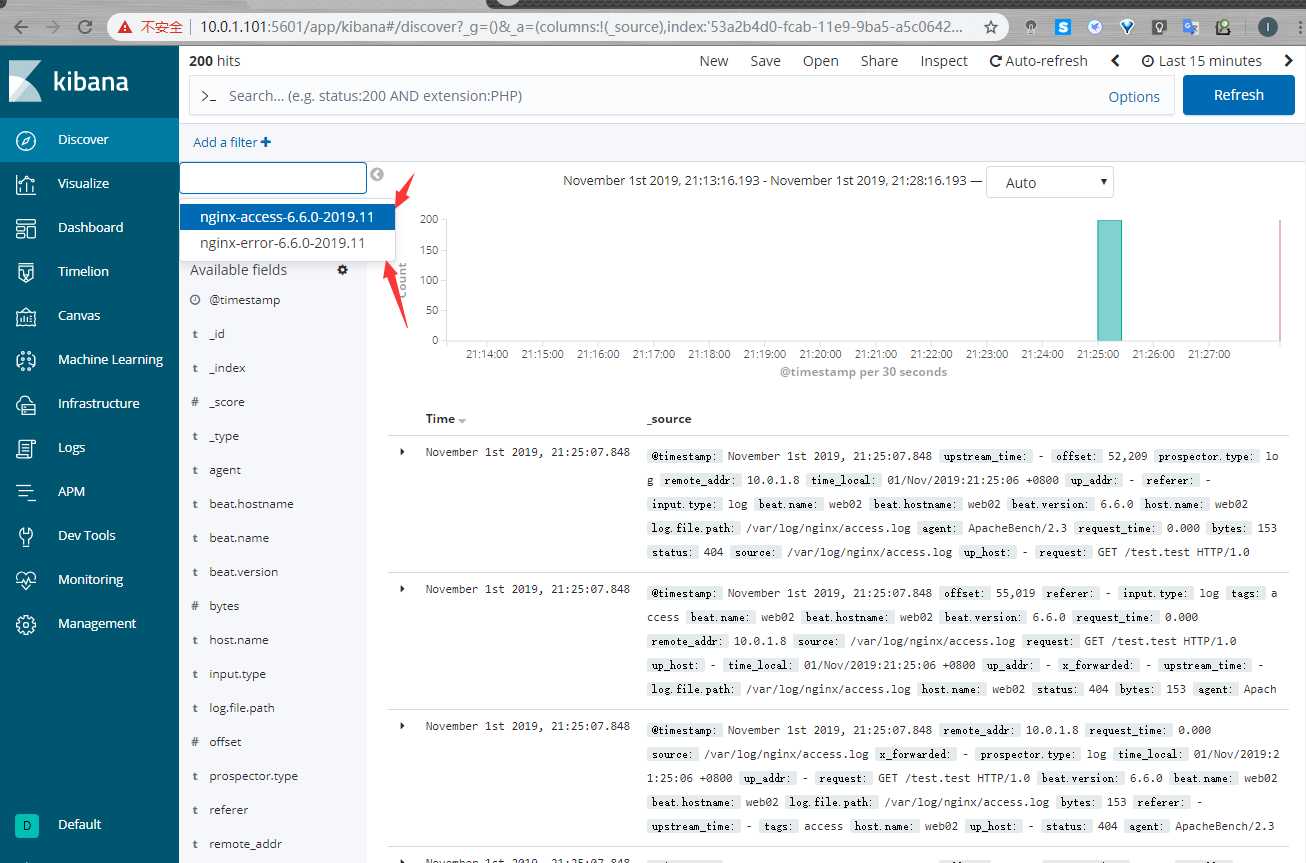
- index: "nginx-access-%{[beat.version]}-%{+yyyy.MM}"
when.contains:
tags: "access"
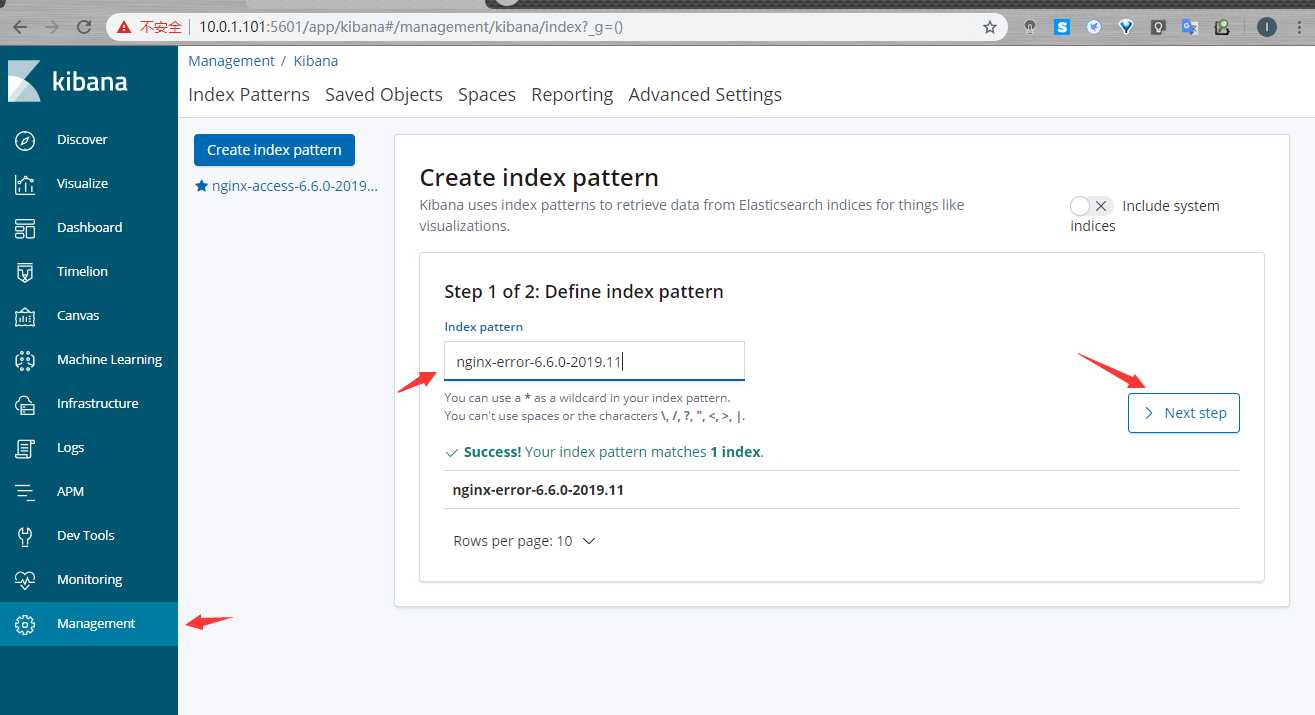
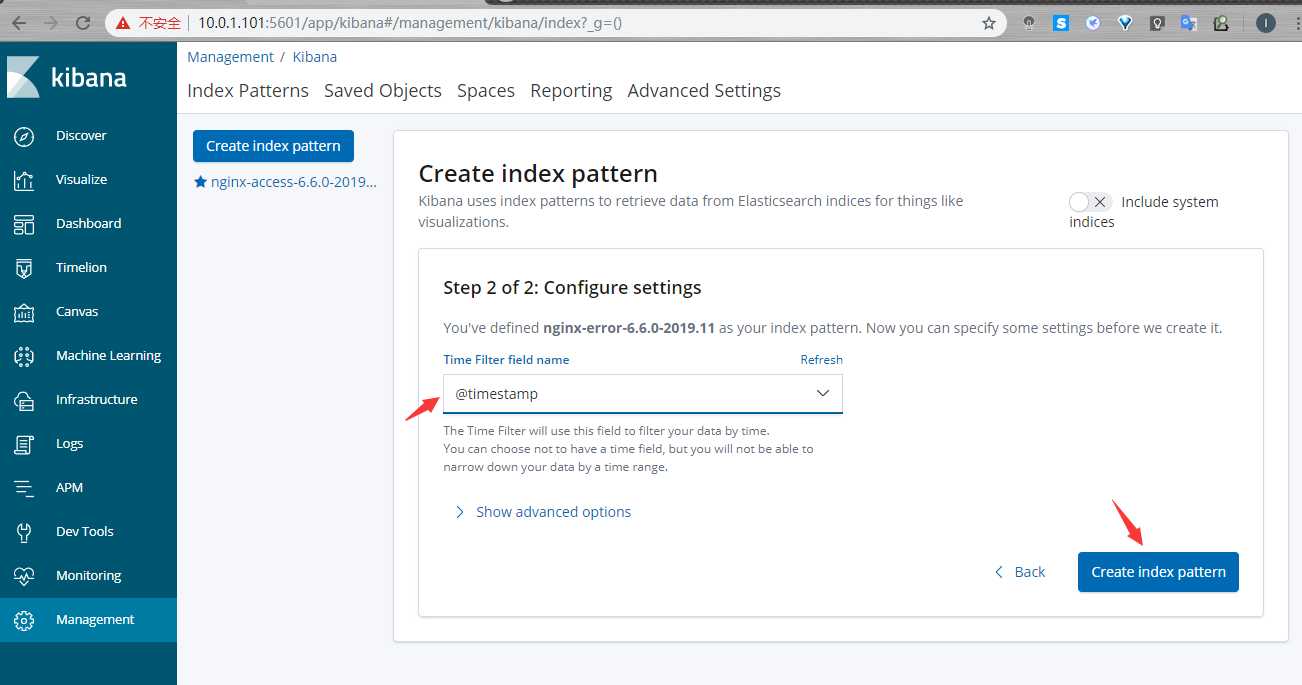
- index: "nginx-error-%{[beat.version]}-%{+yyyy.MM}"
when.contains:
tags: "error"
setup.template.name: "nginx"
setup.template.pattern: "nginx-*"
setup.template.enabled: false
setup.template.overwrite: true
[root@web02 ~]# systemctl restart nginx
[root@web02 ~]# systemctl restart filebeat
#进行压测
[root@web02 ~]# ab -n 100 -c 100 http://10.0.1.8/
[root@web02 ~]# ab -n 100 -c 100 http://10.0.1.8/test.test
#web02操作
[root@web02 ~]# yum install tomcat tomcat-webapps tomcat-admin-webapps tomcat-docs-webapp tomcat-javadoc -y
[root@web02 ~]# vim /etc/tomcat/server.xml
<Valve className="org.apache.catalina.valves.AccessLogValve" directory="logs"
138 prefix="localhost_access_log." suffix=".txt"
139 pattern="{"clientip":"%h","ClientUser":"%l","authenticated":"%u","AccessTime":"%t","method":"%r","status":"%s","SendBytes":"%b","Query?string":"%q","partner":"%{Referer}i","AgentVersion":"%{User-Agent}i"}"/>
140 </Host>
[root@web02 ~]# systemctl restart tomcat
#修改filebeat配置文件
[root@web02 ~]# cat /etc/filebeat/filebeat.yml
filebeat.inputs:
################nginx####################
- type: log
enabled: true
paths:
- /var/log/nginx/access.log
json.keys_under_root: true
json.overwrite_keys: true
tags: ["access"]
- type: log
enabled: true
paths:
- /var/log/nginx/error.log
tags: ["error"]
#################tomcat#################
- type: log
enabled: true
paths:
- /var/log/tomcat/localhost_access_log.*.txt
json.keys_under_root: true
json.overwrite_keys: true
tags: ["tomcat"]
setup.kibana:
host: "10.0.1.101:5601"
output.elasticsearch:
hosts: ["10.0.1.101:9200"]
indices:
- index: "nginx-access-%{[beat.version]}-%{+yyyy.MM}"
when.contains:
tags: "access"
- index: "nginx-error-%{[beat.version]}-%{+yyyy.MM}"
when.contains:
tags: "error"
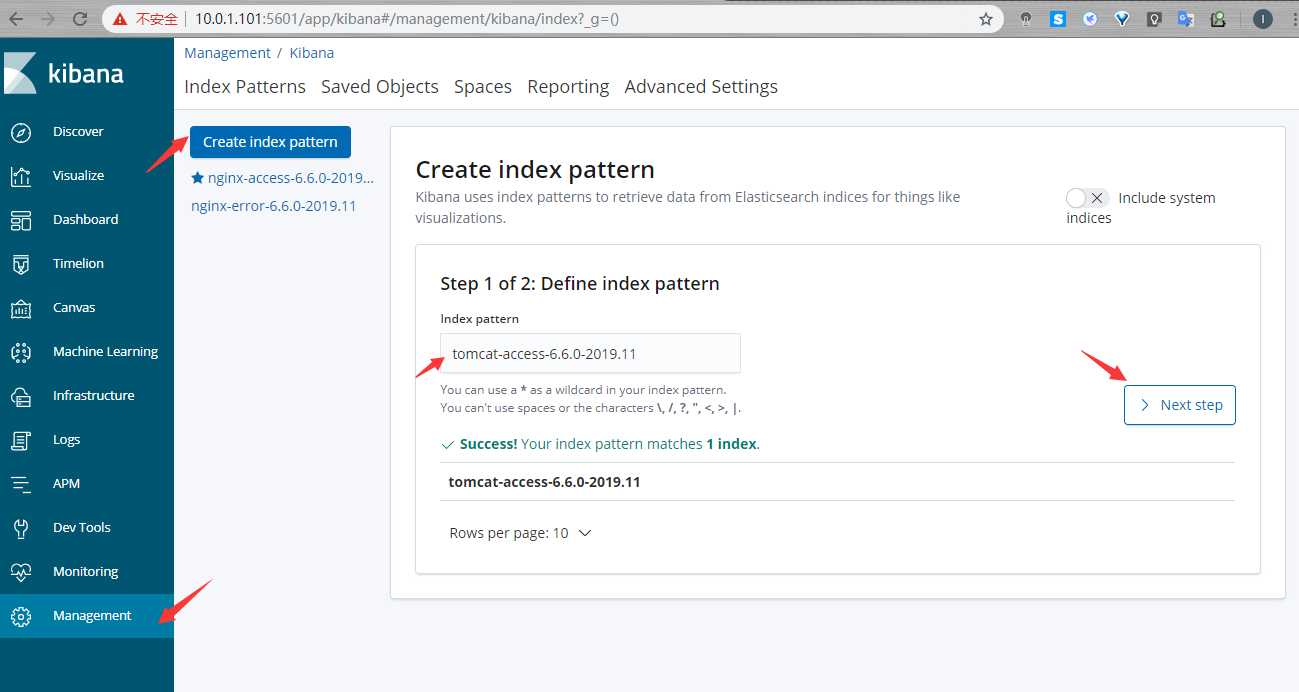
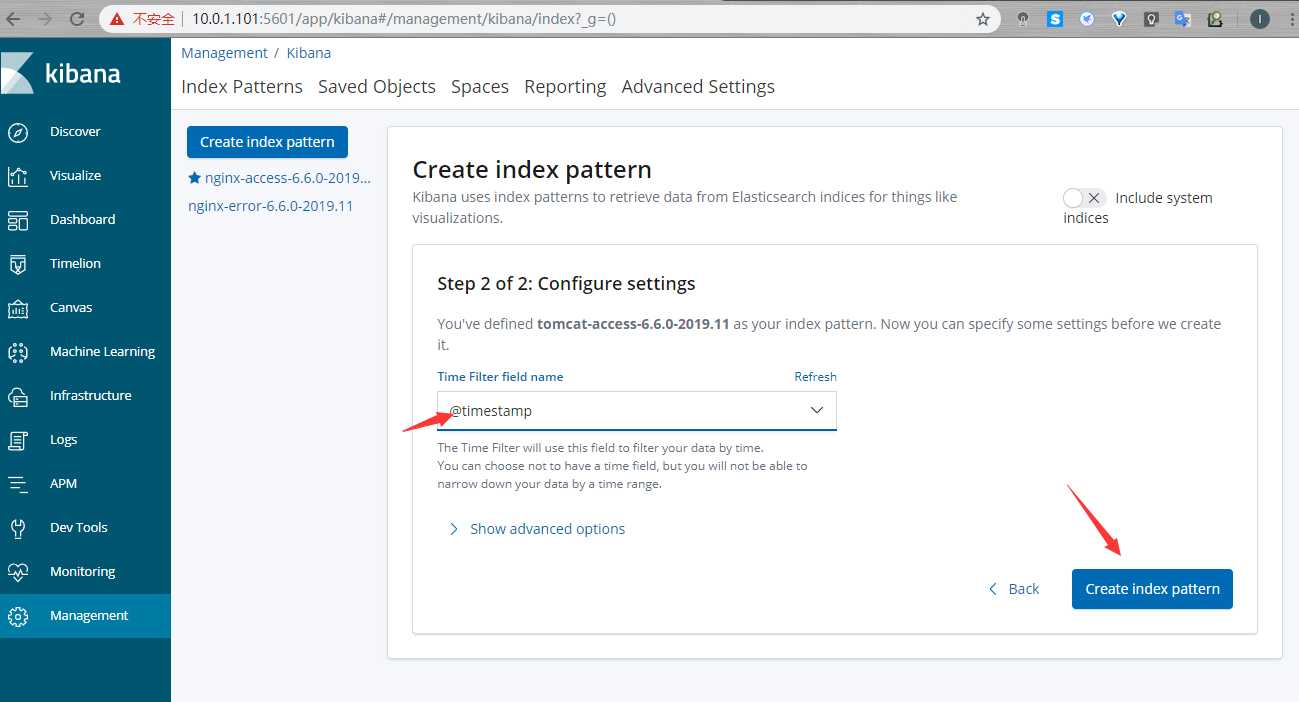
- index: "tomcat-access-%{[beat.version]}-%{+yyyy.MM}"
when.contains:
tags: "tomcat"
setup.template.name: "nginx"
setup.template.pattern: "nginx-*"
setup.template.enabled: false
setup.template.overwrite: true
[root@web02 ~]#
[root@web02 ~]# systemctl restart filebeat
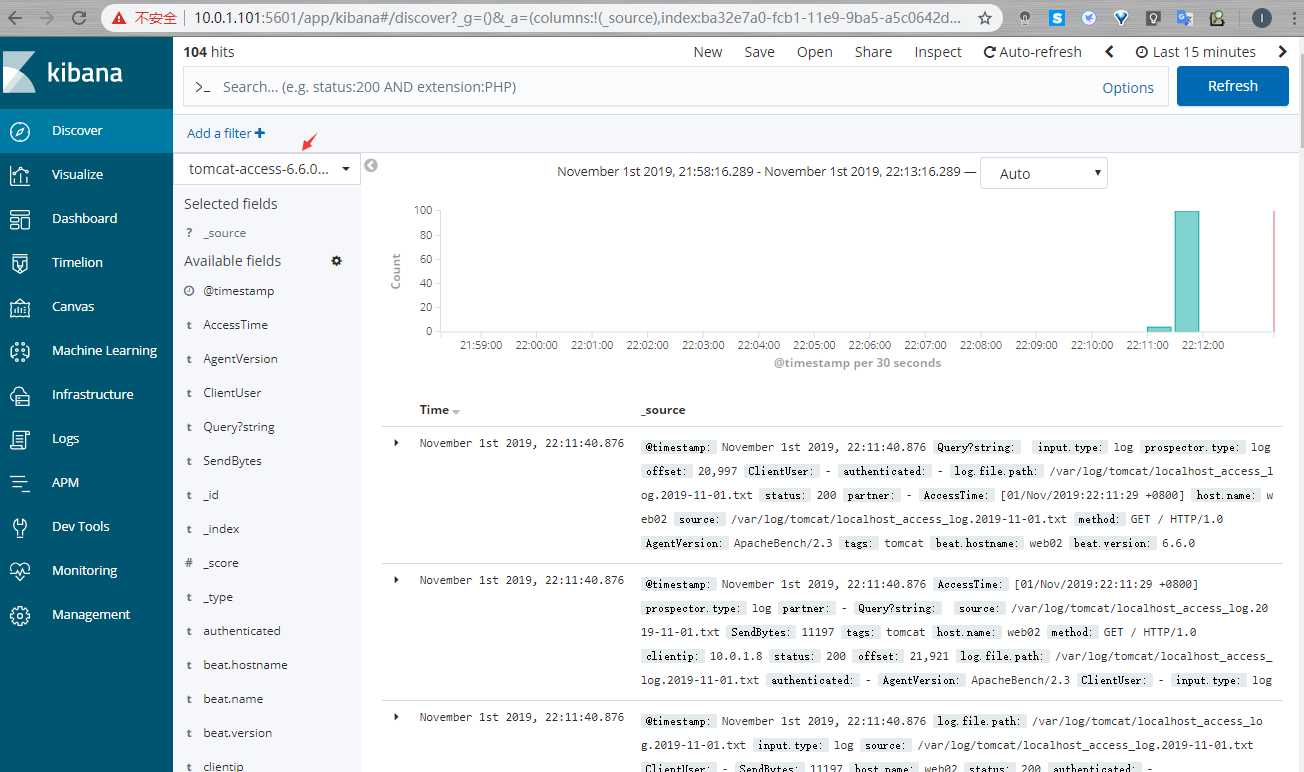
#进行压测
[root@web02 ~]# ab -n 100 -c 100 http://10.0.1.8:8080/
因为java日志的输出信息非常多,需要将多行拼成一个事件,所以需要多行匹配模式
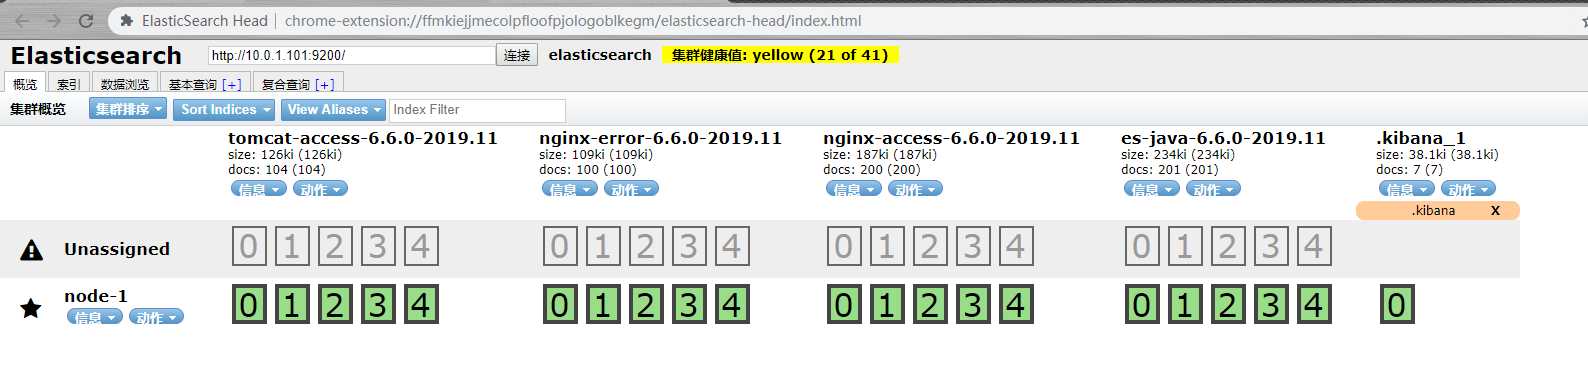
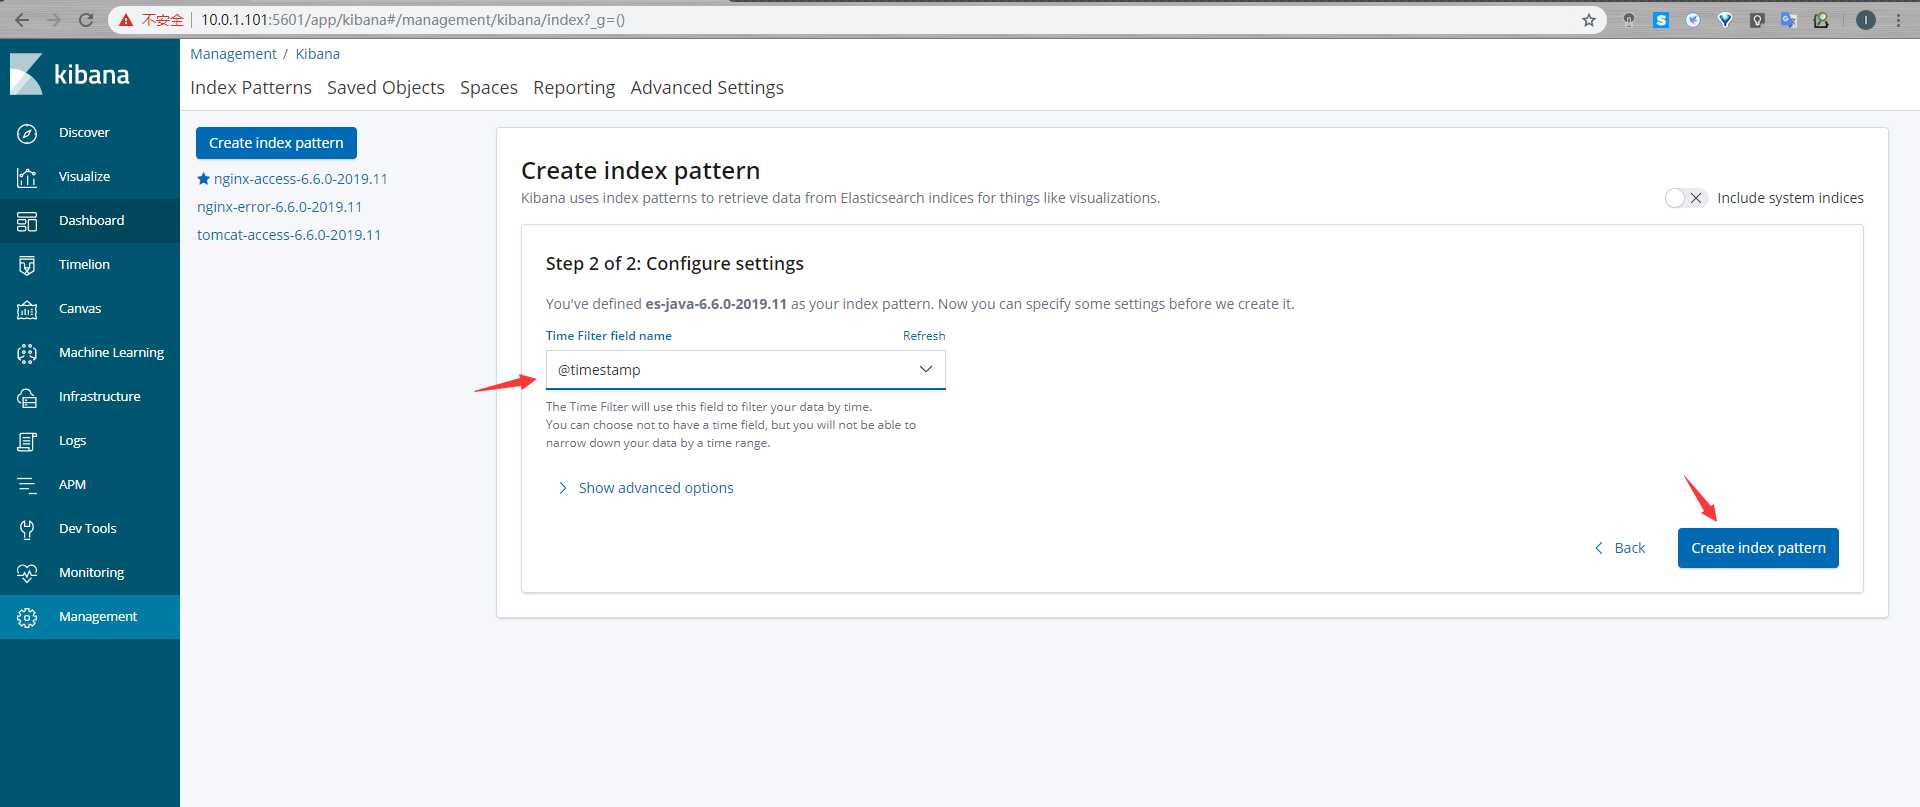
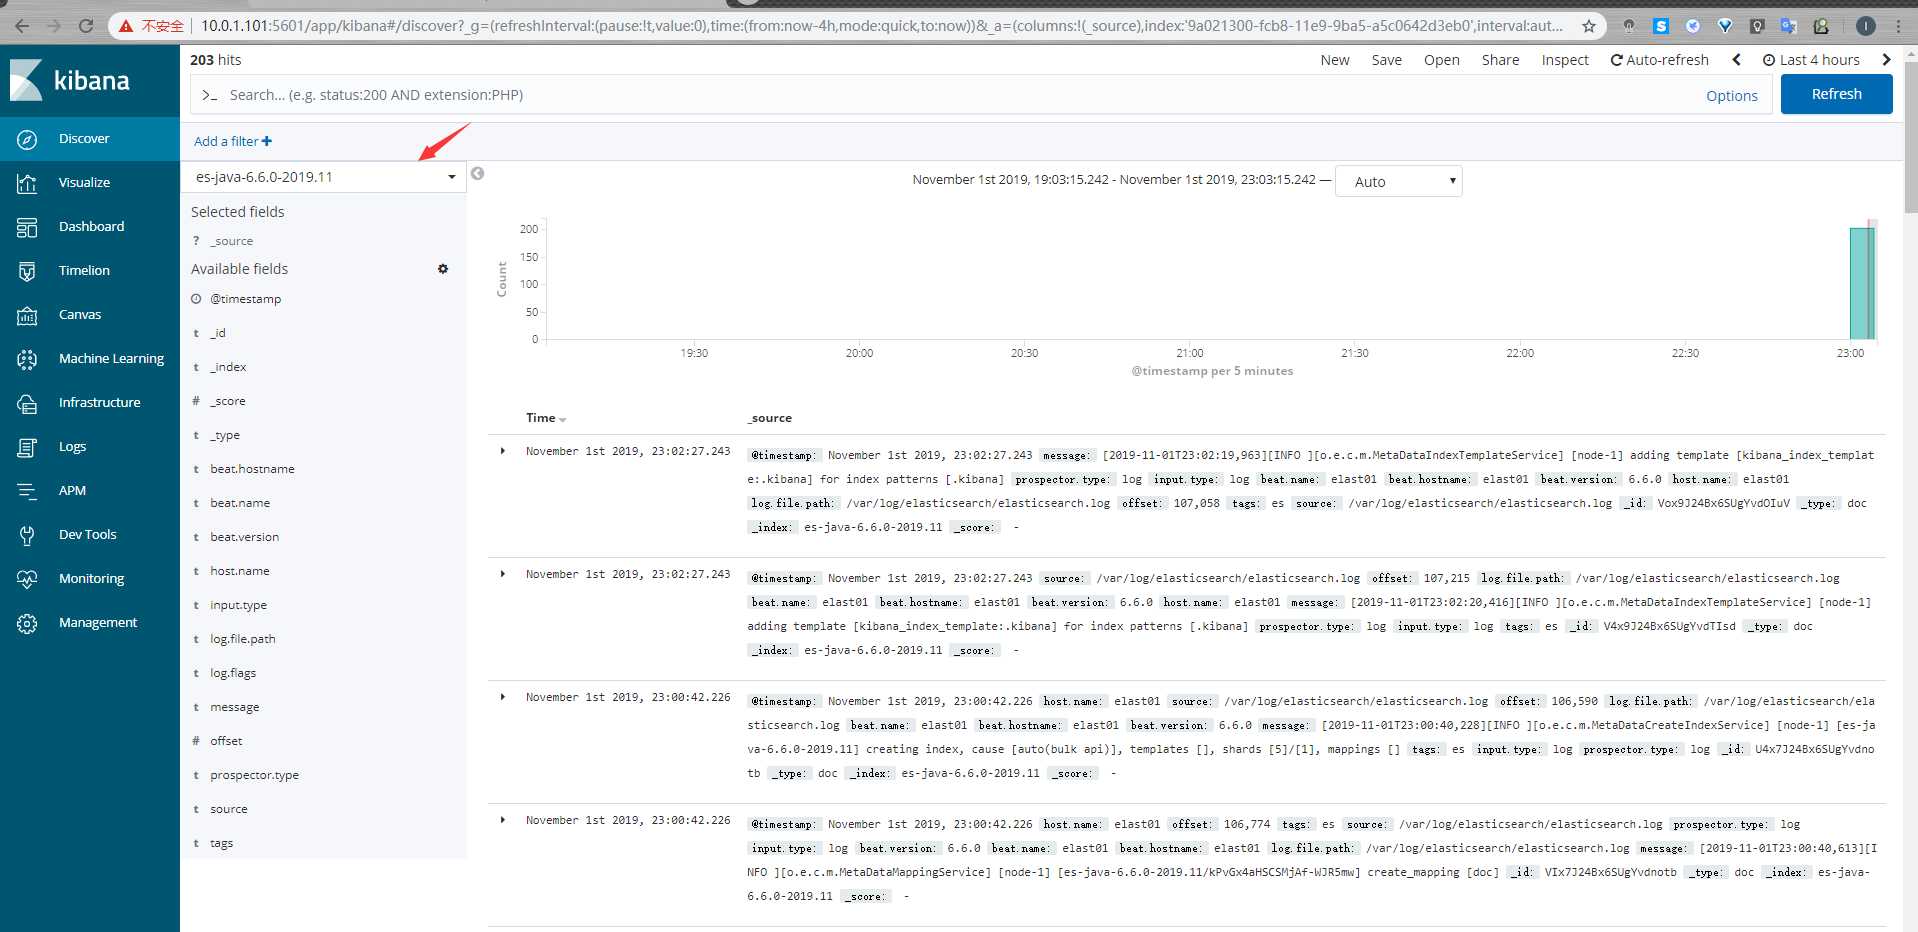
因为elasticsearch本身就是java开发的,所以我们可以直接收集ES的日志
#elast01操作
#修改filebeat配置文件
[root@elast01 ~]# cat /etc/filebeat/filebeat.yml
filebeat.inputs:
###############nginx##############
- type: log
enabled: true
paths:
- /var/log/nginx/access.log
json.keys_under_root: true
json.overwrite_keys: true
tags: ["access"]
################es#################
- type: log
enabled: true
paths:
- /var/log/elasticsearch/elasticsearch.log
tags: ["es"]
multiline.pattern: ‘^\[‘
multiline.negate: true
multiline.match: after
setup.kibana:
host: "10.0.1.101:5601"
output.elasticsearch:
hosts: ["10.0.1.101:9200"]
indices:
- index: "nginx-access-%{[beat.version]}-%{+yyyy.MM}"
when.contains:
tags: "access"
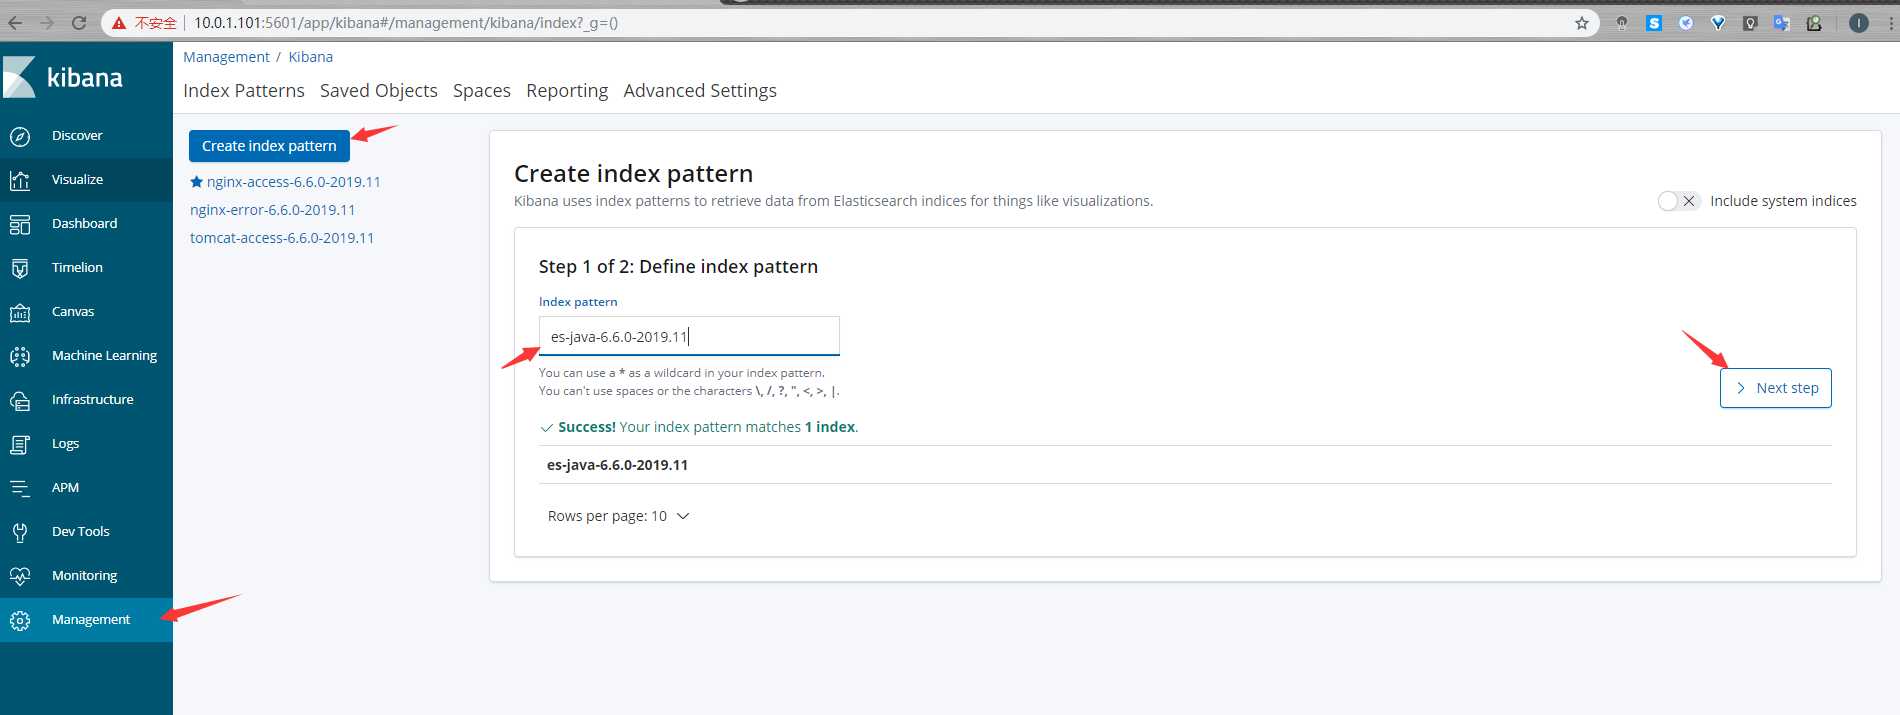
- index: "es-java-%{[beat.version]}-%{+yyyy.MM}"
when.contains:
tags: "es"
setup.template.name: "nginx"
setup.template.pattern: "nginx-*"
setup.template.enabled: false
setup.template.overwrite: true
[root@elast01 ~]# systemctl restart filebeat
#docker01操作
#启动dokcer容器
[root@docker01 ~]# docker run -d -p 80:80 nginx:latest
2f0bd8498bdee28d9a32f1ae240f31f654c560724cb1c0c1845de3d9405a468e
[root@docker01 ~]#
#安装filebeat
[root@docker01 ~]# mkdir /server/tools -p
[root@docker01 ~]# cd /server/tools/
[root@docker01 tools]# rpm -ivh filebeat-6.6.0-x86_64.rpm
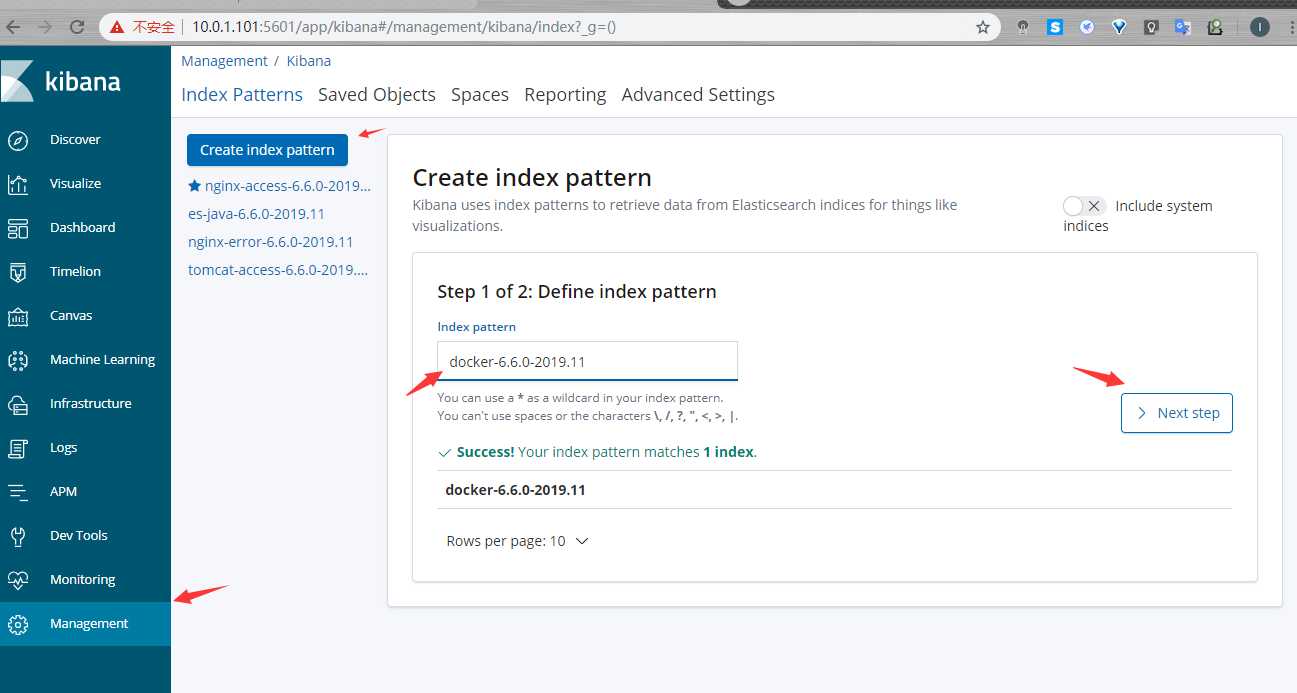
#编写配置文件收集单个docker日志
[root@docker01 tools]# cat /etc/filebeat/filebeat.yml
filebeat.inputs:
- type: docker
containers.ids:
- ‘2f0bd8498bdee28d9a32f1ae240f31f654c560724cb1c0c1845de3d9405a468e‘
setup.kibana:
host: "10.0.1.101:5601"
output.elasticsearch:
hosts: ["10.0.1.101:9200"]
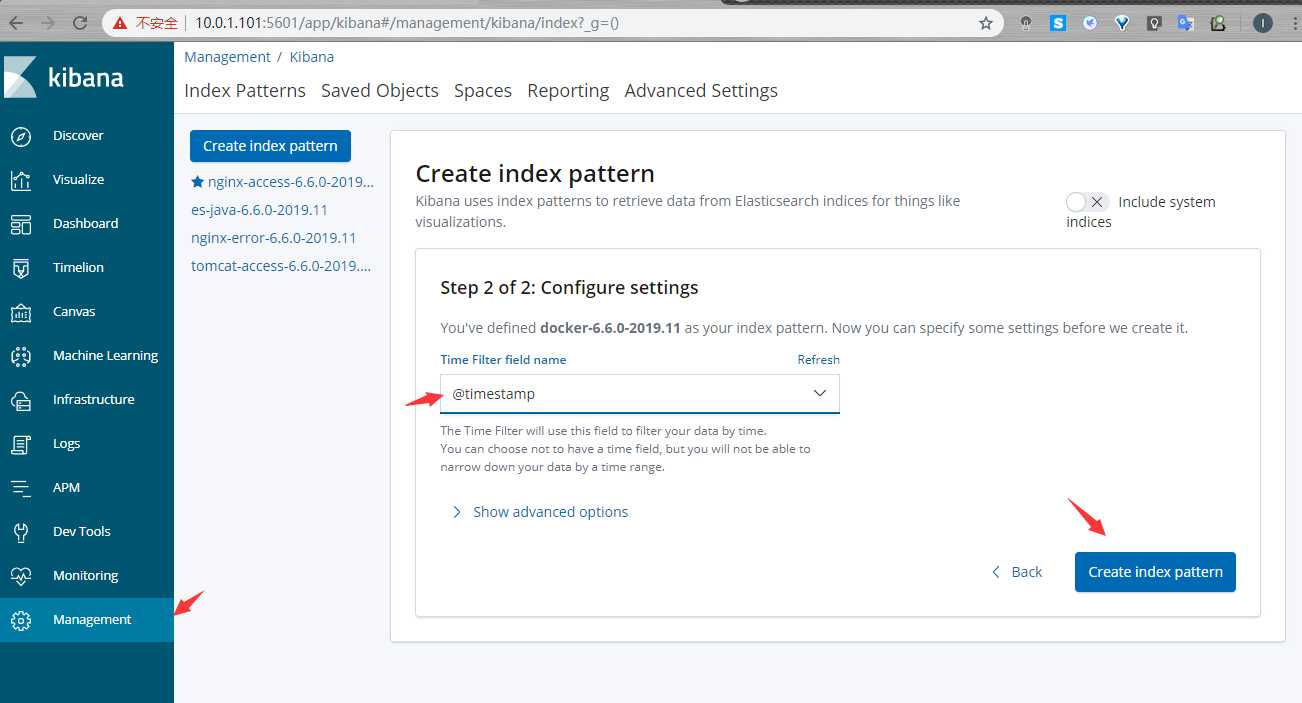
index: "docker-%{[beat.version]}-%{+yyyy.MM}"
setup.template.name: "docker"
setup.template.pattern: "docker-*"
setup.template.enabled: false
setup.template.overwrite: true
[root@docker01 tools]# systemctl restart filebeat
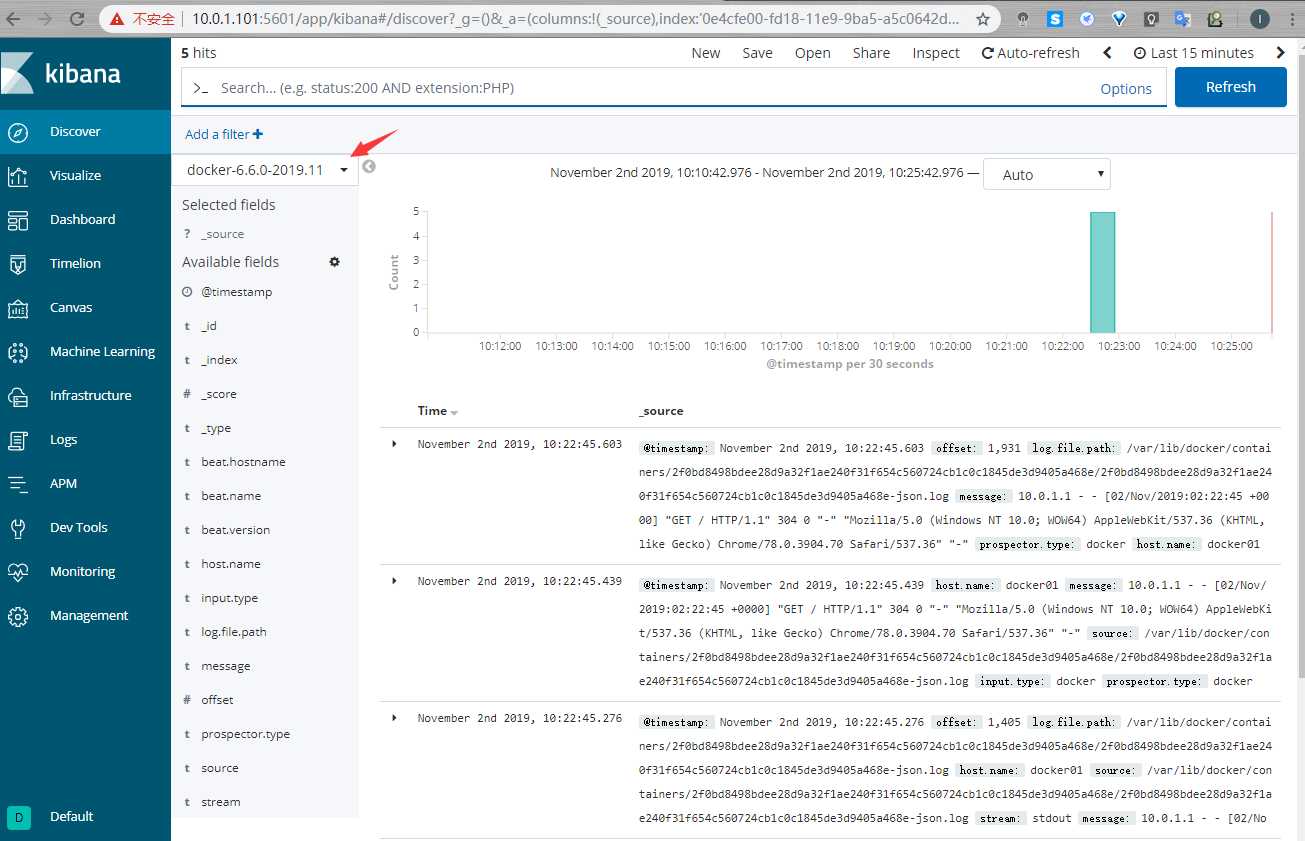
每个容器的ID都不一样,为了区分不同服务运行的不同容器,可以使用docker-compose通过给容器添加labels标签来作为区分,然后filbeat把容器日志当作普通的json格式来解析并传输到es
#安装doker-compose
[root@docker01 ~]# yum -y install python2-pip
[root@docker01 ~]# pip install docker-compose -i https://pypi.tuna.tsinghua.edu.cn/simple
[root@docker01 ~]# docker-compose version
docker-compose version 1.24.1, build 4667896
docker-py version: 3.7.3
CPython version: 2.7.5
OpenSSL version: OpenSSL 1.0.1e-fips 11 Feb 2013
[root@docker01 ~]#
#编写docker-compose.yml
[root@docker01 ~]# cat docker-compose.yml
version: ‘3‘
services:
nginx:
image: nginx:latest
# 设置labels
labels:
service: nginx_v1
# logging设置增加labels.service
logging:
options:
labels: "service"
ports:
- "80:80"
db:
image: nginx:latest
# 设置labels
labels:
service: nginx_v2
# logging设置增加labels.service
logging:
options:
labels: "service"
ports:
- "8080:80"
[root@docker01 ~]#
#运行docker-compose.yml
[root@docker01 ~]# docker-compose up -d
[root@docker01 ~]# docker container ls
CONTAINER ID IMAGE COMMAND CREATED STATUS PORTS NAMES
24b2561d7244 nginx:latest "nginx -g ‘daemon of…" 18 seconds ago Up 15 seconds 0.0.0.0:80->80/tcp root_nginx_1
5c7193eda264 nginx:latest "nginx -g ‘daemon of…" 18 seconds ago Up 15 seconds 0.0.0.0:8080->80/tcp root_db_1
[root@docker01 ~]#
#配置filebeat
[root@docker01 ~]# cat /etc/filebeat/filebeat.yml
filebeat.inputs:
- type: log
enabled: true
paths:
- /var/lib/docker/containers/*/*-json.log
json.keys_under_root: true
json.overwrite_keys: true
setup.kibana:
host: "10.0.1.101:5601"
output.elasticsearch:
hosts: ["10.0.1.101:9200"]
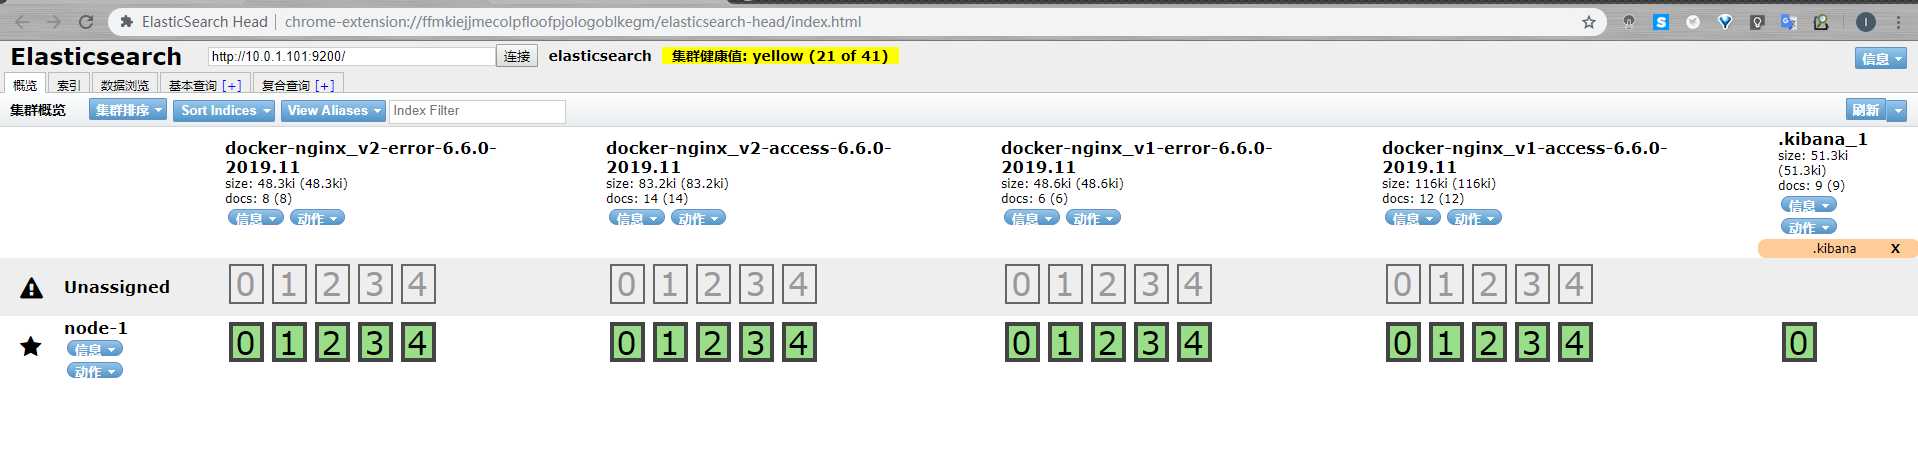
indices:
- index: "docker-nginx_v1-access-%{[beat.version]}-%{+yyyy.MM}"
when.contains:
attrs.service: "nginx_v1"
stream: "stdout"
- index: "docker-nginx_v1-error-%{[beat.version]}-%{+yyyy.MM}"
when.contains:
attrs.service: "nginx_v1"
stream: "stderr"
- index: "docker-nginx_v2-access-%{[beat.version]}-%{+yyyy.MM}"
when.contains:
attrs.service: "nginx_v2"
stream: "stdout"
- index: "docker-nginx_v2-error-%{[beat.version]}-%{+yyyy.MM}"
when.contains:
attrs.service: "nginx_v2"
stream: "stderr"
setup.template.name: "docker"
setup.template.pattern: "docker-*"
setup.template.enabled: false
setup.template.overwrite: true
[root@docker01 ~]# systemctl restart filebeat
#web02操作
#修改filebeat配置文件
[root@web02 ~]# cat /etc/filebeat/filebeat.yml
filebeat.config.modules:
path: ${path.config}/modules.d/*.yml
reload.enabled: true
setup.kibana:
host: "10.0.1.101:5601"
output.elasticsearch:
hosts: ["10.0.1.101:9200"]
indices:
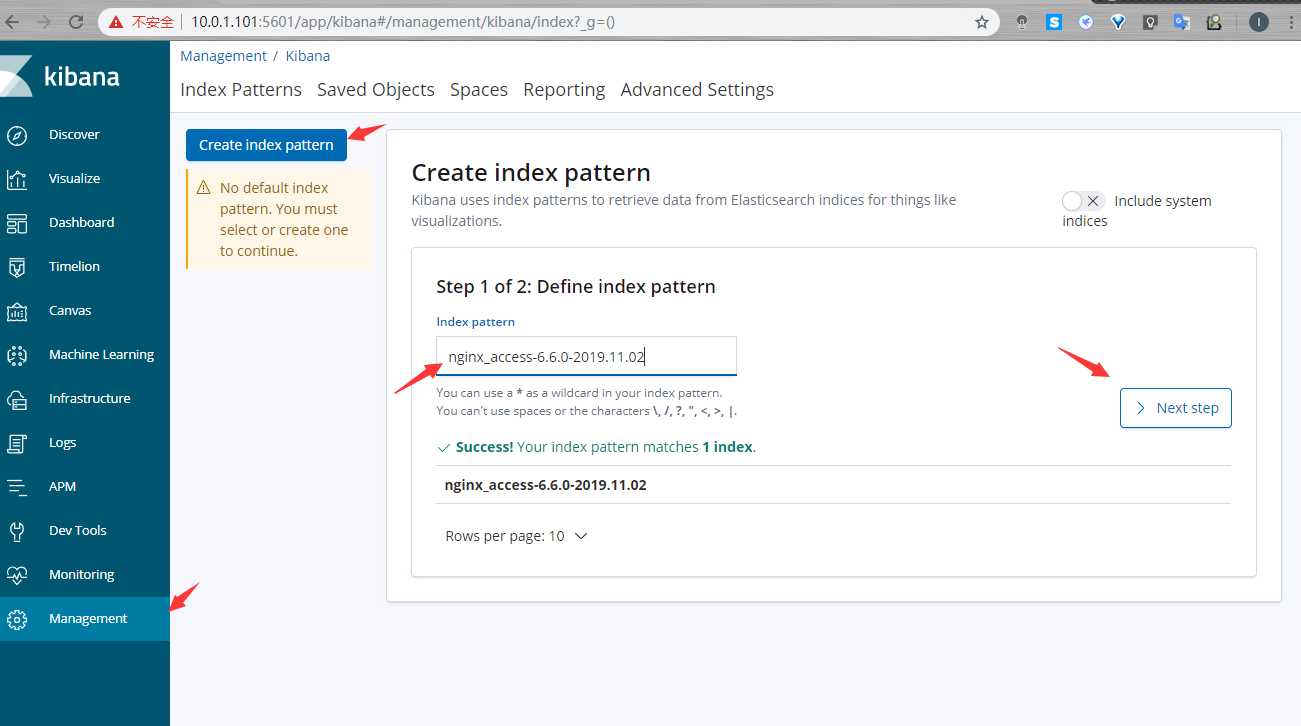
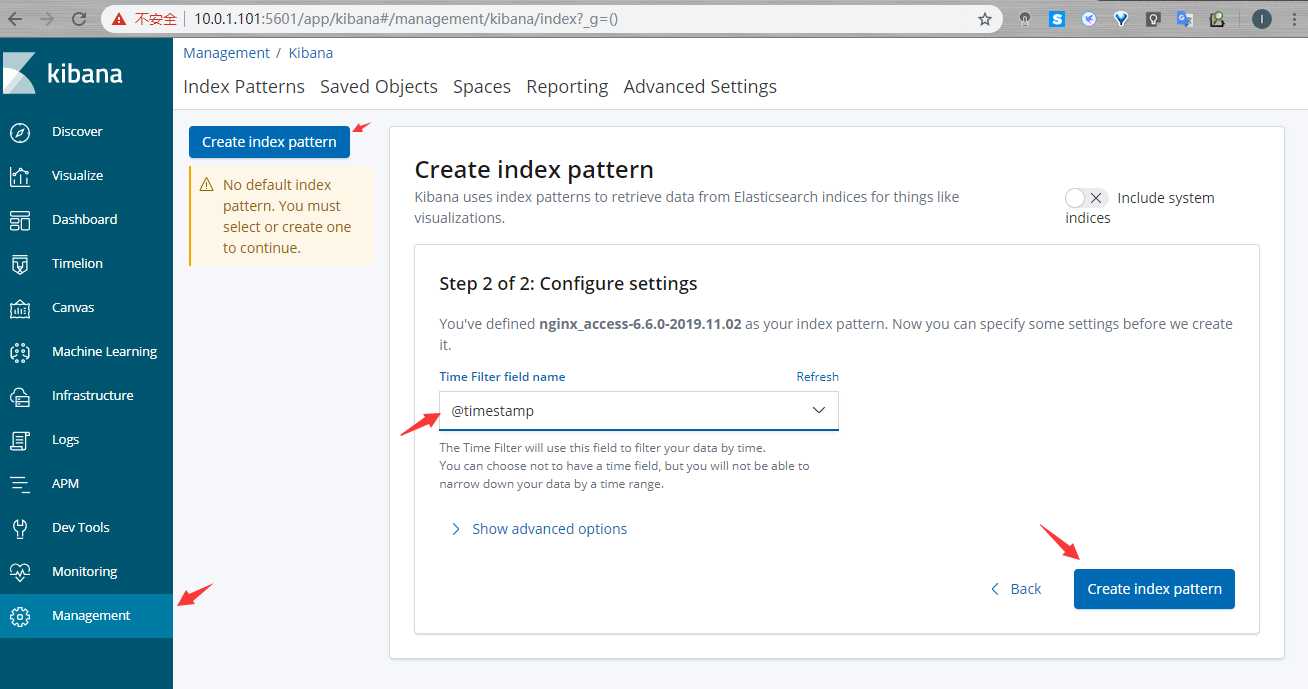
- index: "nginx_access-%{[beat.version]}-%{+yyyy.MM.dd}"
when.contains:
fileset.name: "access"
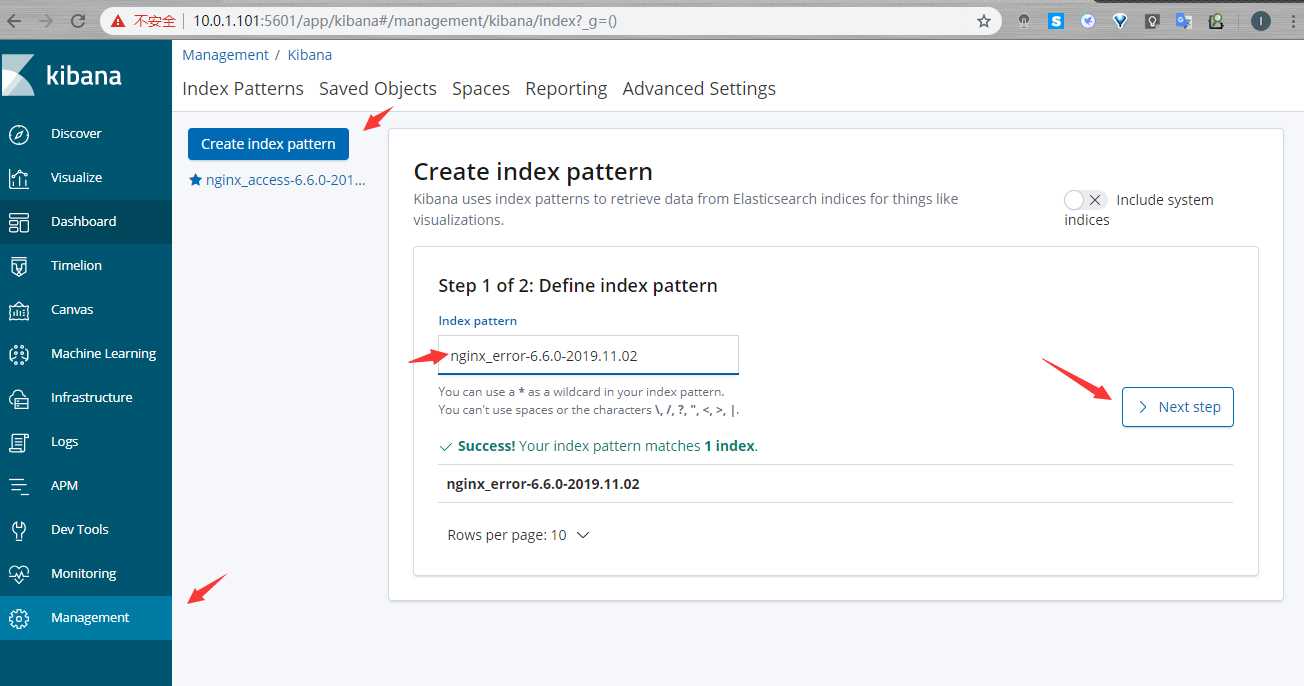
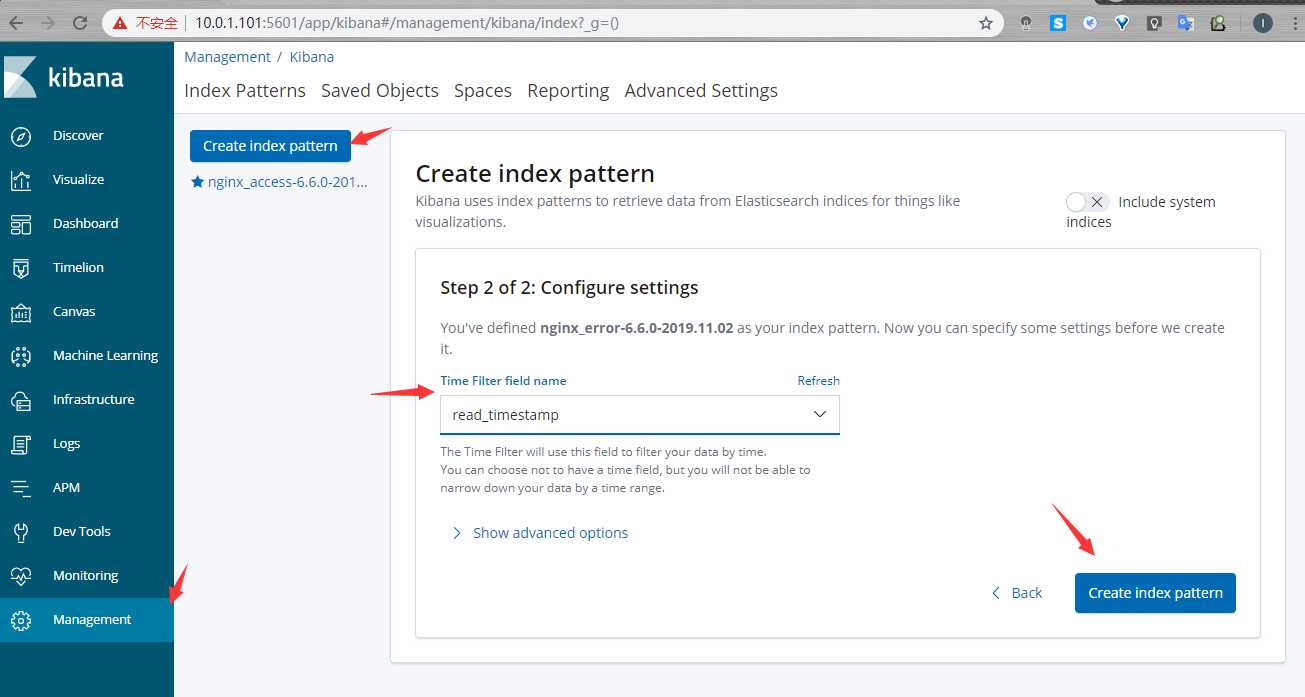
- index: "nginx_error-%{[beat.version]}-%{+yyyy.MM.dd}"
when.contains:
fileset.name: "error"
setup.template.name: "nginx"
setup.template.pattern: "nginx_*"
setup.template.enabled: false
setup.template.overwrite: true
[root@web02 ~]#
#filebeat modules配置
#使用nginx模版配置需要安装2个插件,默认从官网下载速度太慢,可以提前下载然后离线安装
https://www.elastic.co/guide/en/elasticsearch/plugins/6.6/ingest-geoip.html
https://www.elastic.co/guide/en/elasticsearch/plugins/6.6/plugin-management-custom-url.html
在线安装:
#elast01操作
[root@elast01 ~]# /usr/share/elasticsearch/bin/elasticsearch-plugin install ingest-user-agent
[root@elast01 ~]# /usr/share/elasticsearch/bin/elasticsearch-plugin install ingest-geoip
离线安装:
[root@elast01 tools]# wget https://artifacts.elastic.co/downloads/elasticsearch-plugins/ingest-user-agent/ingest-user-agent-6.6.0.zip
[root@elast01 tools]# wget https://artifacts.elastic.co/downloads/elasticsearch-plugins/ingest-geoip/ingest-geoip-6.6.0.zip
[root@elast01 ~]# /usr/share/elasticsearch/bin/elasticsearch-plugin install file:///server/tools/ingest-geoip-6.6.0.zip
[root@elast01 ~]# /usr/share/elasticsearch/bin/elasticsearch-plugin install file:///server/tools/ingest-user-agent-6.6.0.zip
[root@elast01 ~]# systemctl restart elasticsearch.service
注意:6.7之后这两个插件默认集成到了elasticsearch,不需要单独安装了
#激活nginx模块:
#web02操作
[root@web02 ~]# filebeat modules enable nginx
[root@web02 ~]# grep -Ev "#|^$" /etc/filebeat/modules.d/nginx.yml
- module: nginx
access:
enabled: true
var.paths: ["/var/log/nginx/access.log"]
error:
enabled: true
var.paths: ["/var/log/nginx/error.log"]
[root@web02 ~]# filebeat modules list
Enabled:
nginx
#修改nginx日志为默认日志
[root@web02 ~]# grep -Ev "#|^$" /etc/nginx/nginx.conf
user nginx;
worker_processes 1;
error_log /var/log/nginx/error.log warn;
pid /var/run/nginx.pid;
events {
worker_connections 1024;
}
http {
include /etc/nginx/mime.types;
default_type application/octet-stream;
log_format main ‘$remote_addr - $remote_user [$time_local] "$request" ‘
‘$status $body_bytes_sent "$http_referer" ‘
‘"$http_user_agent" "$http_x_forwarded_for"‘;
access_log /var/log/nginx/access.log main;
sendfile on;
keepalive_timeout 65;
include /etc/nginx/conf.d/*.conf;
}
[root@web02 ~]# echo > /var/log/nginx/access.log
[root@web02 ~]# echo > /var/log/nginx/error.log
[root@web02 ~]# systemctl restart nginx
[root@web02 ~]# systemctl restart filebeat
[root@elast01 kibana]# filebeat setup
Loaded index template
Loading dashboards (Kibana must be running and reachable)
Loaded dashboards
Loaded machine learning job configurations
[root@elast01 kibana]#
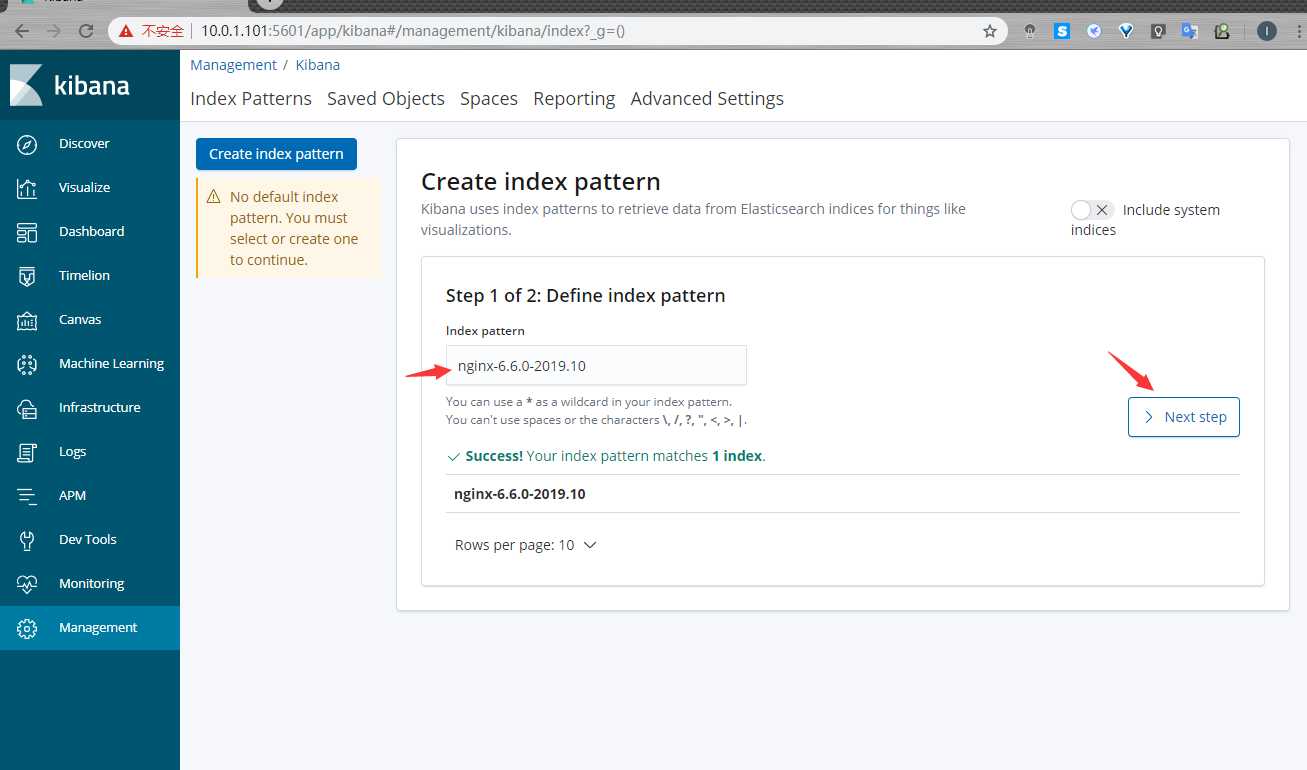
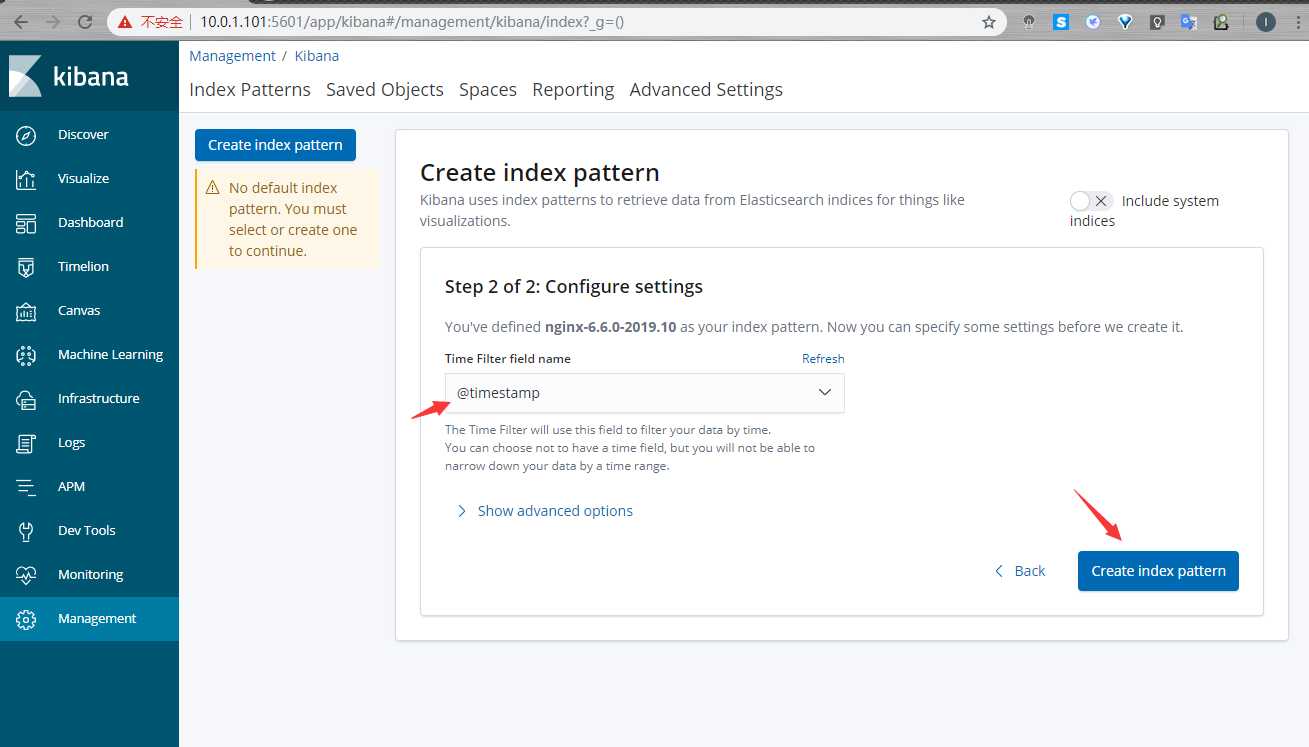
默认如果使用filbeat模版导入视图会把所有的服务都导入进去,而我们实际上并不需要这么多视图,
而且默认的视图模版只能匹配filebeat-*开头的索引,所以这里我们有2个需要需要解决:
1.通过一定处理只导入我们需要的模版
2.导入的视图模版索引名称可以自定义
解决方法:
1.备份一份filebeat的kibana视图,删除不需要的视图模版文件
2.修改视图文件里默认的索引名称为我们需要的索引名称
[root@elast01 ~]# cp -a /usr/share/filebeat/kibana /root/
[root@elast01 ~]# cd /root/kibana/
[root@elast01 kibana]# rm -rf 5
[root@elast01 kibana]# cd 6/dashboard/
[root@elast01 dashboard]# find . -type f ! -name "*nginx*"|xargs rm -rf
[root@elast01 dashboard]# rm -rf ml-nginx-*
[root@elast01 dashboard]# ll
total 24
-rw-r--r-- 1 root root 6704 Jan 24 2019 Filebeat-nginx-logs.json
-rw-r--r-- 1 root root 15348 Jan 24 2019 Filebeat-nginx-overview.json
[root@elast01 dashboard]#
#替换索引名称
[root@elast01 dashboard]# sed -i ‘s#filebeat\-\*#nginx\-\*#g‘ Filebeat-nginx-overview.json
[root@elast01 dashboard]# cd ../index-pattern/
[root@elast01 index-pattern]# sed -i ‘s#filebeat\-\*#nginx\-\*#g‘ filebeat.json
#导入视图
[root@elast01 ~]# filebeat setup --dashboards -E setup.dashboards.directory=/root/kibana/
#web02操作
#修改filebeat配置文件
[root@web02 ~]# cat /etc/filebeat/filebeat.yml
filebeat.config.modules:
path: ${path.config}/modules.d/*.yml
reload.enabled: true
setup.kibana:
host: "10.0.1.101:5601"
output.elasticsearch:
hosts: ["10.0.1.101:9200"]
indices:
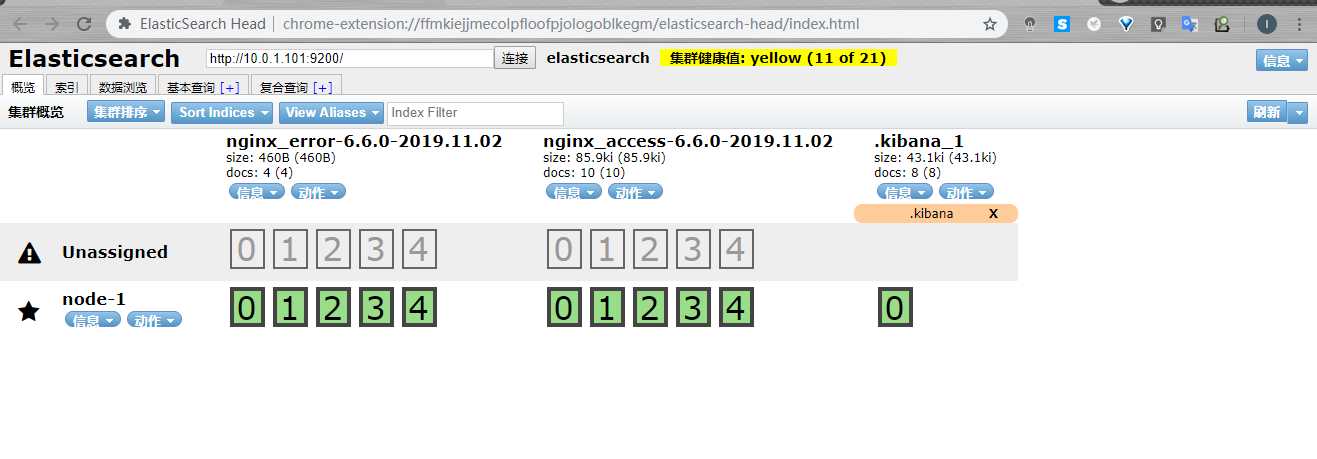
- index: "nginx-access-%{[beat.version]}-%{+yyyy.MM.dd}"
when.contains:
fileset.name: "access"
- index: "nginx-error-%{[beat.version]}-%{+yyyy.MM.dd}"
when.contains:
fileset.name: "error"
setup.template.name: "nginx"
setup.template.pattern: "nginx-*"
setup.template.enabled: false
setup.template.overwrite: true
[root@web02 ~]# systemctl restart filebeat
如果使用redis作为缓存
可以将不同的日志类型单独写成一个键,这样好处是清晰,但是缺点是logstash写起来起来复杂
也可以将所有的日志全部写入到一个键中,然后靠后端的logstash去过滤处理。
#安装redis
[root@elast01 ~]# yum -y install redis
[root@elast01 ~]# vim /etc/redis.conf
bind 10.0.1.101
[root@elast01 ~]# systemctl restart redis

#将nginx的日志调整为json格式
[root@elast01 ~]#  grep -Ev ‘#|^$‘ /etc/nginx/nginx.conf
user  nginx;
worker_processes  1;
error_log  /var/log/nginx/error.log warn;
pid        /var/run/nginx.pid;
events {
    worker_connections  1024;
}
http {
    include       /etc/nginx/mime.types;
    default_type  application/octet-stream;
    log_format json  ‘{ "time_local": "$time_local", ‘
                          ‘"remote_addr": "$remote_addr", ‘
                          ‘"referer": "$http_referer", ‘
                          ‘"request": "$request", ‘
                          ‘"status": $status, ‘
                          ‘"bytes": $body_bytes_sent, ‘
                          ‘"agent": "$http_user_agent", ‘
                          ‘"x_forwarded": "$http_x_forwarded_for", ‘
                          ‘"up_addr": "$upstream_addr",‘
                          ‘"up_host": "$upstream_http_host",‘
                          ‘"upstream_time": "$upstream_response_time",‘
                          ‘"request_time": "$request_time"‘
‘ }‘;
    access_log  /var/log/nginx/access.log  json;
    sendfile        on;
    keepalive_timeout  65;
    include /etc/nginx/conf.d/*.conf;
}
[root@elast01 ~]#
#修改filebeat写入到不同的key中
[root@elast01 ~]# cat /etc/filebeat/filebeat.yml
[root@elast01 ~]# cat /etc/filebeat/filebeat.yml
filebeat.inputs:
- type: log
enabled: true
paths:
- /var/log/nginx/access.log
json.keys_under_root: true
json.overwrite_keys: true
tags: ["access"]
- type: log
enabled: true
paths:
- /var/log/nginx/error.log
tags: ["error"]
setup.kibana:
host: "10.0.1.101:5601"
output.redis:
hosts: ["10.0.1.101"]
keys:
- key: "nginx_access"
when.contains:
tags: "access"
- key: "nginx_error"
when.contains:
tags: "error"
[root@elast01 ~]# systemctl restart filebeat
#进行压测
[root@elast01 ~]# ab -n 1000 -c 1000 http://10.0.1.101/
[root@elast01 ~]# ab -n 1000 -c 1000 http://10.0.1.101/nginx
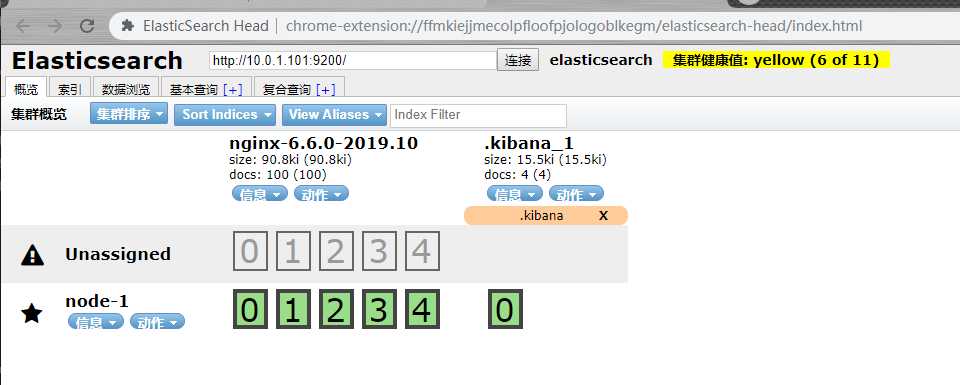
10.0.1.101:6379> KEYS *
1) "nginx_error"
2) "nginx_access"
10.0.1.101:6379>
#安装logstash
[root@elast01 tools]# rpm -ivh logstash-6.6.0.rpm
#配置logstash读取不同的key
[root@elast01 ~]# cat /etc/logstash/conf.d/redis.conf
input {
redis {
host => "10.0.1.101"
port => "6379"
db => "0"
key => "nginx_access"
data_type => "list"
}
redis {
host => "10.0.1.101"
port => "6379"
db => "0"
key => "nginx_error"
data_type => "list"
}
}
filter {
mutate {
convert => ["upstream_time", "float"]
convert => ["request_time", "float"]
}
}
output {
stdout {}
if "access" in [tags] {
elasticsearch {
hosts => "http://10.0.1.101:9200"
manage_template => false
index => "nginx_access-%{+yyyy.MM}"
}
}
if "error" in [tags] {
elasticsearch {
hosts => "http://10.0.1.101:9200"
manage_template => false
index => "nginx_error-%{+yyyy.MM}"
}
}
}
[root@elast01 ~]#
#启动logstash
[root@elast01 ~]# /usr/share/logstash/bin/logstash -f /etc/logstash/conf.d/redis.conf
#filebeat收集日志写入到一个key中
[root@elast01 ~]# cat /etc/filebeat/filebeat.yml
filebeat.inputs:
- type: log
  enabled: true
  paths:
    - /var/log/nginx/access.log
  json.keys_under_root: true
  json.overwrite_keys: true
  tags: ["access"]

- type: log
  enabled: true
  paths:
    - /var/log/nginx/error.log
  tags: ["error"]

setup.kibana:
  host: "10.0.1.101:5601"

output.redis:
  hosts: ["10.0.1.101"]
  key: "nginx"
[root@elast01 ~]# systemctl restart filebeat

#logstash根据tag区分一个key里的不同日志
[root@elast01 ~]# cat /etc/logstash/conf.d/redis.conf
input {
  redis {
    host => "10.0.1.101"
    port => "6379"
    db => "0"
    key => "nginx"
    data_type => "list"
  }
}

filter {
  mutate {
    convert => ["upstream_time", "float"]
    convert => ["request_time", "float"]
  }
}

output {
    stdout {}
    if "access" in [tags] {
      elasticsearch {
        hosts => "http://10.0.1.101:9200"
        manage_template => false
        index => "nginx_access-%{+yyyy.MM}"
      }
    }
    if "error" in [tags] {
      elasticsearch {
        hosts => "http://10.0.1.101:9200"
        manage_template => false
        index => "nginx_error-%{+yyyy.MM}"
      }
    }
}
[root@elast01 ~]#

#启动logstash
[root@elast01 ~]# /usr/share/logstash/bin/logstash -f /etc/logstash/conf.d/redis.conf
标签:logstash tip index 根据 stream add head gen x86_64
原文地址:https://www.cnblogs.com/opesn/p/12994184.html