标签:公式 hub otl math log ima wan pos lis
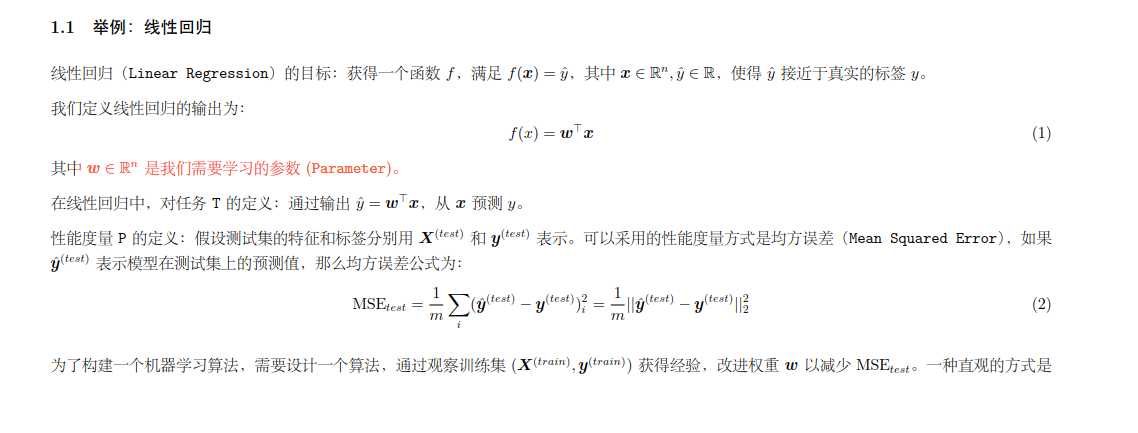
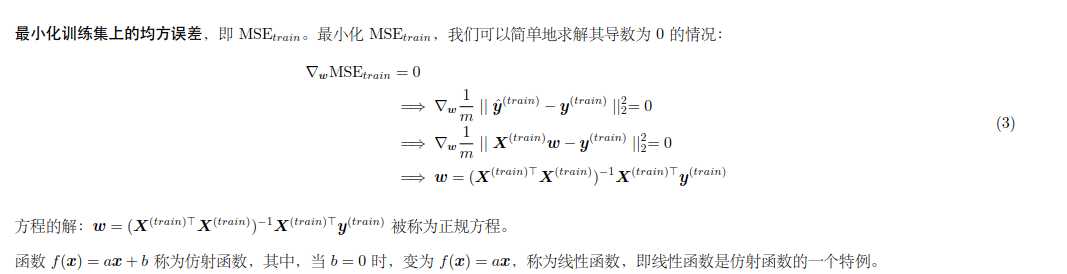
线性回归知识(参考链接)
代码实现
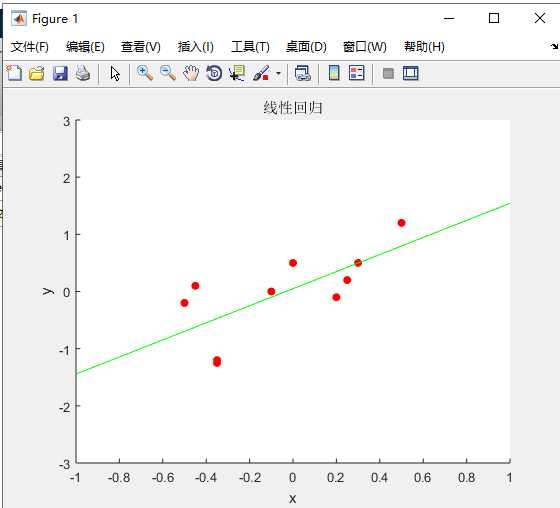
matlab
x(1:10,1) = [-0.5,-0.45,-0.35,-0.35,-0.1,0,0.2,0.25,0.3,0.5];
x(1:10,2) = 1;
y = [-0.2,0.1,-1.25,-1.2,0,0.5,-0.1,0.2,0.5,1.2];
y = transpose(y);
figure;
hold on
scatter(x(:,1),y,‘r‘,‘filled‘);
axis([-1.0,1.0,-3.0,3.0])
%求权重
x_T = transpose(x);
w = inv(x_T*x)*x_T*y;
hat_y = x*w;
disp(‘权重‘); disp(w);
x1 = linspace(-1,1,50);
hat_y = x1*w(1)+w(2);
plot(x1,hat_y,‘g‘);
axis([-1.0,1.0,-3,3]);
title(‘线性回归‘)
xlabel(‘x‘)
ylabel(‘y‘)
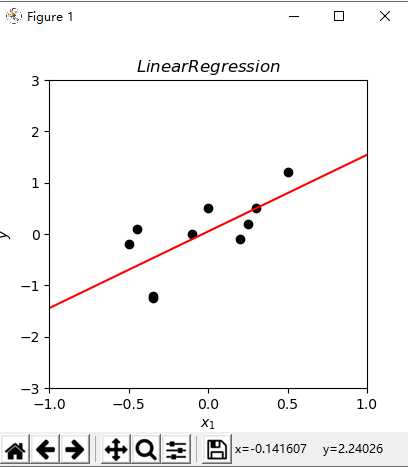
Python
 1 import numpy as np
 2 import math
 3 import matplotlib.pyplot as plt
 4  X = np.hstack((np.array([[-0.5,-0.45,-0.35,-0.35,-0.1,0,0.2,0.25,0.3,0.5]]).reshape(-1, 1), np.ones((10,1))*1))
 5 y = np.array([-0.2,0.1,-1.25,-1.2,0,0.5,-0.1,0.2,0.5,1.2]).reshape(-1,1)
 6 # 用公式求权重
 7 w = np.linalg.inv(X.T.dot(X)).dot(X.T).dot(y)
 8 hat_y = X.dot(w)
 9 print("Weight:{}".format{list(w)})
10 x = np.linspace(-1, 1, 50)
11 hat_y = x * w[0] + w[1]
12 plt.figure(figsize=(4,4))
13 plt.xlim(-1.0, 1.0)
14 plt.xticks(np.linspace(-1.0, 1.0, 5))
15 plt.ylim(-3, 3)
16 plt.plot(x, hat_y, color=‘red‘)
17 plt.scatter(X[:,0], y[:,0], color=‘black‘)
18 plt.xlabel(‘$x_1$‘)
19 plt.ylabel(‘$y$‘)
20 plt.title(‘$Linear Regression$‘)
21 plt.show()
标签:公式 hub otl math log ima wan pos lis
原文地址:https://www.cnblogs.com/andrew-address/p/13057512.html