标签:定义 load fun 返回 相关性 sum art read 技术
import numpy as np
import pandas as pd
import matplotlib.pyplot as plt
from scipy import stats
import math
df=pd.read_csv("hfda_ch10_employees.csv")
#print(df)
y = df.requested #加薪()
x = df.received #申请
#用于得出斜率和截距画出线性图
slope, intercept, r, p, std_err = stats.linregress(x, y)
#stats.linregress 固定格式,返回5个参数分别是
#slope(斜率),intercept(截距), #r(相关性),。。。。
#定义对象,内容为线性方程式
def myfunc(x):
return slope * x + intercept
#计算均方根误差
from math import sqrt
error=[]
for i in range(len(y)):
error.append(y[i] - x[i])
squaredError = []
absError = []
for val in error:
squaredError.append(val * val) #a-b之差平方
absError.append(abs(val)) #误差绝对值
RMSE = sqrt(sum(squaredError) / len(squaredError)) #均方差值
def myfunc2(x):
return slope * x + intercept+RMSE
def myfunc3(x):
return slope * x + intercept-RMSE
mymodel = list(map(myfunc, x))
mymodel2 = list(map(myfunc2, x))
mymodel3 = list(map(myfunc3, x))
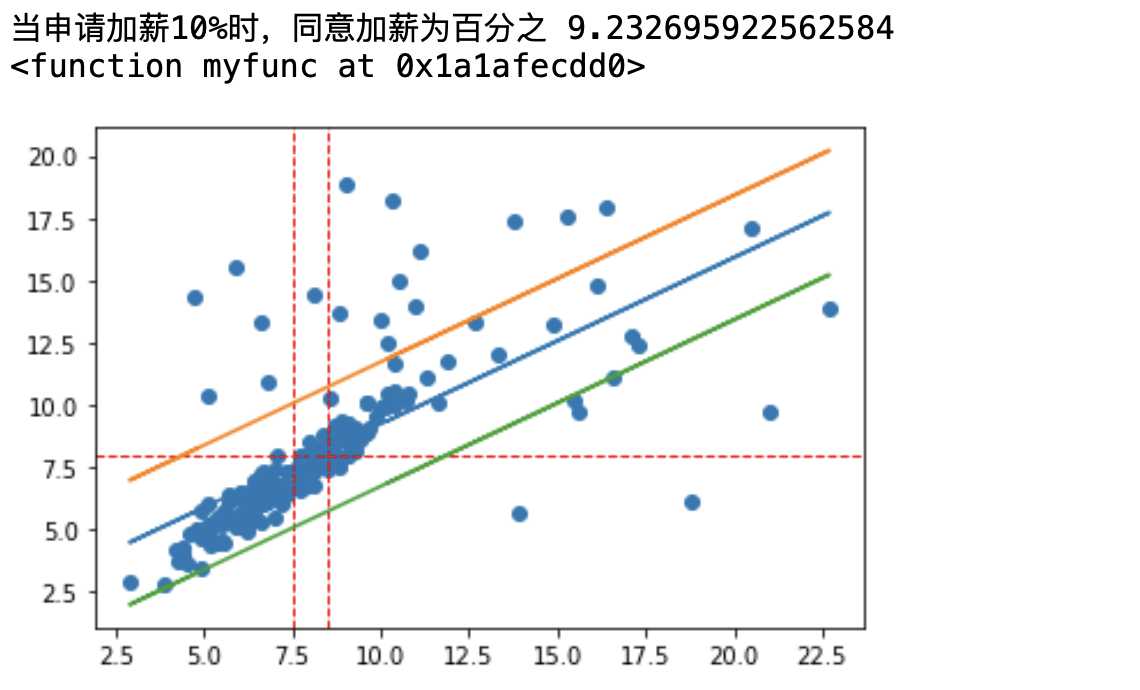
#当申请加薪为10%
speed = myfunc(10)
print("当申请加薪10%时,同意加薪为百分之",speed)
print(myfunc)
plt.axhline(y=8.0, c="r", ls="--", lw=1)
plt.axvline(x=7.5, c="r", ls="--", lw=1)
plt.axvline(x=8.5, c="r", ls="--", lw=1)
plt.scatter(x,y) #散点图
plt.plot(x, mymodel) #线性回归
plt.plot(x, mymodel2)
plt.plot(x, mymodel3)
plt.show()
标签:定义 load fun 返回 相关性 sum art read 技术
原文地址:https://www.cnblogs.com/big-tree/p/13324535.html