标签:grafana car machines 使用 一个 获取 yaml 运维 源码

本文主要阐述如何配置GitLabRunner和GitLabCI/CD流水线的数据采集与监控。
GitLab Runner本地具有Prometheus指标,可以访问嵌入式HTTP服务器,通过/metrics 路径公开。该服务器(如果已启用)可以被Prometheus监视系统抓取,或通过任何其他HTTP客户端进行访问。
公开的信息包括:
这些指标是运维人员监视和了解GitLab Runners的一种方式。例如,您可能会对Runner主机上的平均负载和作业数量感兴趣。
Runner默认是没有开启内置的HTTP服务,可以通过两种方式配置指标HTTP服务器:
config.toml文件中配置全局选项 listen_address。--listen-address命令选项。在这里我直接修改的config.toml文件,内容参考如下:
$ cat config.toml
listen_address = "[::]:9252"
concurrent = 10
check_interval = 30
log_level = "info"
修改Runner配置后需要重启, 随后通过netstat查看监听的端口。
bash-5.0$ netstat -anlpt | grep 9252
tcp        0      0 :::9252                 :::*                    LISTEN      1/gitlab-runner
tcp        0      0 ::ffff:10.244.0.102:9252 ::ffff:10.244.0.1:35880 ESTABLISHED 1/gitlab-runner
tcp        0      0 ::ffff:10.244.0.102:9252 ::ffff:10.244.0.107:36184 ESTABLISHED 1/gitlab-runner
tcp 0 0 ::ffff:10.244.0.102:9252 ::ffff:10.244.0.103:57404 ESTABLISHED 1/gitlab-runner当9252端口被监听,内容的HTTP服务器就启动了。此时我们可以获取指标数据。
curl 127.0.0.1:9252/metrics

# HELP gitlab_runner_api_request_statuses_total The total number of api requests, partitioned by runner, endpoint and status.
# TYPE gitlab_runner_api_request_statuses_total counter
gitlab_runner_api_request_statuses_total{endpoint="request_job",runner="6i2MzLuX",status="204"} 178
# HELP gitlab_runner_autoscaling_machine_creation_duration_seconds Histogram of machine creation time.
# TYPE gitlab_runner_autoscaling_machine_creation_duration_seconds histogram
gitlab_runner_autoscaling_machine_creation_duration_seconds_bucket{executor="docker+machine",le="30"} 0
gitlab_runner_autoscaling_machine_creation_duration_seconds_bucket{executor="docker+machine",le="37.5"} 0
gitlab_runner_autoscaling_machine_creation_duration_seconds_bucket{executor="docker+machine",le="46.875"} 0
gitlab_runner_autoscaling_machine_creation_duration_seconds_bucket{executor="docker+machine",le="58.59375"} 0
gitlab_runner_autoscaling_machine_creation_duration_seconds_bucket{executor="docker+machine",le="73.2421875"} 0
gitlab_runner_autoscaling_machine_creation_duration_seconds_bucket{executor="docker+machine",le="91.552734375"} 0
gitlab_runner_autoscaling_machine_creation_duration_seconds_bucket{executor="docker+machine",le="114.44091796875"} 0
gitlab_runner_autoscaling_machine_creation_duration_seconds_bucket{executor="docker+machine",le="143.0511474609375"} 0
gitlab_runner_autoscaling_machine_creation_duration_seconds_bucket{executor="docker+machine",le="178.81393432617188"} 0
gitlab_runner_autoscaling_machine_creation_duration_seconds_bucket{executor="docker+machine",le="223.51741790771484"} 0
gitlab_runner_autoscaling_machine_creation_duration_seconds_bucket{executor="docker+machine",le="+Inf"} 0
gitlab_runner_autoscaling_machine_creation_duration_seconds_sum{executor="docker+machine"} 0
gitlab_runner_autoscaling_machine_creation_duration_seconds_count{executor="docker+machine"} 0
gitlab_runner_autoscaling_machine_creation_duration_seconds_bucket{executor="docker-ssh+machine",le="30"} 0
gitlab_runner_autoscaling_machine_creation_duration_seconds_bucket{executor="docker-ssh+machine",le="37.5"} 0
gitlab_runner_autoscaling_machine_creation_duration_seconds_bucket{executor="docker-ssh+machine",le="46.875"} 0
gitlab_runner_autoscaling_machine_creation_duration_seconds_bucket{executor="docker-ssh+machine",le="58.59375"} 0
gitlab_runner_autoscaling_machine_creation_duration_seconds_bucket{executor="docker-ssh+machine",le="73.2421875"} 0
gitlab_runner_autoscaling_machine_creation_duration_seconds_bucket{executor="docker-ssh+machine",le="91.552734375"} 0
gitlab_runner_autoscaling_machine_creation_duration_seconds_bucket{executor="docker-ssh+machine",le="114.44091796875"} 0
gitlab_runner_autoscaling_machine_creation_duration_seconds_bucket{executor="docker-ssh+machine",le="143.0511474609375"} 0
gitlab_runner_autoscaling_machine_creation_duration_seconds_bucket{executor="docker-ssh+machine",le="178.81393432617188"} 0
gitlab_runner_autoscaling_machine_creation_duration_seconds_bucket{executor="docker-ssh+machine",le="223.51741790771484"} 0
gitlab_runner_autoscaling_machine_creation_duration_seconds_bucket{executor="docker-ssh+machine",le="+Inf"} 0
gitlab_runner_autoscaling_machine_creation_duration_seconds_sum{executor="docker-ssh+machine"} 0
gitlab_runner_autoscaling_machine_creation_duration_seconds_count{executor="docker-ssh+machine"} 0
# HELP gitlab_runner_autoscaling_machine_states The current number of machines per state in this provider.接下来我们配置Prometheus对数据收集,然后通过Grafana展示。更新Prometheus配置文件。
- job_name: ‘gitlab-runner‘
      metrics_path: ‘/metrics‘
      scheme: http
      bearer_token: bearer_token
      static_configs: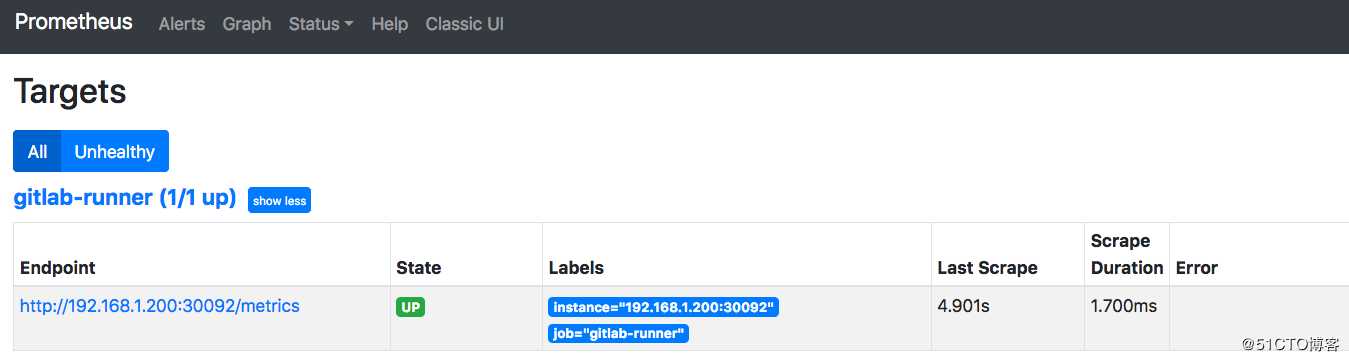
- targets: [‘192.168.1.200:30092‘]然后,访问http://192.168.1.200:30003/new/targets, 目标为up。
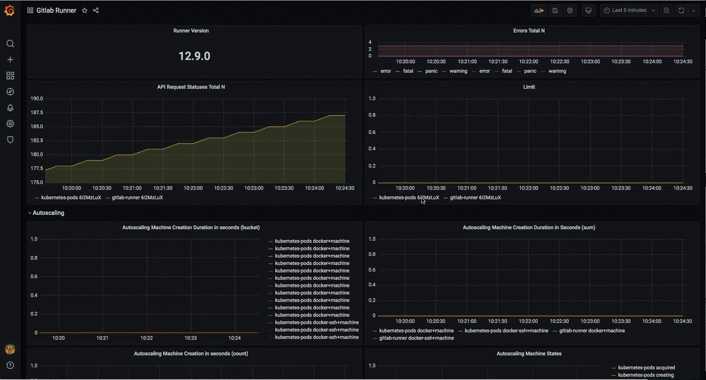
最后,我们找一个Grafana模板展示数据。https://grafana.com/grafana/dashboards/9631 下载JSON文件,导入。
有时候对于运维管理人员来说,我们需要看到整个平台的流水线状态。类似于Jenkins一样有统一的面板展示。在GitLab中每个项目都有CI/CD数据的展示。需要进入每个项目才能看到,这样非常不便。 在这里我们安装配置:gitlab-ci-pipelines-exporter来实现对GitLabCI流水线状态的展示。
首先我们需要下载chart源码,然后修改values.yaml中的GitLab配置。 配置GitLab服务器的地址和Token、需要同步的项目。
git clone https://github.com/mvisonneau/gitlab-ci-pipelines-exporter.git

vim chart/values.yaml

##关键配置
## Actual configuration of the exporter
##
config:
  # # Full configuration syntax reference available here:
  # # https://github.com/mvisonneau/gitlab-ci-pipelines-exporter/blob/master/docs/configuration_syntax.md
  gitlab:
    url: http://192.168.1.200:30088
  #   # You can also configure the token using --gitlab-token
  #   # or the $GCPE_GITLAB_TOKEN environment variable
    token: Z-smAyB8pFyttu6D2d_J
  # projects:
  #   - name: foo/project
  #   - name: bar/project
  wildcards:
    - owner:
      name: cidevops
      kind: group

helm install gitlabci-pipline-exporter --namespace gitlab-runner ./chart配置Prometheus:修改配置文件添加目标。
    - job_name: ‘gitlab-runner-ci-pipeline‘
      metrics_path: ‘/metrics‘
      scheme: http
      bearer_token: bearer_token
      static_configs: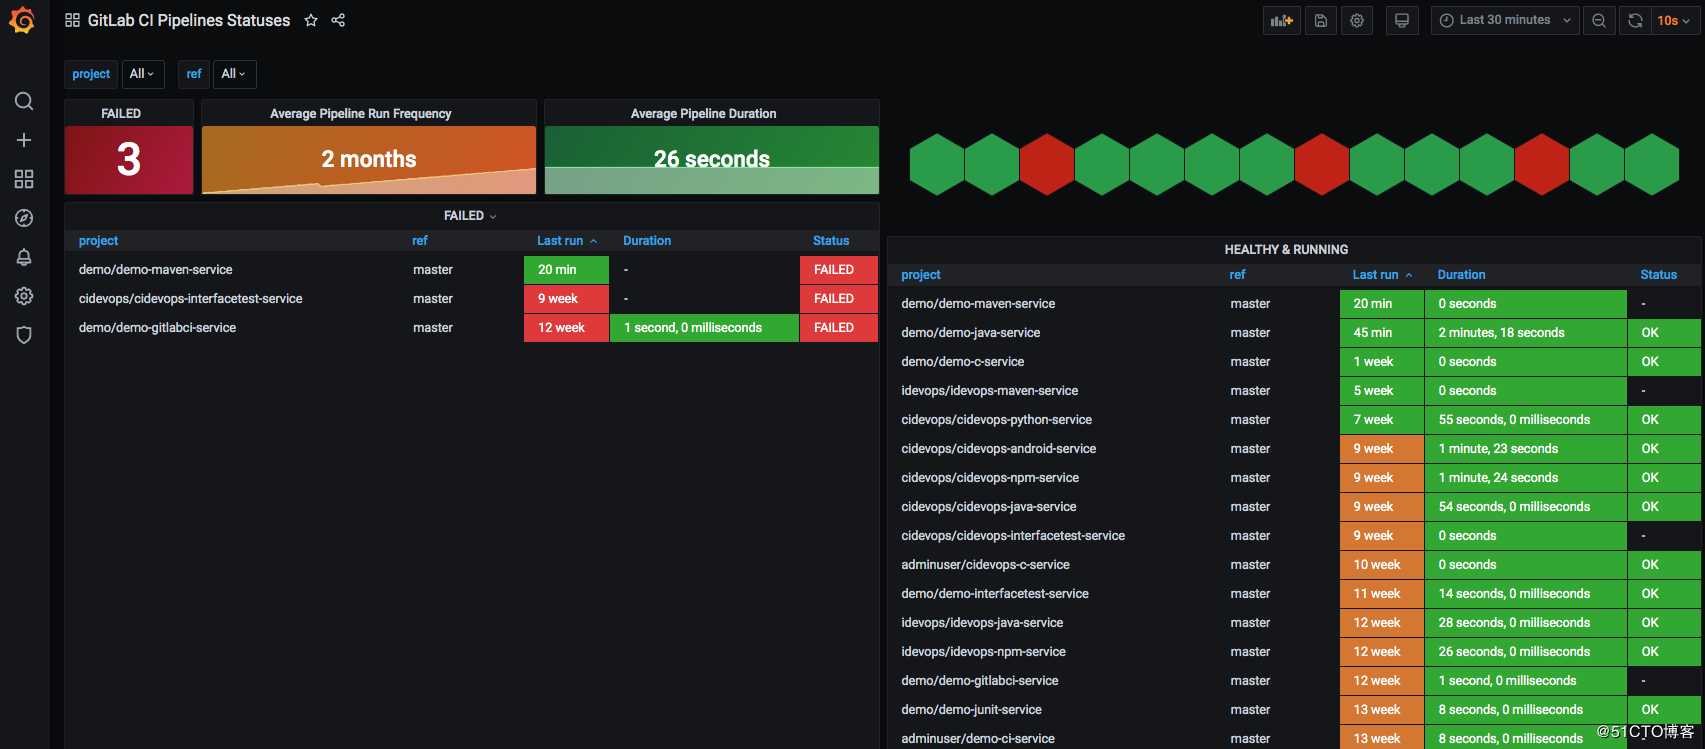
- targets: [‘10.1.234.132:80‘]添加Grafana面板https://grafana.com/grafana/dashboards/10620。下载JSON文件然导入。最终效果如下:
标签:grafana car machines 使用 一个 获取 yaml 运维 源码
原文地址:https://blog.51cto.com/11064706/2513610