标签:标记 and app for 迭代 测线 mamicode pen otl
import tensorflow as tf
import matplotlib.pylab as plt
import numpy as np

# 调用数据
boston_house = tf.keras.datasets.boston_housing
(train_x, train_y), (test_x, test_y) = boston_house.load_data(test_split=0.1)
room_num = train_x[:, 5]                # 房间数
price = train_y                         # 标记值
w = tf.Variable(np.random.randn())      # 系数W
b = tf.Variable(np.random.randn())      # 偏置b
iter = 1000                             # 迭代次数
learn_rate = 0.0001                     # 学习率
loss_list = []                          #   存放loss值
for i in range(iter):
    with tf.GradientTape() as tape:
        price_pre = w * room_num + b
        loss = pow(tf.reduce_mean(price - price_pre), 2) / 2
    dloss_dw, dloss_db = tape.gradient(loss, [w, b])                #   求偏导
    w.assign_sub(learn_rate * dloss_dw)                             #   更新参数w
    w.assign_sub(learn_rate * dloss_db)
    if i % 100 == 0:
        print(‘i:‘, i)
        print(‘loss:{},w:{}‘.format(loss, w))
        loss_list.append(loss)

plt.rcParams["font.family"] = ‘SimHei‘              # 将字体改为中文
plt.rcParams[‘axes.unicode_minus‘] = False          # 设置了中文字体默认后,坐标的"-"号无法显示,设置这个参数就可以避免
plt.subplot(221)
plt.plot(loss_list, label=‘训练集损失值‘)
plt.legend()

plt.subplot(223)
test_room = test_x[:,5]
pre_y = w * test_room+ b
plt.plot(test_room, pre_y, label=‘预测线‘)
plt.scatter(test_room ,test_y,s = 2)
plt.legend()
plt.show()
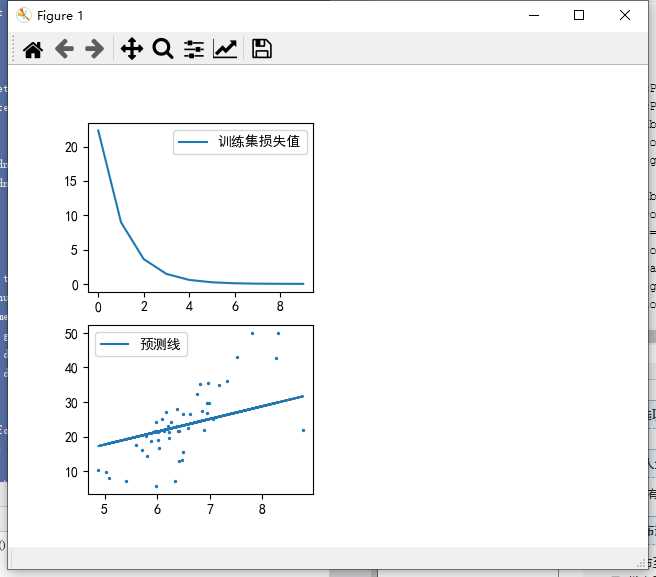
tensorflow2.0——波士顿房价数据与房间数关系的预测
标签:标记 and app for 迭代 测线 mamicode pen otl
原文地址:https://www.cnblogs.com/cxhzy/p/13409854.html