标签:mission value dig mis span ica color variable script
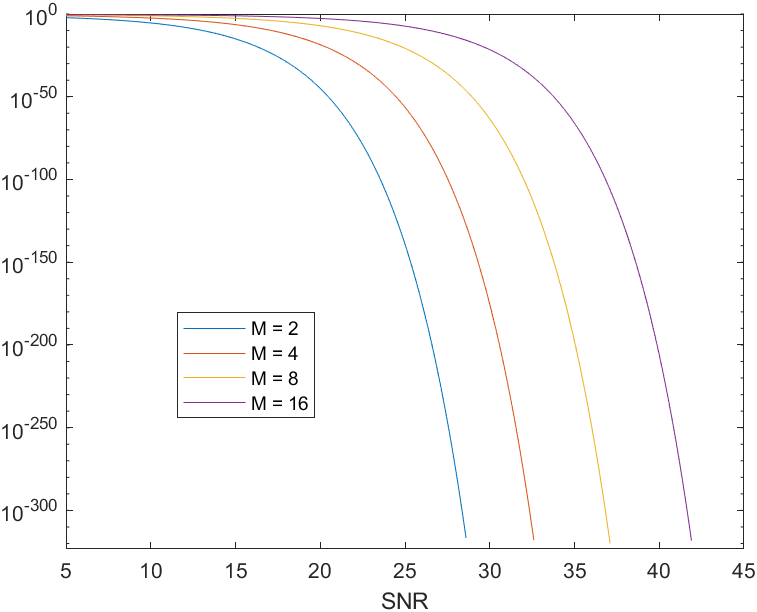
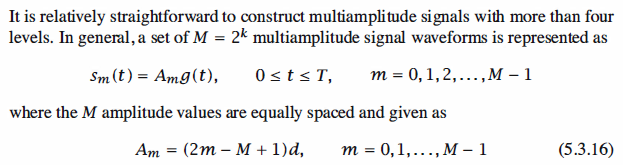
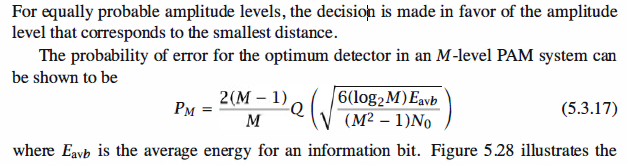
Signal Waveforms with Multiple Amplitude Levels
Matlab Coding,
1 % MATLAB script for the probability of a symbol error for M = 2, 4, 8, 16
2 echo on 3 SNRindB2=5:0.1:50; 4 j = 1; 5 for M = [2,4,8,16] 6 hold 7 for i=1:length(SNRindB2) 8 SNR_per_bit=exp(SNRindB2(i)*log(10)/10); 9 % theoretical error rate 10 theo_err_prb(i)=(2*(M-1)/M)*Qfunct(sqrt((6*log2(M)/(M^2-1))*SNR_per_bit)); 11 echo off; 12 end 13 D{j} = theo_err_prb; 14 j = j + 1; 15 end 16 echo on; 17 % Plotting commands follow. 18 hold 19 semilogy(SNRindB2,D{1}); 20 hold on 21 semilogy(SNRindB2,D{2}); 22 hold on 23 semilogy(SNRindB2,D{3}); 24 hold on 25 semilogy(SNRindB2,D{4}); 26 xlabel(‘SNR‘)
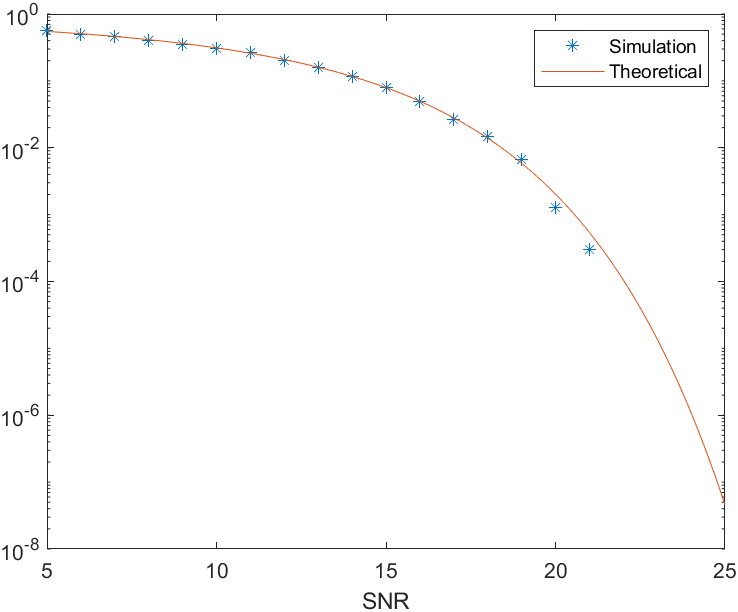
Simulation Result
 1 % MATLAB script for a M = 16 PAM 2 echo on
 3 SNRindB1=5:1:25;
 4 SNRindB2=5:0.1:25;
 5 M=16;
 6 for i=1:length(SNRindB1),
 7     % simulated error rate
 8     smld_err_prb(i)=smldPe59(SNRindB1(i));
 9     echo off;
10 end;
11 echo on ;
12 for i=1:length(SNRindB2),
13     SNR_per_bit=exp(SNRindB2(i)*log(10)/10);
14     % theoretical error rate
15     theo_err_prb(i)=(2*(M-1)/M)*Qfunct(sqrt((6*log2(M)/(M^2-1))*SNR_per_bit));
16     echo off;
17 end;
18 echo on;

19 % Plotting commands follow.
20 semilogy(SNRindB1,smld_err_prb,‘*‘);
21 hold
22 semilogy(SNRindB2,theo_err_prb);
23 xlabel(‘SNR‘)
24
25
26 function [p]=smldPe59(snr_in_dB)
27 % [p]=smldPe59(snr_in_dB)
28 %        SMLDPE59  simulates the error probability for the given
29 %           snr_in_dB, signal-to-noise ratio in dB.
30 M=16;                       % 16-ary PAM
31 d=1;
32 SNR=exp(snr_in_dB*log(10)/10);           % signal-to-noise ratio per bit
33 sgma=sqrt((85*d^2)/(8*SNR));           % sigma, standard deviation of noise
34 N=10000;                    % number of symbols being simulated

35 % generation of the data source
36 for i=1:N,
37    temp=rand;                     % a uniform random variable over (0,1)
38    index=floor(M*temp);               % The index is an integer from 0 to M-1, where
39                                   % all the possible values are equally likely.
40    dsource(i)=index;
41 end;

42 % detection, and probability of error calculation
43 numoferr=0;
44 for i=1:N,
45   % matched filter outputs
46   % (2*dsource(i)-M+1)*d is the mapping to the 16-ary constellation.
47   r=(2*dsource(i)-M+1)*d+gngauss(sgma);

48   % the detector
49   if (r>(M-2)*d),
50     decis=15;
51   elseif (r>(M-4)*d),
52     decis=14;
53   elseif (r>(M-6)*d),
54     decis=13;
55   elseif (r>(M-8)*d),
56     decis=12;
57   elseif (r>(M-10)*d),
58     decis=11;
59   elseif (r>(M-12)*d),
60     decis=10;
61   elseif (r>(M-14)*d),
62     decis=9;
63   elseif (r>(M-16)*d),
64     decis=8;
65   elseif (r>(M-18)*d),
66     decis=7;
67   elseif (r>(M-20)*d),
68     decis=6;
69   elseif (r>(M-22)*d),
70     decis=5;
71   elseif (r>(M-24)*d),
72     decis=4;
73   elseif (r>(M-26)*d),
74     decis=3;
75   elseif (r>(M-28)*d),
76     decis=2;
77   elseif (r>(M-30)*d),
78     decis=1;
79   else
80     decis=0;
81   end;

82   if (decis~=dsource(i)),   % If it is an error, increase the error counter.
83     numoferr=numoferr+1;
84   end;
85 end;

86 p=numoferr/N;               % probability of error estimate


Simulation Result
Reference,
1. <<Contemporary Communication System using MATLAB>> - John G. Proakis
标签:mission value dig mis span ica color variable script
原文地址:https://www.cnblogs.com/zzyzz/p/13642719.html