标签:near country sdi param map range path 全世界 lob
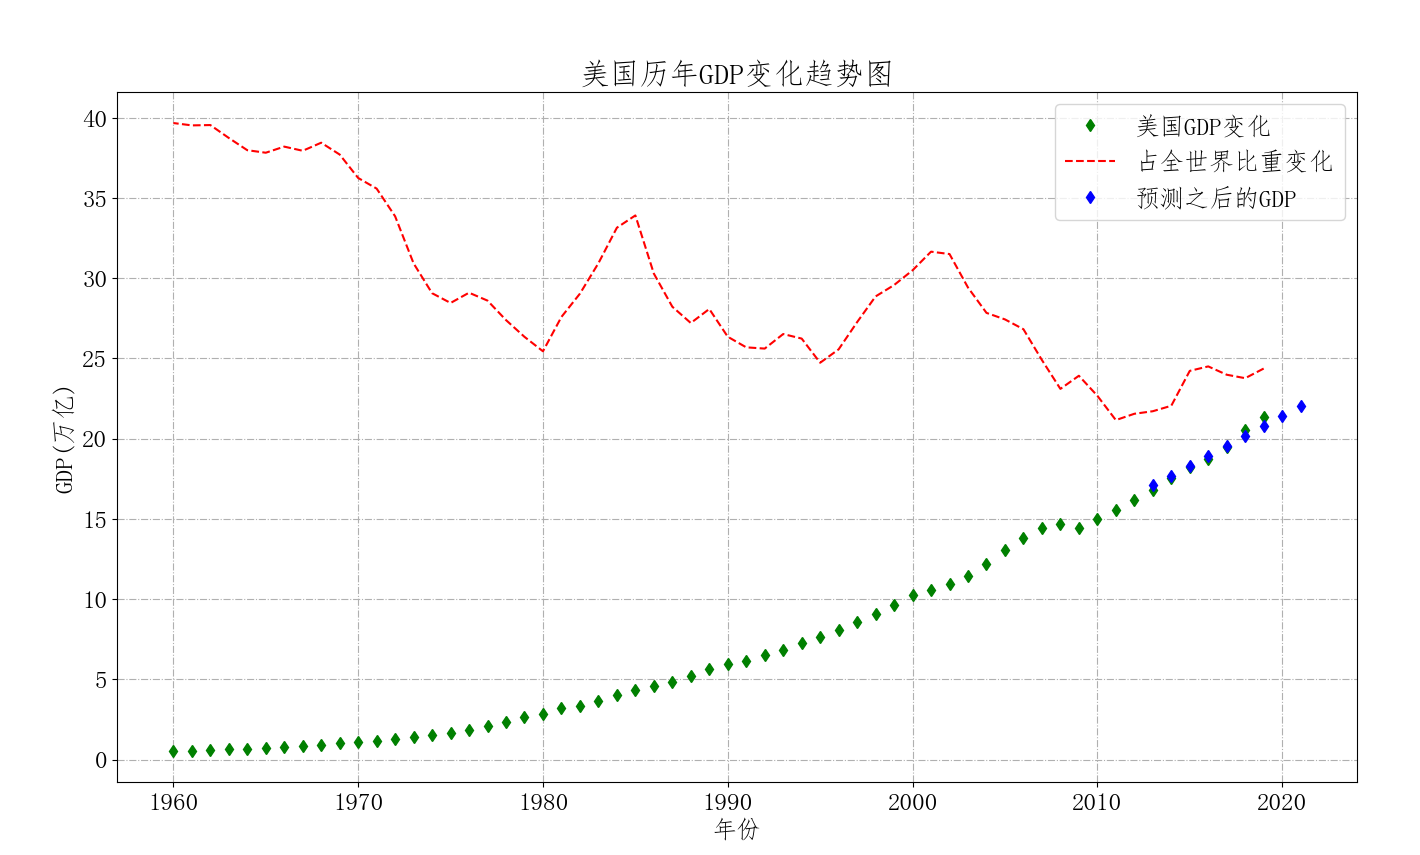
import requests
import openpyxl
import matplotlib.pyplot as pl
import numpy as np
from lxml import etree
from sklearn.preprocessing import PolynomialFeatures    #多项式
from sklearn.linear_model import LinearRegression       #线性回归


def get_html(url):
    content = requests.get(url)
    return content.text


def parse_content(content):
    e = etree.HTML(content)
    year_list = e.xpath(‘//tr/td[1]/text()‘)  # xpath表达式
    gdp_list = e.xpath(‘//tr/td[2]/text()‘)
    percent_list = e.xpath(‘//tr/td[3]/text()‘)

    year_list = list(filter(delete_char, year_list))

    year_list = list(map(int, year_list))
    gdp_list = list(map(extract_value, gdp_list))
    percent_list = list(map(delete_percent, percent_list))

    gdp_list = list(map(lambda x: x / 1000000000000, gdp_list))

    print(year_list)
    print(gdp_list)
    print(percent_list)
    return year_list, gdp_list, percent_list

    # save_data_to_excel(year_list,gdp_list,percent_list)


def extract_value(s):
    return int(s[s.find(‘(‘) + 1:s.rfind(‘)‘)].replace(‘,‘, ""))


def delete_percent(s):
    return float(s.replace(‘%‘, ""))


def save_data_to_excel(year_list, gdp_list, parcent_list):
    wk = openpyxl.Workbook()
    sheet = wk.active
    for i in range(0, 60):
        sheet.append([year_list[i], gdp_list[i], percent_list[i]])
    wk.save("gdp.xlsx")


def delete_char(s):
    s = s.strip()
    if s:
        return s.isdigit()
    else:
        return False


if __name__ == "__main__":
    print("Hello, World!")
    url = "https://www.kylc.com/stats/global/yearly_per_country/g_gdp/usa.html"
    content = get_html(url)
    year_list, gdp_list, percent_list = parse_content(content)

    pl.rcParams[‘font.sans-serif‘] = [‘FangSong‘]
    pl.rcParams.update({‘font.size‘: 18})
    pl.figure(figsize=(16, 9))
    pl.title("美国历年GDP变化趋势图")
    pl.grid(linestyle=‘-.‘)
    pl.xlabel("年份")
    pl.ylabel("GDP(万亿)")

    arr = np.array(list(zip(year_list, gdp_list, percent_list)))
    pl.plot(arr[:, [0]], arr[:, [1]], "dg", label="美国GDP变化")
    pl.plot(arr[:, [0]], arr[:, [2]], "--r", label="占全世界比重变化")
    # print(arr)

    # 预测
    test_data = np.array([2013, 2014, 2015, 2016, 2017, 2018, 2019,2020,2021]).reshape((9, 1))
    poly = PolynomialFeatures(degree=3)  # 3次多项式
    x_poly = poly.fit_transform(arr[7:, [0]])
    liner_reg = LinearRegression()
    liner_reg.fit(x_poly, arr[7:, [1]])  # 训练模型

    pred = liner_reg.predict(poly.fit_transform(test_data))  # 2013-2021年GDP值预测
    print(pred)
    pl.plot(test_data, pred, "db", label="预测之后的GDP")

    pl.legend()
    pl.show()
标签:near country sdi param map range path 全世界 lob
原文地址:https://www.cnblogs.com/ricoo/p/14129148.html