标签:lang new atp img range enter enumerate ret 使用
import numpy as np
import matplotlib.pyplot as plt
x = np.arange(-4, 5, 1)
x
# array([-4, -3, -2, -1, 0, 1, 2, 3, 4])
y = np.array((x >= -2) & (x <= 2), dtype=‘int‘)
y
# array([0, 0, 1, 1, 1, 1, 1, 0, 0])
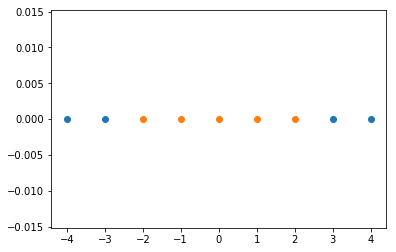
plt.scatter(x[y==0], [0]*len(x[y==0]))
plt.scatter(x[y==1], [0]*len(x[y==1]))
plt.show()
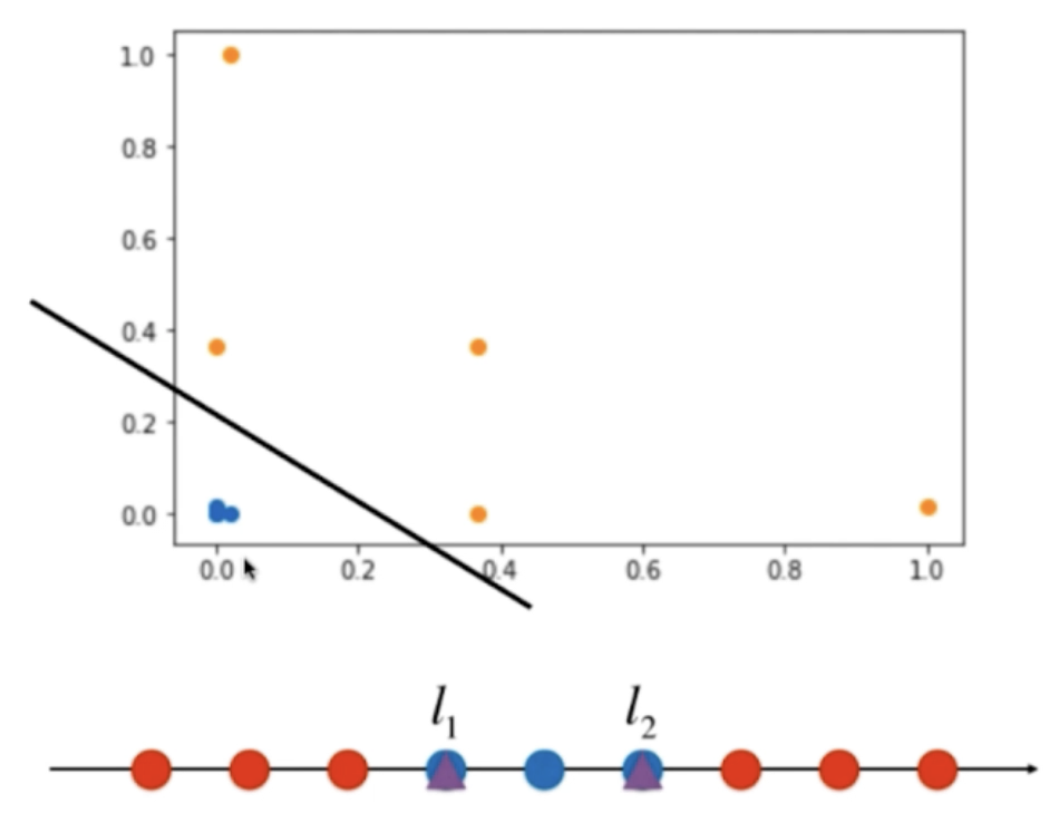
使用高斯核函数,让数据可分
def gaussian(x, l):
    gamma = 1.0
    return np.exp(-gamma * (x-l)**2)


l1, l2 = -1, 1

X_new = np.empty((len(x), 2))
for i, data in enumerate(x):
    X_new[i, 0] = gaussian(data, l1)
    X_new[i, 1] = gaussian(data, l2)


plt.scatter(X_new[y==0,0], X_new[y==0,1])
plt.scatter(X_new[y==1,0], X_new[y==1,1])
plt.show()
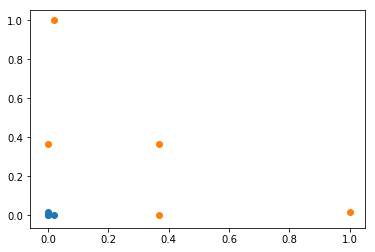
这样数据就变成线性可分了
标签:lang new atp img range enter enumerate ret 使用
原文地址:https://www.cnblogs.com/devwalks/p/14353189.html