标签:收集 -o 存储空间 初始化 空间 内容 raw line http
计算机硕士如何规划研究生学习与生活 - 知乎 https://zhuanlan.zhihu.com/p/47716443
内存泄漏检测工具valgrind神器 - 知乎 https://zhuanlan.zhihu.com/p/75416381
1概述
1.1 介绍
Valgrind是一套Linux下,开放源代码(GPL V2)的仿真调试工具的集合。Valgrind由内核(core)以及基于内核的其他调试工具组成。内核类似于一个框架(framework),它模拟了一个CPU环境,并提供服务给其他工具;而其他工具则类似于插件 (plug-in),利用内核提供的服务完成各种特定的内存调试任务。Valgrind的体系结构如下图所示:
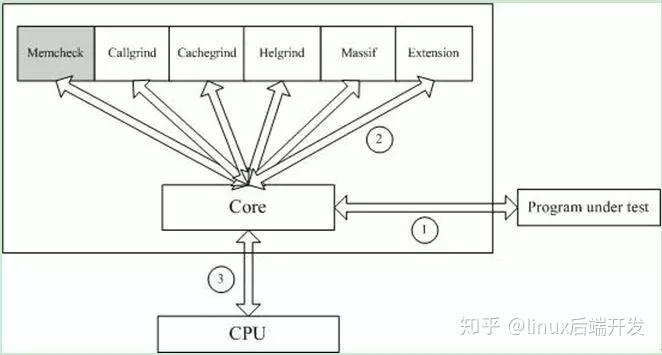
图1
1.2 工具
Valgrind的最新版是3.11.0,它一般包含下列工具:
1.Memcheck
最常用的工具,用来检测程序中出现的内存问题,所有对内存的读写都会被检测到,一切对malloc()/free()/new/delete的调用都会被捕获。所以,它能检测以下问题:
对未初始化内存的使用;
读/写释放后的内存块;
读/写超出malloc分配的内存块;
读/写不适当的栈中内存块;
内存泄漏,指向一块内存的指针永远丢失;
不正确的malloc/free或new/delete匹配;
memcpy()相关函数中的dst和src指针重叠。
2.Callgrind
和gprof类似的分析工具,但它对程序的运行观察更是入微,能给我们提供更多的信息。和gprof不同,它不需要在编译源代码时附加特殊选项,但加上调试选项是推荐的。Callgrind收集程序运行时的一些数据,建立函数调用关系图,还可以有选择地进行cache模拟。在运行结束时,它会把分析数据写入一个文件。callgrind_annotate可以把这个文件的内容转化成可读的形式。
3.Cachegrind
Cache分析器,它模拟CPU中的一级缓存I1,Dl和二级缓存,能够精确地指出程序中cache的丢失和命中。如果需要,它还能够为我们提供cache丢失次数,内存引用次数,以及每行代码,每个函数,每个模块,整个程序产生的指令数。这对优化程序有很大的帮助。
4.Helgrind
它主要用来检查多线程程序中出现的竞争问题。Helgrind寻找内存中被多个线程访问,而又没有一贯加锁的区域,这些区域往往是线程之间失去同步的地方,而且会导致难以发掘的错误。Helgrind实现了名为“Eraser”的竞争检测算法,并做了进一步改进,减少了报告错误的次数。不过,Helgrind仍然处于实验阶段。
5.Massif
堆栈分析器,它能测量程序在堆栈中使用了多少内存,告诉我们堆块,堆管理块和栈的大小。Massif能帮助我们减少内存的使用,在带有虚拟内存的现代系统中,它还能够加速我们程序的运行,减少程序停留在交换区中的几率。
此外,lackey和nulgrind也会提供。Lackey是小型工具,很少用到;Nulgrind只是为开发者展示如何创建一个工具。
1.3 原理
Memcheck 能够检测出内存问题,关键在于其建立了两个全局表。Valid-Value 表
对于进程的整个地址空间中的每一个字节(byte),都有与之对应的 8 个 bits;对于CPU的每个寄存器,也有一个与之对应的bit向量。这些bits负责记录该字节或者寄存器值是否具有有效的、已初始化的值。
Valid-Address 表
对于进程整个地址空间中的每一个字节(byte),还有与之对应的1个bit,负责记录该地址是否能够被读写。
检测原理:
当要读写内存中某个字节时,首先检查这个字节对应的 A bit。如果该A bit显示该位置是无效位置,memcheck则报告读写错误。
内核(core)类似于一个虚拟的 CPU 环境,这样当内存中的某个字节被加载到真实的 CPU 中时,该字节对应的 V bit 也被加载到虚拟的 CPU 环境中。一旦寄存器中的值,被用来产生内存地址,或者该值能够影响程序输出,则 memcheck 会检查对应的V bits,如果该值尚未初始化,则会报告使用未初始化内存错误。
2 安装使用
2.1安装
从官网http://www.valgrind.org下载最新版本(当前3.11)
#tar xvf valgrind-3.11.1.tar.bz2
#cd valgrind-3.11.1
#./configure --prefix=/usr/local/valgrind--指定安装目录
#make
#make install
2.2 命令介绍
用法:valgrind[options] prog-and-args [options]: 常用选项,适用于所有Valgrind工具
-tool=<name> 最常用的选项。运行 valgrind中名为toolname的工具。默认memcheck。
h –help 显示帮助信息。
-version 显示valgrind内核的版本,每个工具都有各自的版本。
q –quiet 安静地运行,只打印错误信息。
v –verbose 更详细的信息, 增加错误数统计。
-trace-children=no|yes 跟踪子线程? [no]
-track-fds=no|yes 跟踪打开的文件描述?[no]
-time-stamp=no|yes 增加时间戳到LOG信息? [no]
-log-fd=<number> 输出LOG到描述符文件 [2=stderr]
-log-file=<file> 将输出的信息写入到filename.PID的文件里,PID是运行程序的进行ID
-log-file-exactly=<file> 输出LOG信息到 file
-log-file-qualifier=<VAR> 取得环境变量的值来做为输出信息的文件名。 [none]
-log-socket=ipaddr:port 输出LOG到socket ,ipaddr:port
LOG信息输出:
-xml=yes 将信息以xml格式输出,只有memcheck可用
-num-callers=<number> show <number> callers in stack traces [12]
-error-limit=no|yes 如果太多错误,则停止显示新错误? [yes]
-error-exitcode=<number> 如果发现错误则返回错误代码 [0=disable]
-db-attach=no|yes 当出现错误,valgrind会自动启动调试器gdb。[no]
-db-command=<command> 启动调试器的命令行选项[gdb -nw %f %p]
适用于Memcheck工具的相关选项:
-leak-check=no|summary|full 要求对leak给出详细信息? [summary]
-leak-resolution=low|med|high how much bt merging in leak check [low]
-show-reachable=no|yes show reachable blocks in leak check? [no]
3 应用实践
下面通过介绍几个范例来说明如何使用Memcheck (其他工具暂不涉及,感兴趣可以交流),示例仅供参考,更多用途可在实际应用中不断探索。
3.1数组越界/内存未释放
#include<stdlib.h>
void k(void)
{
int *x = malloc(8 * sizeof(int));
x[9] = 0; //数组下标越界
} //内存未释放
int main(void)
{
k();
return 0;
}
1)编译程序test.c
gcc -Wall test.c -g -o test#Wall提示所有告警,-g gdb,-o输出
2)使用Valgrind检查程序BUG
valgrind --tool=memcheck --leak-check=full ./test
#--leak-check=full 所有泄露检查
3) 运行结果如下:
==2989== Memcheck, a memory error detector
==2989== Copyright (C) 2002-2012, and GNU GPL‘d, by Julian Seward
et al.
==2989== Using Valgrind-3.8.1 and LibVEX; rerun with -h for
copyright info
==2989== Command: ./test
==2989==
==2989== Invalid write of size 4
==2989== at 0x4004E2: k (test.c:5)
==2989== by 0x4004F2: main (test.c:10)
==2989== Address 0x4c27064 is 4 bytes after a block of size 32 alloc‘d
==2989== at 0x4A06A2E: malloc (vg_replace_malloc.c:270)
==2989== by 0x4004D5: k (test.c:4)
==2989== by 0x4004F2: main (test.c:10)
==2989==
==2989==
==2989== HEAP SUMMARY:
==2989== in use at exit: 32 bytes in 1 blocks
==2989== total heap usage: 1 allocs, 0 frees, 32 bytes allocated
==2989==
==2989== 32 bytes in 1 blocks are definitely lost in loss record 1
of 1
==2989== at 0x4A06A2E: malloc (vg_replace_malloc.c:270)
==2989== by 0x4004D5: k (test.c:4)
==2989== by 0x4004F2: main (test.c:10)
==2989==
==2989== LEAK SUMMARY:
==2989== definitely lost: 32 bytes in 1 blocks
==2989== indirectly lost: 0 bytes in 0 blocks
==2989== possibly lost: 0 bytes in 0 blocks
==2989== still reachable: 0 bytes in 0 blocks
==2989==suppressed: 0 bytes in 0 blocks
==2989==
==2989== For counts of detected and suppressed errors, rerun with: -v
==2989== ERROR SUMMARY: 2 errors from 2 contexts
(suppressed: 6 from 6)
3.2内存释放后读写
#include <stdio.h>
#include <stdlib.h>
int main(void)
{
char *p = malloc(1); //分配
*p = ‘a‘;
char c = *p;
printf("\n [%c]\n",c);
free(p); //释放
c = *p; //取值
return 0;
}
1)编译程序t2.c
gcc -Wall t2.c -g -o t2
2)使用Valgrind检查程序BUG
valgrind --tool=memcheck --leak-check=full ./t2
3) 运行结果如下:
==3058== Memcheck, a memory error detector
==3058== Copyright (C) 2002-2012, and GNU GPL‘d, by Julian
Seward et al.
==3058== Using Valgrind-3.8.1 and LibVEX; rerun with -h
for copyright info
==3058== Command: ./t2
==3058==
[a]
==3058== Invalid read of size 1
==3058== at 0x4005A3: main (t2.c:14)
==3058== Address 0x4c27040 is 0 bytes inside a block of size
1 free‘d
==3058== at 0x4A06430: free (vg_replace_malloc.c:446)
==3058== by 0x40059E: main (t2.c:13)
==3058==
==3058==
==3058== HEAP SUMMARY:
==3058== in use at exit: 0 bytes in 0 blocks
==3058== total heap usage: 1 allocs, 1 frees, 1 bytes allocated
==3058==
==3058== All heap blocks were freed -- no leaks are possible
==3058==
==3058== For counts of detected and suppressed errors, rerun with:
-v
==3058== ERROR SUMMARY: 1 errors from 1 contexts
(suppressed: 6 from 6)
从上输出内容可以看到,Valgrind检测到无效的读取操作然后输出“Invalid read of size 1”。
3.3无效读写
#include <stdio.h>
#include <stdlib.h>
int main(void)
{
char *p = malloc(1); //分配1字节
*p = ‘a‘;
char c = *(p+1); //地址加1
printf("\n [%c]\n",c);
free(p);
return 0;
}
1)编译程序t3.c
gcc -Wall t3.c -g -o t3
2)使用Valgrind检查程序BUG
valgrind --tool=memcheck --leak-check=full ./t3
3) 运行结果如下:
==3128== Memcheck, a memory error detector
==3128== Copyright (C) 2002-2012, and GNU GPL‘d, by Julian Seward et al.
==3128== Using Valgrind-3.8.1 and LibVEX; rerun with -h for copyright info
==3128== Command: ./t3
==3128==
==3128== Invalid read of size 1 #无效读取
==3128==at 0x400579: main (t3.c:9)
==3128==Address 0x4c27041 is 0 bytes after a block of size 1 alloc‘d
==3128==at 0x4A06A2E: malloc (vg_replace_malloc.c:270)
==3128==by 0x400565: main (t3.c:6)
==3128==
[]
==3128==
==3128== HEAP SUMMARY:
==3128==in use at exit: 0 bytes in 0 blocks
==3128==total heap usage: 1 allocs, 1 frees, 1 bytes allocated
==3128==
==3128== All heap blocks were freed -- no leaks are possible
==3128==
==3128== For counts of detected and suppressed errors, rerun with: -v
==3128== ERROR SUMMARY: 1 errors from 1 contexts
(suppressed: 6 from 6)
3.4内存泄露
#include <stdio.h>
#include <stdlib.h>
int main(void)
{
int *p = malloc(1);
*p = ‘x‘;
char c = *p;
printf("%c\n",c); //申请后未释放
return 0;
}
1)编译程序t4.c
gcc -Wall t4.c -g -o t4
2)使用Valgrind检查程序BUG
valgrind --tool=memcheck --leak-check=full ./t4
3) 运行结果如下:
==3221== Memcheck, a memory error detector
==3221== Copyright (C) 2002-2012, and GNU GPL‘d, by Julian Seward et al.
==3221== Using Valgrind-3.8.1 and LibVEX; rerun with -h for copyright info
==3221== Command: ./t4
==3221==
==3221== Invalid write of size 4
==3221==at 0x40051E: main (t4.c:7)
==3221==Address 0x4c27040 is 0 bytes inside a block of size 1 alloc‘d
==3221==at 0x4A06A2E: malloc (vg_replace_malloc.c:270)
==3221==by 0x400515: main (t4.c:6)
==3221==
==3221== Invalid read of size 4
==3221==at 0x400528: main (t4.c:8)
==3221==Address 0x4c27040 is 0 bytes inside a block of size 1 alloc‘d
==3221==at 0x4A06A2E: malloc (vg_replace_malloc.c:270)
==3221==by 0x400515: main (t4.c:6)
==3221==
x
==3221==
==3221== HEAP SUMMARY:
==3221==in use at exit: 1 bytes in 1 blocks
==3221==total heap usage: 1 allocs, 0 frees, 1 bytes allocated
==3221==
==3221== 1 bytes in 1 blocks are definitely lost in loss record 1 of 1
==3221==at 0x4A06A2E: malloc (vg_replace_malloc.c:270)
==3221==by 0x400515: main (t4.c:6)
==3221==
==3221== LEAK SUMMARY:
==3221==definitely lost: 1 bytes in 1 blocks
==3221==indirectly lost: 0 bytes in 0 blocks
==3221== possibly lost: 0 bytes in 0 blocks
==3221==still reachable: 0 bytes in 0 blocks
==3221== suppressed: 0 bytes in 0 blocks
==3221==
==3221== For counts of detected and suppressed errors, rerun with: -v
==3221== ERROR SUMMARY: 3 errors from 3 contexts
(suppressed: 6 from 6)
从检查结果看,可以发现内存泄露。
3.5内存多次释放
#include <stdio.h>
#include <stdlib.h>
int main(void)
{
char *p;
p=(char *)malloc(100);
if(p)
printf("Memory Allocated at: %s/n",p);
else
printf("Not Enough Memory!/n");
free(p); //重复释放
free(p);
free(p);
return 0;
}
1)编译程序t5.c
gcc -Wall t5.c -g -o t5
2)使用Valgrind检查程序BUG
valgrind --tool=memcheck --leak-check=full ./t5
3) 运行结果如下:
==3294== Memcheck, a memory error detector
==3294== Copyright (C) 2002-2012, and GNU GPL‘d, by Julian Seward
et al.
==3294== Using Valgrind-3.8.1 and LibVEX; rerun with -h for
copyright info
==3294== Command: ./t5
==3294==
==3294== Conditional jump or move depends on uninitialised value(s)
==3294== at 0x3CD4C47E2C: vfprintf (in /lib64/libc-2.12.so)
==3294== by 0x3CD4C4F189: printf (in /lib64/libc-2.12.so)
==3294== by 0x400589: main (t5.c:9)
==3294==
==3294== Invalid free() / delete / delete[] / realloc()
==3294== at 0x4A06430: free (vg_replace_malloc.c:446)
==3294== by 0x4005B5: main (t5.c:13)
==3294== Address 0x4c27040 is 0 bytes inside a block of size
100 free‘d
==3294== at 0x4A06430: free (vg_replace_malloc.c:446)
==3294== by 0x4005A9: main (t5.c:12)
==3294==
==3294== Invalid free() / delete / delete[] / realloc()
==3294== at 0x4A06430: free (vg_replace_malloc.c:446)
==3294== by 0x4005C1: main (t5.c:14)
==3294== Address 0x4c27040 is 0 bytes inside a block of size
100 free‘d
==3294== at 0x4A06430: free (vg_replace_malloc.c:446)
==3294== by 0x4005A9: main (t5.c:12)
==3294==
Memory Allocated at: /n==3294==
==3294== HEAP SUMMARY:
==3294== in use at exit: 0 bytes in 0 blocks
==3294== total heap usage: 1 allocs, 3 frees, 100 bytes allocated
从上面的输出可以看到(标注), 该功能检测到我们对同一个指针调用了3次释放内存操作。
3.6内存动态管理
常见的内存分配方式分三种:静态存储,栈上分配,堆上分配。全局变量属于静态存储,它们是在编译时就被分配了存储空间,函数内的局部变量属于栈上分配,而最灵活的内存使用方式当属堆上分配,也叫做内存动态分配了。常用的内存动态分配函数包括:malloc, alloc, realloc, new等,动态释放函数包括free, delete。
一旦成功申请了动态内存,我们就需要自己对其进行内存管理,而这又是最容易犯错误的。下面的一段程序,就包括了内存动态管理中常见的错误。
#include <stdio.h>
#include <stdlib.h>
int main(int argc,char *argv[])
{
int i;
char* p = (char*)malloc(10);
char* pt=p;
for(i = 0;i < 10;i++)
{
p[i] = ‘z‘;
}
free(p);
pt[1] = ‘x‘;
free(pt);
return 0;
}
1)编译程序t6.c
gcc -Wall t6.c -g -o t6
2)使用Valgrind检查程序BUG
valgrind --tool=memcheck --leak-check=full ./t6
3) 运行结果如下:
==3380== Memcheck, a memory error detector
==3380== Copyright (C) 2002-2012, and GNU GPL‘d, by Julian Seward et al.
==3380== Using Valgrind-3.8.1 and LibVEX; rerun with -h for copyright info
==3380== Command: ./t6
==3380==
==3380== Invalid write of size 1
==3380==at 0x40055C: main (t6.c:14)
==3380==Address 0x4c27041 is 1 bytes inside a block of size 10 free‘d
==3380==at 0x4A06430: free (vg_replace_malloc.c:446)
==3380==by 0x400553: main (t6.c:13)
==3380==
==3380== Invalid free() / delete / delete[] / realloc()
==3380==at 0x4A06430: free (vg_replace_malloc.c:446)
==3380==by 0x40056A: main (t6.c:15)
==3380==Address 0x4c27040 is 0 bytes inside a block of size 10 free‘d
==3380==at 0x4A06430: free (vg_replace_malloc.c:446)
==3380==by 0x400553: main (t6.c:13)
==3380==
==3380==
==3380== HEAP SUMMARY:
==3380==in use at exit: 0 bytes in 0 blocks
==3380==total heap usage: 1 allocs, 2 frees, 10 bytes allocated
申请内存在使用完成后就要释放。如果没有释放,或少释放了就是内存泄露;多释放也会产生问题。上述程序中,指针p和pt指向的是同一块内存,却被先后释放两次。系统会在堆上维护一个动态内存链表,如果被释放,就意味着该块内存可以继续被分配给其他部分,如果内存被释放后再访问,就可能覆盖其他部分的信息,这是一种严重的错误,上述程序第14行中就在释放后仍然写这块内存。
输出结果显示,第13行分配和释放函数不一致;第14行发生非法写操作,也就是往释放后的内存地址写值;第15行释放内存函数无效。
文末也给大家,分享主要有C/C++,Linux,Nginx,ZeroMQ,MySQL,Redis,fastdfs,MongoDB,ZK,流媒体,CDN,P2P,K8S,Docker,TCP/IP,协程,DPDK技术,面试技巧方面的资料技术讨论。
内存泄漏检测工具valgrind 热点函数以及CPU使用率 性能评估
标签:收集 -o 存储空间 初始化 空间 内容 raw line http
原文地址:https://www.cnblogs.com/rsapaper/p/14856997.html