标签:sim formatter art col struct echarts 折线图 OLE init
<div echarts #myEchart [options]="option"></div>
import { Component, OnInit, ViewChild, ElementRef } from ‘@angular/core‘;
import { NgxEchartsService } from ‘ngx-echarts‘;
@Component({
  selector: ‘app-oee-report‘,
  templateUrl: ‘./oee-report.component.html‘,
  styleUrls: [‘./oee-report.component.less‘],
})
export class MyTestComponent implements OnInit {
  constructor(
    private es: NgxEchartsService,
  ) { }
  option = {
    tooltip: {
        trigger: ‘axis‘,
        axisPointer: {
            type: ‘cross‘,
            crossStyle: {
                color: ‘#999‘
            }
        }
    },
    toolbox: {
        feature: {
            dataView: {show: true, readOnly: false},
            magicType: {show: true, type: [‘line‘, ‘bar‘]},
            restore: {show: true},
            saveAsImage: {show: true}
        }
    },
    legend: {
      data: [‘信息01‘,‘信息02‘,‘信息03‘],
      bottom: ‘0px‘
    },
    xAxis: [
        {
            type: ‘category‘,
            data: [‘1月‘, ‘2月‘, ‘3月‘], // x轴显示的内容
            axisPointer: {
                type: ‘shadow‘
            }
        }
    ],
    yAxis: [
        {
            type: ‘value‘,
            name: ‘‘,
            min: 0,
            max: 100,
            interval: 20,
            axisLabel: {
                formatter: ‘{value} ‘
            }
        },
        {
            type: ‘value‘,
            name: ‘‘,
            min: 0,
            max: 25,
            interval: 5,
            axisLabel: {
                formatter: ‘{value} %‘
            }
        }
    ],
    grid: { // 控制距離上下左右距離
      left: 50, // 配合设置barWidth
      right: 50,
      top: 39,
      bottom: 24,
      containLabel: true
    },
    series: [
        {
            name: ‘信息01‘,
            type: ‘bar‘, // x轴对应的数据
            barWidth: 30,
            data: [10,100, 50]
        },
        {
            name: ‘信息02‘,
            type: ‘line‘,
            yAxisIndex: 1,
            data: [2.0, 2.2, 3.3]
        },
        {
            name: ‘信息03‘,
            type: ‘line‘,
            yAxisIndex: 1,
            data: [8.0, 20, 5.3]
        }
    ]
  };
  @ViewChild(‘myEchart‘, { static: false }) myEchart: ElementRef;
  ngOnInit(): void {
  }
  ngAfterViewInit(){
    this.test()
  }
  test() {
  this.es.getInstanceByDom(this.myEchart.nativeElement).setOption(this.option);
   // 添加点击事件代码
   let myChart = this.es.getInstanceByDom(this.myEchart.nativeElement)
   myChart.getZr().on(‘click‘,  params=> {
     var pointInPixel = [params.offsetX, params.offsetY];
     if (myChart.containPixel(‘grid‘, pointInPixel)) {
       /*此处添加具体执行代码*/
       var pointInGrid = myChart.convertFromPixel({ seriesIndex: 0 }, pointInPixel);
       //X轴序号
       var xIndex = pointInGrid[0];
       //获取当前图表的option
       var op = myChart.getOption();
       //获得图表中我们想要的数据---下面就不简写了,默认说我们的折现有2条吧
       var xValue = op.xAxis[0].data[xIndex];
       var value = op.series[0].data[xIndex];
       var name = op.series[0].name;
       var value1 = op.series[1].data[xIndex];
       var name1 = op.series[1].name;
       var value2 = op.series[2].data[xIndex];
       var name2 = op.series[2].name;
       console.log(op);
       console.log(‘xValue: ‘+xValue + ", series[0].name0: "+name +‘ , value: ‘+ value);
       console.log(‘xValue: ‘+xValue + ", series[1].name0: "+name1 +‘ , value1: ‘+ value1 + "%");
       console.log(‘xValue: ‘+xValue + ", series[2].name0: "+name2 +‘ , value2: ‘+ value2 + "%");
     }
   });
   // 添加点击事件代码
  }


}
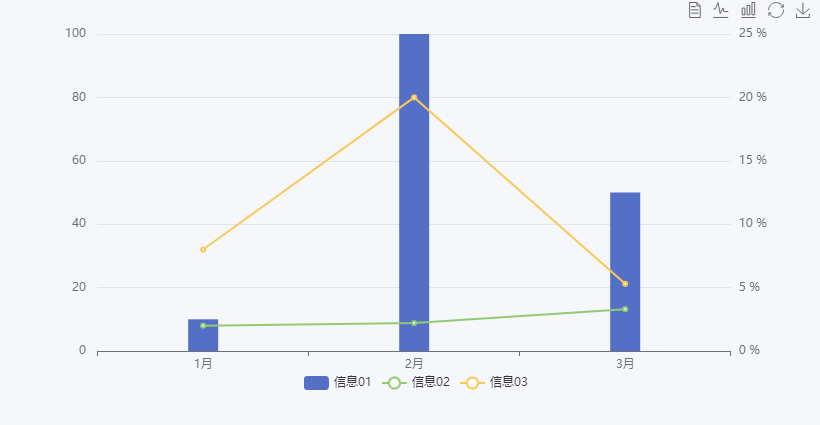
NG-ZORRO + Angular11使用Echarts实现柱折线图-折柱混合,并给图表添加点击打印图表数据!!!详细代码
标签:sim formatter art col struct echarts 折线图 OLE init
原文地址:https://www.cnblogs.com/sugartang/p/14850292.html