标签:style blog http io color ar os 使用 sp
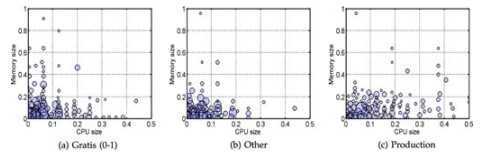
由于项目计划书写作需要,重画了Qi Zhang, Mohamed Faten Zhani, Raouf Boutaba, Joseph L. Hellerstein,
Dynamic Heterogeneity-Aware Resource Provisioning in the Cloud. IEEE TRANSACTIONS ON CLOUD
COMPUTING, VOL. 2, NO. 1, JANUARY-MARCH 2014.中的TaskEvent分布统计图。原图更跟重画图如下:
原图:
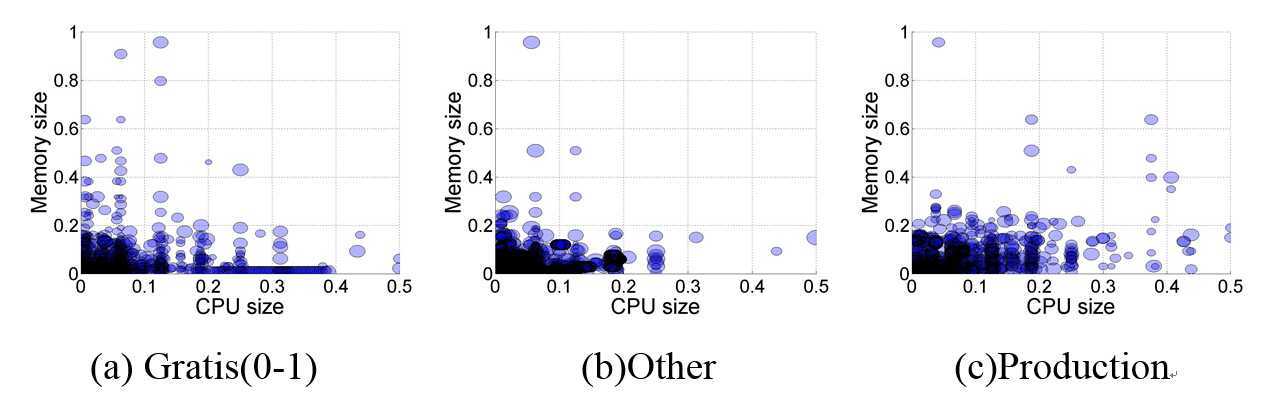
重画图:
数据来源:
介绍:
https://code.google.com/p/googleclusterdata/wiki/ClusterData2011_1
所有文件列表及校验和:
https://commondatastorage.googleapis.com/clusterdata-2011-1/SHA256SUM
格式说明:
https://commondatastorage.googleapis.com/clusterdata-2011-1/schema.csv
数据文件示例连接:
https://commondatastorage.googleapis.com/clusterdata-2011-1/job_events/part-00017-of-00500.csv.gz
重画的步骤如下。
1 由于数据存放在https://commondatastorage.googleapis.com/clusterdata-2011-1/
需要FQ才能访问,故所有数据处理都是在墙外的位于东亚的azure服务器完成的。故首先建一个云服务器,并完成环境配置。
(主要是装个python)
2 下载数据文件(数据总量较大,1.51G)
import urllib2

url = ‘https://commondatastorage.googleapis.com/clusterdata-2011-1/‘
f = open(‘C:\\SHA256SUM‘)
l = f.readlines()
f.close()
for i in l:
    if i.count(‘task_events‘)>0:
        fileAddr = i.split()[1][1:]
        fileName = fileAddr.split(‘/‘)[1]
        print ‘downloading‘, fileName
        data = urllib2.urlopen(url+fileAddr).read()
        print ‘saving‘, fileName
        fileDown = open(‘C:\\task_events\\‘+fileName, ‘wb‘)
        fileDown.write(data)
        fileDown.close()
3 生成要处理的文件名
f = open(‘C:\\SHA256SUM‘)
l = f.readlines()
f.close()
fName = open(‘C:\\task_events_file_name.txt‘, ‘w‘)
for i in l:
    if i.count(‘task_events‘)>0:
        fileAddr = i.split()[1][1:]
        fileName = fileAddr.split(‘/‘)[1]
        fName.write(fileName+‘\r\n‘)
fName.close()
4 统计
import gzip

fName = open(‘C:\\task_events_file_name.txt‘)
fileNames = fName.readlines()
fName.close()
cntMapGratis = {}
cntMapProduction = {}
cntMapOthers = {}
#fileNames = [‘part-00000-of-00500.csv.gz‘]
for l in fileNames:
    print ‘now at: ‘+ l.strip()
    f = gzip.open(‘C:\\task_events\\‘+l.strip())
    for log in f.readlines():
        log = log.split(‘,‘)
        if log[9]!=‘‘ and log[10]!=‘‘:
            index = log[9]+‘ ‘+log[10]
            priority = int(log[8])
            if priority <= 1: #Gratis Task
                cntMap = cntMapGratis
            elif priority >= 9 and priority <= 11:
                cntMap = cntMapProduction
            else:
                cntMap = cntMapOthers
            if not index in cntMap:
                cntMap[index]=1
            else:
                cntMap[index]+=1
    f.close()
fReasult = open(‘C:\\CPUandMEMuseGratis.txt‘, ‘w‘)
for i in cntMapGratis:
    fReasult.write(i+‘ ‘+str(cntMapGratis[i])+"\r\n")
fReasult.close()

fReasult = open(‘C:\\CPUandMEMuseProduction.txt‘, ‘w‘)
for i in cntMapProduction:
    fReasult.write(i+‘ ‘+str(cntMapProduction[i])+"\r\n")
fReasult.close()

fReasult = open(‘C:\\CPUandMEMuseOthers.txt‘, ‘w‘)
for i in cntMapOthers:
    fReasult.write(i+‘ ‘+str(cntMapOthers[i])+"\r\n")
fReasult.close()
5 使用matlab绘制
clear all
close all
%load(‘D:\\CPUandMEMuseGratis.txt‘)
%load(‘D:\\CPUandMEMuseProduction.txt‘)
load(‘D:\\CPUandMEMuseOther.txt‘)
%CPUandMEMuse = CPUandMEMuseGratis;
%CPUandMEMuse = CPUandMEMuseProduction;
CPUandMEMuse = CPUandMEMuseOther;
x=CPUandMEMuse(:,1);
y= CPUandMEMuse(:,2);
s = CPUandMEMuse(:,3)/10000000;
s = log(s);
%max_r = 0.002; %for production and gratis
max_r = 0.001; %for other only
s = s/max(s)*max_r;
for i=1:size(x)
if x(i) == 0 || y(i) == 0
s(i)=0;
end
end
t= 0:pi/10:2*pi;
figure();
grid on
for i=1:size(x)
if x(i)~=0 && y(i)~=0
pb=patch((s(i)*sin(t)*0.5+ x(i)),(s(i)*cos(t)+y(i)),‘b‘,‘edgecolor‘,‘k‘);
alpha(pb,.3);
end
end
axis([0 0.5 0 1]);
xlabel(‘CPU size‘);
ylabel(‘Memory size‘);
set(gca,‘FontSize‘,25);
set(get(gca,‘XLabel‘),‘FontSize‘,30);
set(get(gca,‘YLabel‘),‘FontSize‘,30);
%saveas(gcf,‘D:\\CPUandMEMuseGratis.jpg‘)
%saveas(gcf,‘D:\\CPUandMEMuseProduction.jpg‘)
saveas(gcf,‘D:\\CPUandMEMDemandOther.jpg‘)
附注:
1. Task通过优先级划分类别的
0-1 是Gratis
9-11 是Production
其他(2-8) 是Other
2. 画图的时候,圆的半径表示数量的对数(log)
标签:style blog http io color ar os 使用 sp
原文地址:http://www.cnblogs.com/instant7/p/4102818.html