标签:ase port lin data png efi nbsp lis 技术分享
1. Get the r value and the p value between the dataset:
r_fta_pts,p_value = pearsonr(nba_stats["pts"],nba_stats["fta"])
r_stl_pf,p_value = pearsonr(nba_stats["stl"],nba_stats["pf"]) # It will return R value and P value.
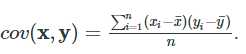
2. The function of getting convariance form two data set, the convariance is the value that measure how much two variables correlated with each other. If one changes to bigger, the other changes to bigger. which said these two variables are corresponse. Here is the function of getting the convariance:
here is the formular:
def conv_compute(x,y): #define a function to calculate the convariance
mean_x = sum(x)/len(x)
mean_y = sum(y)/len(y)# calculate the mean of each column
x_diff = [i-mean_x for i in x]
y_diff = [n-mean_y for n in y] # calculate the difference for both column, if it is hard to use for loop, we can think about the list function.
sum_diff =[x_diff[i]* y_diff[i] for i in range(len(x))] # use range(len()) function to replace the for loop
return sum(sum_diff)/len(sum_diff)
cov_stl_pf = conv_compute(nba_stats["stl"],nba_stats["pf"])
cov_fta_pts = conv_compute(nba_stats["fta"],nba_stats["pts"])
3. The way to calculate correlation coefficient: The fomular is 
from numpy import cov
cov_1 = cov(nba_stats["fta"],nba_stats["blk"])[0,1]
std_1 = nba_stats["fta"].std() * nba_stats["blk"].std()
r_fta_blk = cov_1/std_1
Statistics and Linear Algebra 3
标签:ase port lin data png efi nbsp lis 技术分享
原文地址:http://www.cnblogs.com/kingoscar/p/6120469.html