标签:nbsp frame com exp img poi [1] orm method
摘自 http://f.dataguru.cn/thread-278300-1-1.html
library(ggplot2)
x=1:10
y=rnorm(10)
a=data.frame(x= x, y= y)
# plot(y~x,data=a)
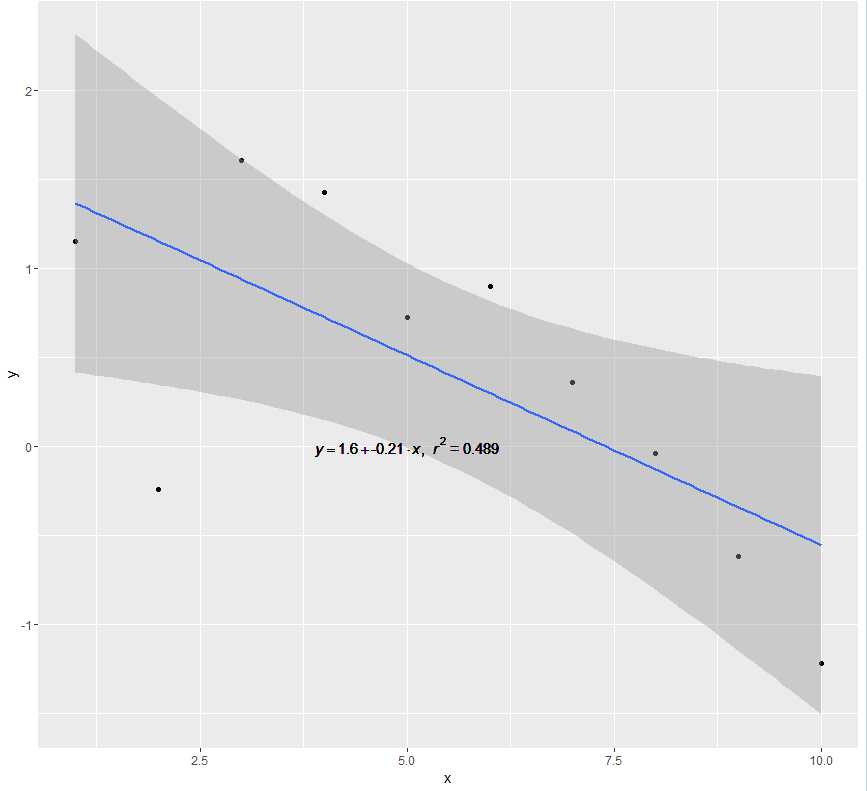
lm_eqn = function(df){
m = lm(y ~ x, df);
eq <- substitute(italic(y) == a + b %.% italic(x)*","~~italic(r)^2~"="~r2,
list(a = format(coef(m)[1], digits = 2),
b = format(coef(m)[2], digits = 2),
r2 = format(summary(m)$r.squared, digits = 3)))
as.character(as.expression(eq));
}
p=ggplot(a,aes(x,y))+geom_point()+geom_smooth(method="lm")
p+geom_text(aes(x=5,y=0,label=lm_eqn(a)),parse=T) ###坐标可以调
标签:nbsp frame com exp img poi [1] orm method
原文地址:http://www.cnblogs.com/yangyongzhi/p/6527288.html