标签:数据 获取 class anti ... names level 3.0 variables
一、查看数据
首先,我们查看iris数据集的大小和结构,其维度和名称分别使用函数dim()和names()获取。
函数str()和attributes()返回数据的结构和属性
二、单变量分析
> head(iris)
Sepal.Length Sepal.Width Petal.Length Petal.Width Species
1 5.1 3.5 1.4 0.2 setosa
2 4.9 3.0 1.4 0.2 setosa
3 4.7 3.2 1.3 0.2 setosa
4 4.6 3.1 1.5 0.2 setosa
5 5.0 3.6 1.4 0.2 setosa
6 5.4 3.9 1.7 0.4 setosa
> attach(iris)
The following objects are masked from iris (pos = 3):
Petal.Length, Petal.Width, Sepal.Length, Sepal.Width, Species
The following objects are masked from iris (pos = 4):
Petal.Length, Petal.Width, Sepal.Length, Sepal.Width, Species
The following objects are masked from iris (pos = 5):
Petal.Length, Petal.Width, Sepal.Length, Sepal.Width, Species
> dim(iris)
[1] 150 5
> names(iris)
[1] "Sepal.Length" "Sepal.Width" "Petal.Length" "Petal.Width"
[5] "Species"
> str(iris)
‘data.frame‘: 150 obs. of 5 variables:
$ Sepal.Length: num 5.1 4.9 4.7 4.6 5 5.4 4.6 5 4.4 4.9 ...
$ Sepal.Width : num 3.5 3 3.2 3.1 3.6 3.9 3.4 3.4 2.9 3.1 ...
$ Petal.Length: num 1.4 1.4 1.3 1.5 1.4 1.7 1.4 1.5 1.4 1.5 ...
$ Petal.Width : num 0.2 0.2 0.2 0.2 0.2 0.4 0.3 0.2 0.2 0.1 ...
$ Species : Factor w/ 3 levels "setosa","versicolor",..: 1 1 1 1 1 1 1 1 1 1 ...
> attributes(iris)
$names
[1] "Sepal.Length" "Sepal.Width" "Petal.Length" "Petal.Width"
[5] "Species"
$row.names
[1] 1 2 3 4 5 6 7 8 9 10 11 12 13 14 15 16 17 18
[19] 19 20 21 22 23 24 25 26 27 28 29 30 31 32 33 34 35 36
[37] 37 38 39 40 41 42 43 44 45 46 47 48 49 50 51 52 53 54
[55] 55 56 57 58 59 60 61 62 63 64 65 66 67 68 69 70 71 72
[73] 73 74 75 76 77 78 79 80 81 82 83 84 85 86 87 88 89 90
[91] 91 92 93 94 95 96 97 98 99 100 101 102 103 104 105 106 107 108
[109] 109 110 111 112 113 114 115 116 117 118 119 120 121 122 123 124 125 126
[127] 127 128 129 130 131 132 133 134 135 136 137 138 139 140 141 142 143 144
[145] 145 146 147 148 149 150
$class
[1] "data.frame"
> summary(iris)
Sepal.Length Sepal.Width Petal.Length Petal.Width
Min. :4.300 Min. :2.000 Min. :1.000 Min. :0.100
1st Qu.:5.100 1st Qu.:2.800 1st Qu.:1.600 1st Qu.:0.300
Median :5.800 Median :3.000 Median :4.350 Median :1.300
Mean :5.843 Mean :3.057 Mean :3.758 Mean :1.199
3rd Qu.:6.400 3rd Qu.:3.300 3rd Qu.:5.100 3rd Qu.:1.800
Max. :7.900 Max. :4.400 Max. :6.900 Max. :2.500
Species
setosa :50
versicolor:50
virginica :50
> head(iris)
Sepal.Length Sepal.Width Petal.Length Petal.Width Species
1 5.1 3.5 1.4 0.2 setosa
2 4.9 3.0 1.4 0.2 setosa
3 4.7 3.2 1.3 0.2 setosa
4 4.6 3.1 1.5 0.2 setosa
5 5.0 3.6 1.4 0.2 setosa
6 5.4 3.9 1.7 0.4 setosa
> quantile(Sepal.Length)###求取各段百分点
0% 25% 50% 75% 100%
4.3 5.1 5.8 6.4 7.9
> library(scatterplot3d)
> scatterplot3d(iris$Sepal.Length, Petal.Width, Petal.Length)
> var(Sepal.Length)###方差
[1] 0.6856935
>
> ris#####iris数据集
错误: 找不到对象‘ris‘
> head(iris)
Sepal.Length Sepal.Width Petal.Length Petal.Width Species
1 5.1 3.5 1.4 0.2 setosa
2 4.9 3.0 1.4 0.2 setosa
3 4.7 3.2 1.3 0.2 setosa
4 4.6 3.1 1.5 0.2 setosa
5 5.0 3.6 1.4 0.2 setosa
6 5.4 3.9 1.7 0.4 setosa
> attach(iris)
The following objects are masked from iris (pos = 3):
Petal.Length, Petal.Width, Sepal.Length, Sepal.Width, Species
The following objects are masked from iris (pos = 4):
Petal.Length, Petal.Width, Sepal.Length, Sepal.Width, Species
The following objects are masked from iris (pos = 5):
Petal.Length, Petal.Width, Sepal.Length, Sepal.Width, Species
The following objects are masked from iris (pos = 6):
Petal.Length, Petal.Width, Sepal.Length, Sepal.Width, Species
> dim(iris)
[1] 150 5
> names(iris)
[1] "Sepal.Length" "Sepal.Width" "Petal.Length" "Petal.Width"
[5] "Species"
> str(iris)
‘data.frame‘: 150 obs. of 5 variables:
$ Sepal.Length: num 5.1 4.9 4.7 4.6 5 5.4 4.6 5 4.4 4.9 ...
$ Sepal.Width : num 3.5 3 3.2 3.1 3.6 3.9 3.4 3.4 2.9 3.1 ...
$ Petal.Length: num 1.4 1.4 1.3 1.5 1.4 1.7 1.4 1.5 1.4 1.5 ...
$ Petal.Width : num 0.2 0.2 0.2 0.2 0.2 0.4 0.3 0.2 0.2 0.1 ...
$ Species : Factor w/ 3 levels "setosa","versicolor",..: 1 1 1 1 1 1 1 1 1 1 ...
> attributes(iris)
$names
[1] "Sepal.Length" "Sepal.Width" "Petal.Length" "Petal.Width"
[5] "Species"
$row.names
[1] 1 2 3 4 5 6 7 8 9 10 11 12 13 14 15 16 17 18
[19] 19 20 21 22 23 24 25 26 27 28 29 30 31 32 33 34 35 36
[37] 37 38 39 40 41 42 43 44 45 46 47 48 49 50 51 52 53 54
[55] 55 56 57 58 59 60 61 62 63 64 65 66 67 68 69 70 71 72
[73] 73 74 75 76 77 78 79 80 81 82 83 84 85 86 87 88 89 90
[91] 91 92 93 94 95 96 97 98 99 100 101 102 103 104 105 106 107 108
[109] 109 110 111 112 113 114 115 116 117 118 119 120 121 122 123 124 125 126
[127] 127 128 129 130 131 132 133 134 135 136 137 138 139 140 141 142 143 144
[145] 145 146 147 148 149 150
$class
[1] "data.frame"
> summary(iris)
Sepal.Length Sepal.Width Petal.Length Petal.Width
Min. :4.300 Min. :2.000 Min. :1.000 Min. :0.100
1st Qu.:5.100 1st Qu.:2.800 1st Qu.:1.600 1st Qu.:0.300
Median :5.800 Median :3.000 Median :4.350 Median :1.300
Mean :5.843 Mean :3.057 Mean :3.758 Mean :1.199
3rd Qu.:6.400 3rd Qu.:3.300 3rd Qu.:5.100 3rd Qu.:1.800
Max. :7.900 Max. :4.400 Max. :6.900 Max. :2.500
Species
setosa :50
versicolor:50
virginica :50
> head(iris)
Sepal.Length Sepal.Width Petal.Length Petal.Width Species
1 5.1 3.5 1.4 0.2 setosa
2 4.9 3.0 1.4 0.2 setosa
3 4.7 3.2 1.3 0.2 setosa
4 4.6 3.1 1.5 0.2 setosa
5 5.0 3.6 1.4 0.2 setosa
6 5.4 3.9 1.7 0.4 setosa
> quantile(Sepal.Length)###求取各段百分点
0% 25% 50% 75% 100%
4.3 5.1 5.8 6.4 7.9
> var(Sepal.Length)###方差
[1] 0.6856935
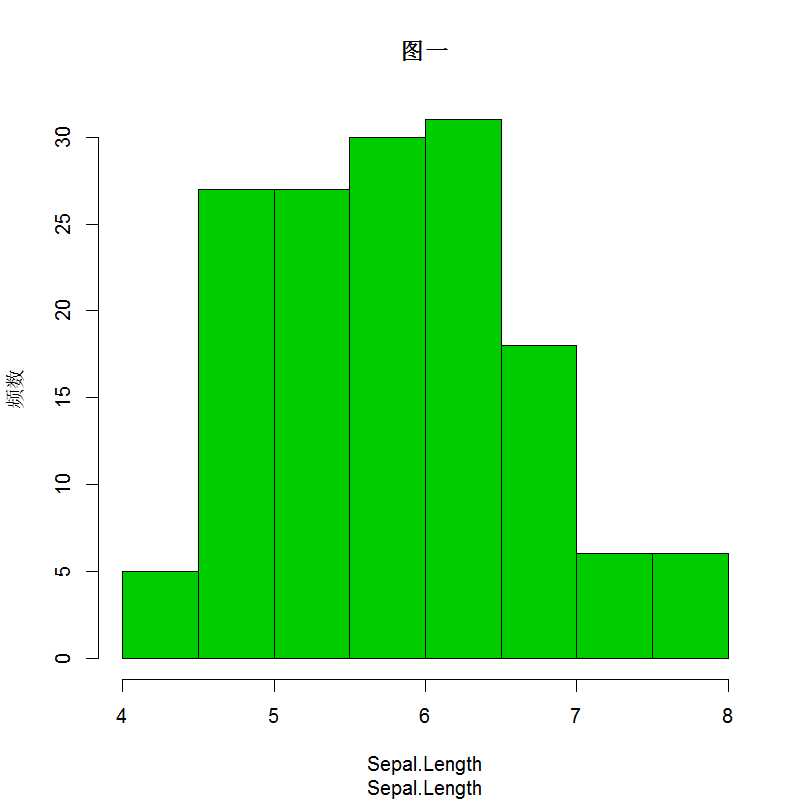
hist(Sepal.Length,col=3,main="图一",sub="Sepal.Length",ylab="频数")###主标题,副标题,纵轴名称
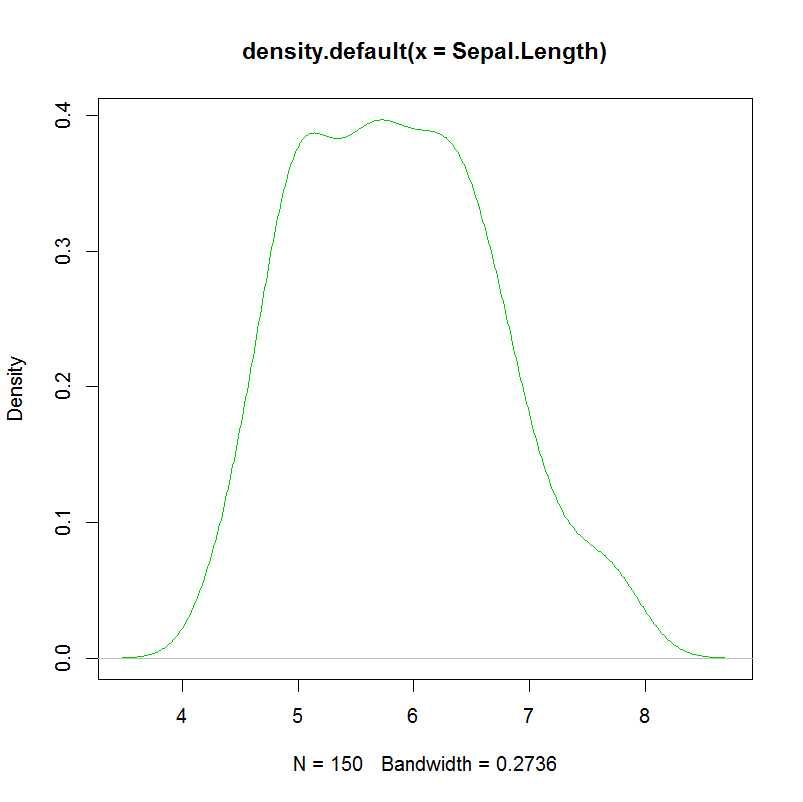
plot(density(Sepal.Length),col=3)###密度估计值
> table(Sepal.Length)###table(iris)
Sepal.Length
4.3 4.4 4.5 4.6 4.7 4.8 4.9 5 5.1 5.2 5.3 5.4 5.5 5.6 5.7 5.8 5.9 6 6.1
1 3 1 4 2 5 6 10 9 4 1 6 7 6 8 7 3 6 6
6.2 6.3 6.4 6.5 6.6 6.7 6.8 6.9 7 7.1 7.2 7.3 7.4 7.6 7.7 7.9
4 9 7 5 2 8 3 4 1 1 3 1 1 1 4 1
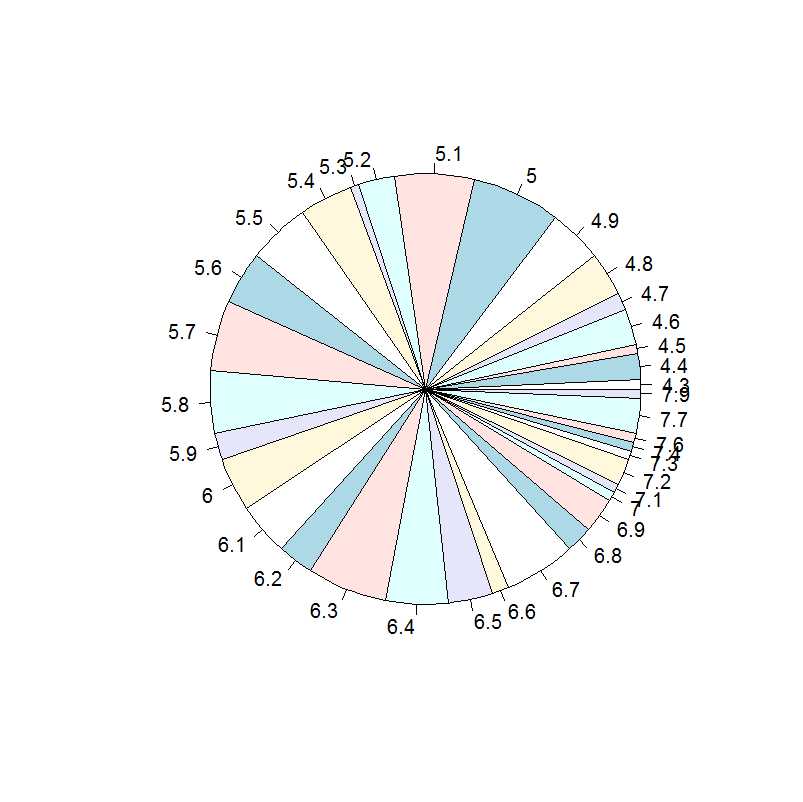
> pie(table(Sepal.Length))
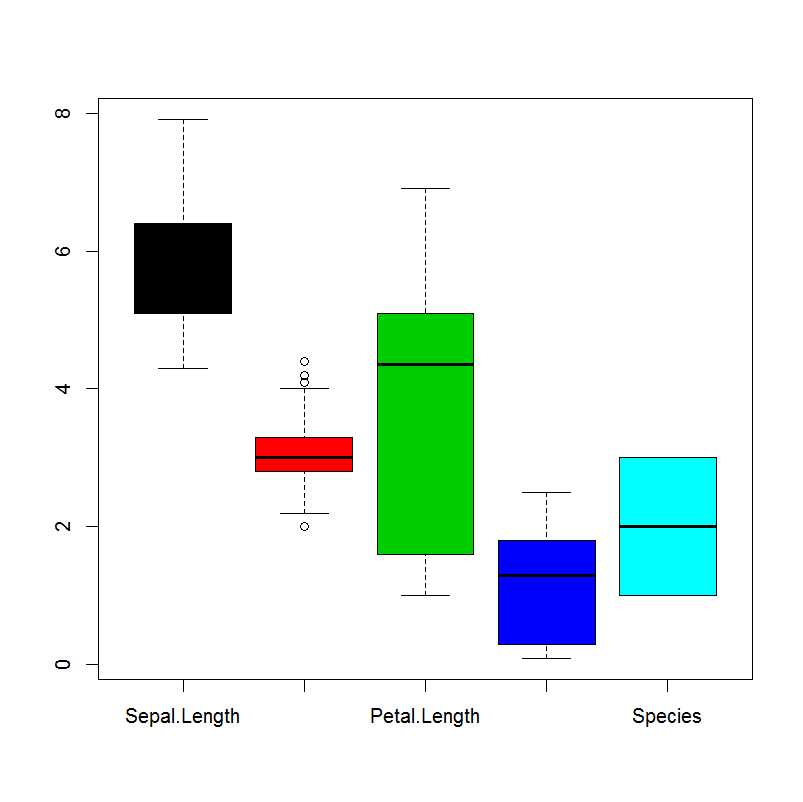
> boxplot(iris,col=c(1,2,3,4,5,6))
+
三、多变量探索分析
> cov(Sepal.Length, Sepal.Width)
[1] -0.042434
> cor(Sepal.Length,Sepal.Width)
[1] -0.1175698
> plot(Sepal.Length,Sepal.Width,col=Species,pch=as.numeric(Species))###添加不同颜色和标志
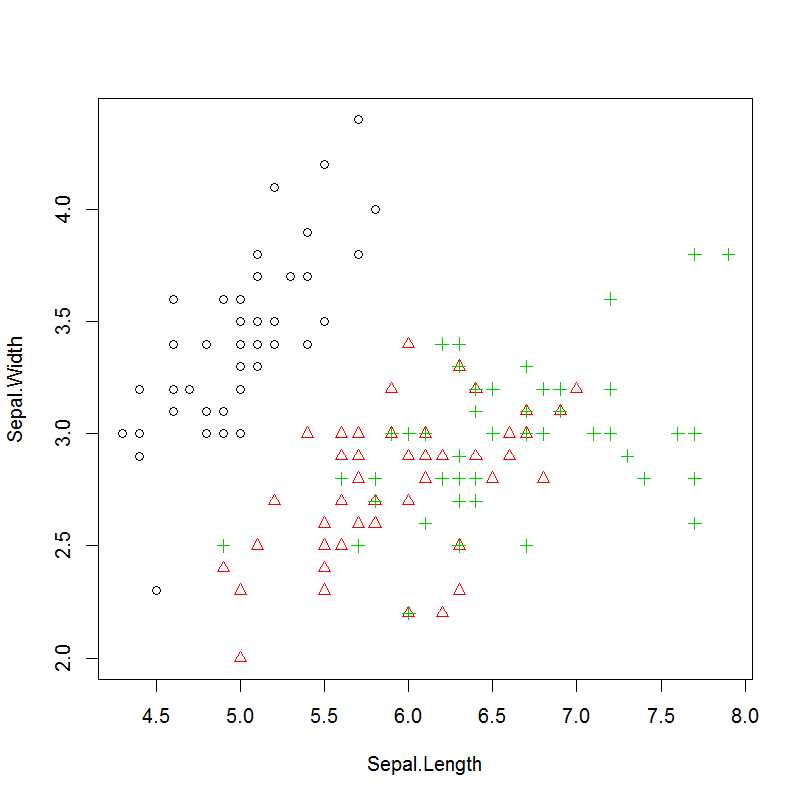
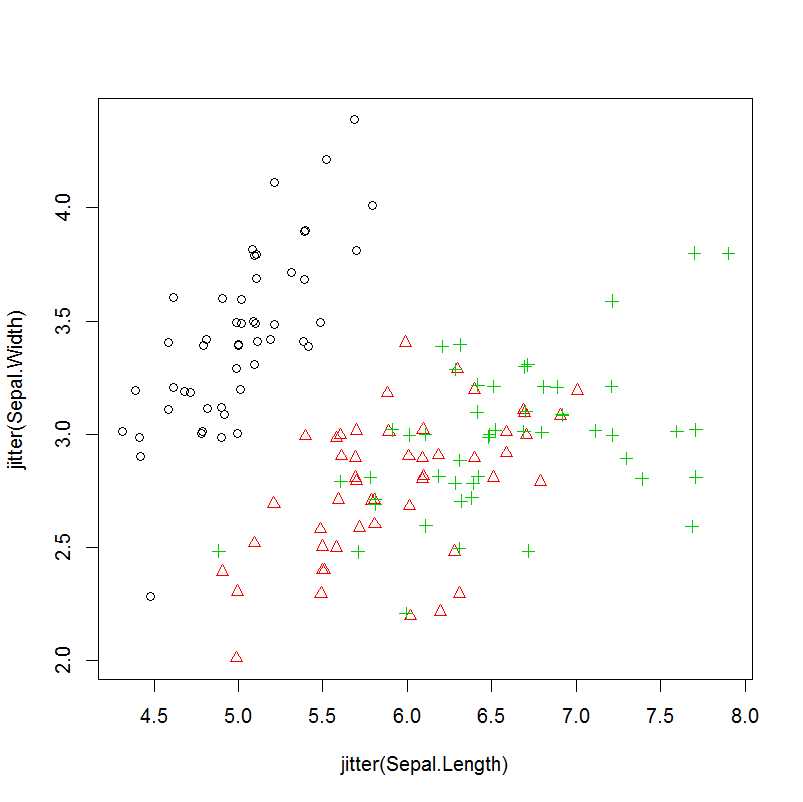
当数据量很大时,途中数据可能会出现重叠,可以添加jitter()函数添加少量白噪声
>plot(jitter(Sepal.Length),jitter(Sepal.Width),col=Species,pch=as.numeric(Species))
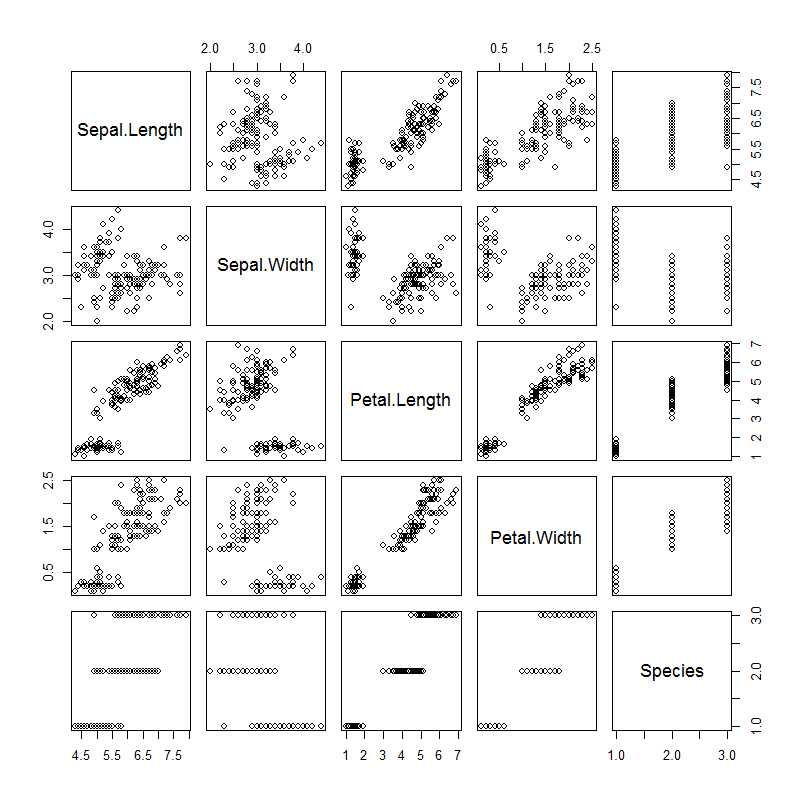
> pairs(iris)#####散布图矩阵
标签:数据 获取 class anti ... names level 3.0 variables
原文地址:http://www.cnblogs.com/alsely/p/6711392.html