标签:svg pre att text padding span class 图形 一个
1、创建SVG元素
var svg = d3.select("body").append("svg");
2、为SVG元素设置属性
svg.attr("width", 500)
     .attr("height", 50);
或:
//Width and height
var w = 500;
var h = 50;
var svg = d3.select("body")
            .append("svg")
            .attr("width", w)   // <-- Here
            .attr("height", h); // <-- and here!
或:
.attr({
       width: w,
       height: h
});
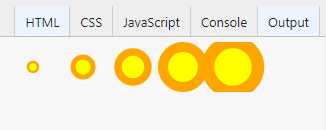
画圆实践
//Width and height
var w = 500;
var h = 50;

//Data
var dataset = [ 5, 10, 15, 20, 25 ];

//Create SVG element
var svg = d3.select("body")
    .append("svg")
    .attr("width", w)
    .attr("height", h);

var circles = svg.selectAll("circle")
    .data(dataset)
    .enter()
    .append("circle");

circles.attr("cx", function(d, i) {
           return (i * 50) + 25;
        })
    .attr("cy", h/2)
    .attr("r", function(d) {
        return d;
         })
    .attr("fill", "yellow")
    .attr("stroke", "orange")
    .attr("stroke-width", function(d) {
        return d/2;
    });
Bar Chart
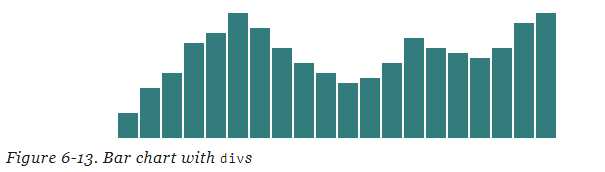
根据div画chart
var dataset = [ 5, 10, 13, 19, 21, 25, 22, 18, 15, 13,
                11, 12, 15, 20, 18, 17, 16, 18, 23, 25 ];

d3.select("body").selectAll("div")
    .data(dataset)
    .enter()
    .append("div")
    .attr("class", "bar")
    .style("height", function(d) {
        var barHeight = d * 5;
        return barHeight + "px";
    });
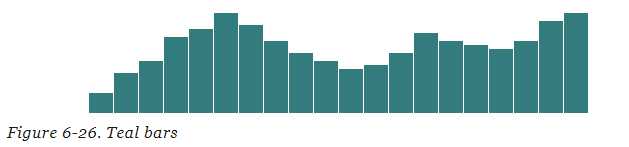
根据Rect画Chart
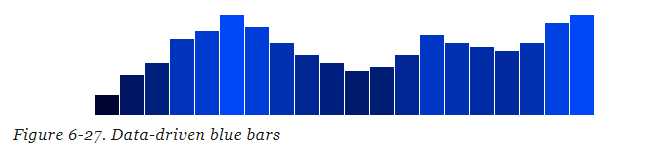
//Width and height
var w = 500;
var h = 100;
var barPadding = 1;  // <-- New!

var dataset = [ 5, 10, 13, 19, 21, 25, 22, 18, 15, 13,11, 12, 15, 20, 18, 17, 16, 18, 23, 25 ];

//Create SVG element
var svg = d3.select("body")
    .append("svg")
    .attr("width", w)
    .attr("height", h);


svg.selectAll("rect")
    .data(dataset)
    .enter()
    .append("rect")
        .attr("x", function(d, i) {
               return i * (w / dataset.length);
        })
        .attr("y", function(d) {
             return h - (d*4);  //Height minus data value
         })
        .attr("width", w / dataset.length - barPadding)
        .attr("height", function(d) {
            return d*4;
         })
         .attr("fill", "teal");
.attr("fill", function(d) {
    return "rgb(0, 0, " + (d * 10) + ")";
});
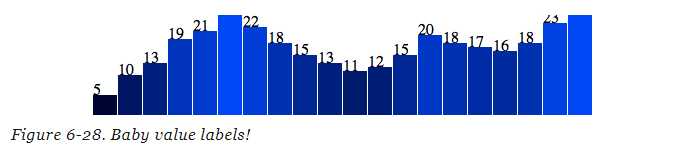
添加Lable:
svg.selectAll("text")
   .data(dataset)
   .enter()
   .append("text")
   .text(function(d) {
        return d;
   })
   .attr("x", function(d, i) {
        return i * (w / dataset.length);
   })
   .attr("y", function(d) {
        return h - (d * 4);
   });
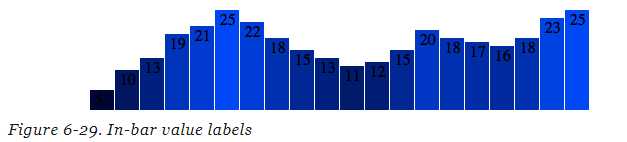
改变Label显示位置
.attr("x", function(d, i) {
        return i * (w / dataset.length) + 5;  // +5
})
.attr("y", function(d) {
        return h - (d * 4) + 15;              // +15
});
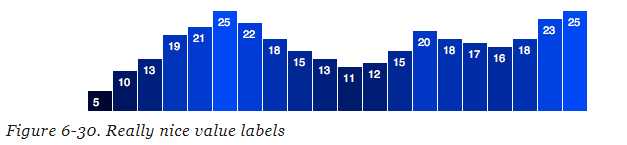
设置属性
.attr("font-family", "sans-serif")
.attr("font-size", "11px")
.attr("fill", "white");
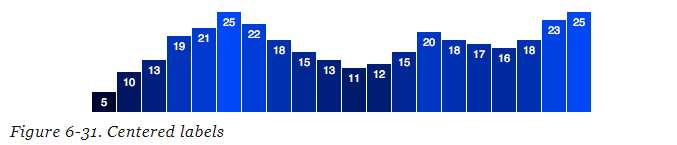
利用上面的方式计算label的位置,有时并不能很好的适应对应的bar,例如第一个label 5的位置,可以使用text-anchor属性居中
.attr("x", function(d, i) {
        return i * (w / dataset.length) + (w / dataset.length - barPadding) / 2;      //x位置为每个bar的中间
})
.attr("y", function(d) {
        return h - (d * 4) + 14;  //15 is now 14
})
.attr("text-anchor", "middle")
标签:svg pre att text padding span class 图形 一个
原文地址:http://www.cnblogs.com/xuepei/p/7527082.html