标签:分享 3.3 number atl idt time self gad 运行
本题主要是显示周期序列的。
1、代码:
%% ------------------------------------------------------------------------
%% Output Info about this m-file
fprintf(‘\n***********************************************************\n‘);
fprintf(‘ <DSP using MATLAB> Problem 2.3.1 \n\n‘);
time_stamp = datestr(now, 31);
[wkd1, wkd2] = weekday(today, ‘long‘);
fprintf(‘ Now is %20s, and it is %7s \n\n‘, time_stamp, wkd2);
%% ------------------------------------------------------------------------
%%
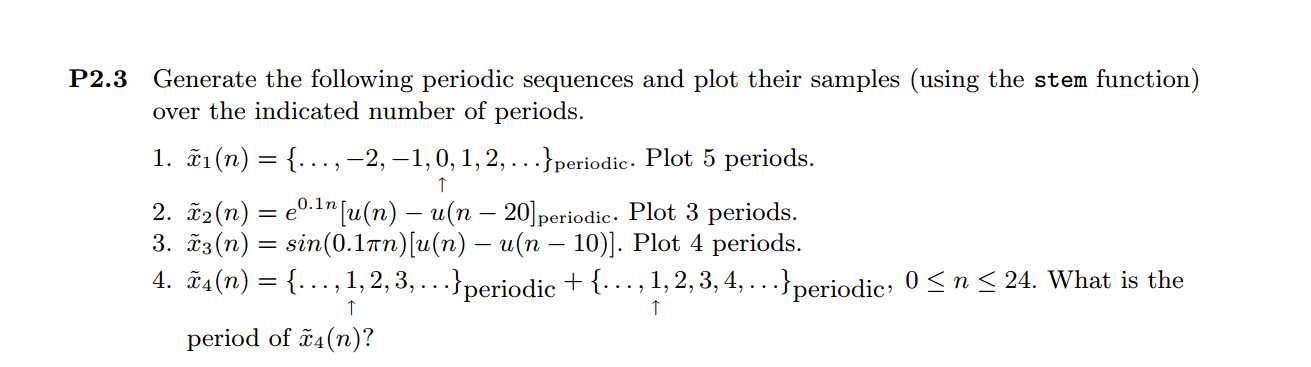
%% {...,-2,-1,0,1,2,...}
%% *
%% Plot 5 periods
self_length = 5;
periods = 5;
n = [-2:(2+(periods-1) * self_length)];x = [-2,-1,0,1,2];
xtilde = x‘ * ones(1,periods); xtilde = (xtilde(:))‘;
figure(‘NumberTitle‘, ‘off‘, ‘Name‘, ‘Problem 2.3.1‘);
set(gcf,‘Color‘,‘white‘);
stem(n,xtilde); title(‘Sequence in Problem 2.3.1‘);
xlabel(‘n‘); ylabel(‘xtilde(n)‘);grid on;
显示结果:
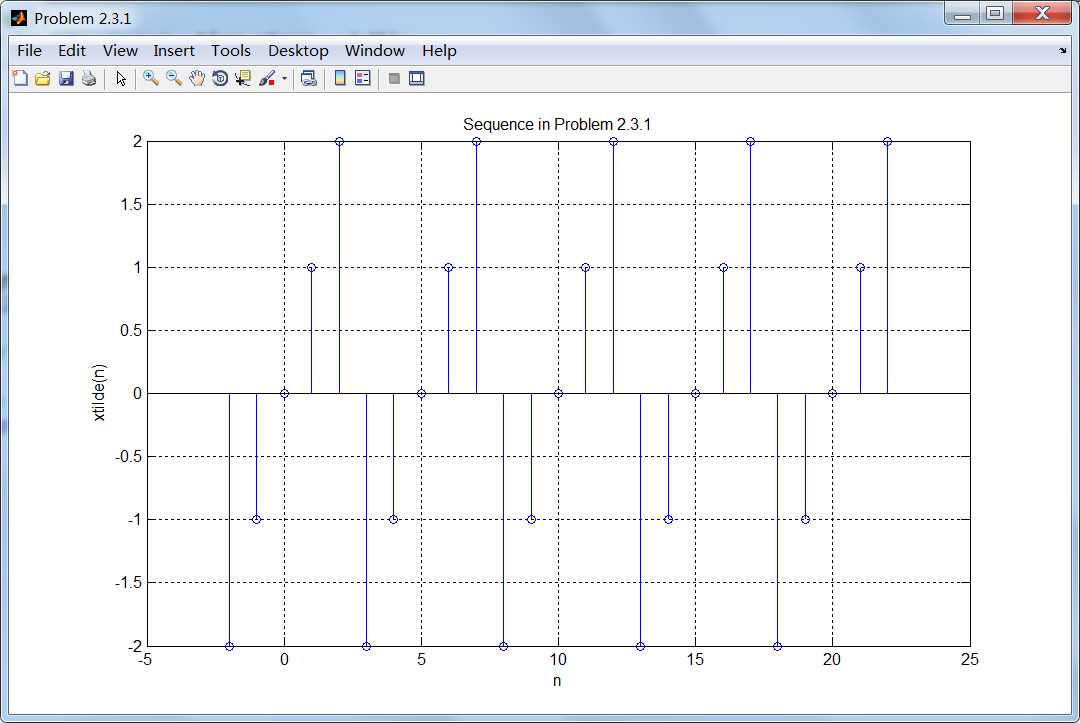
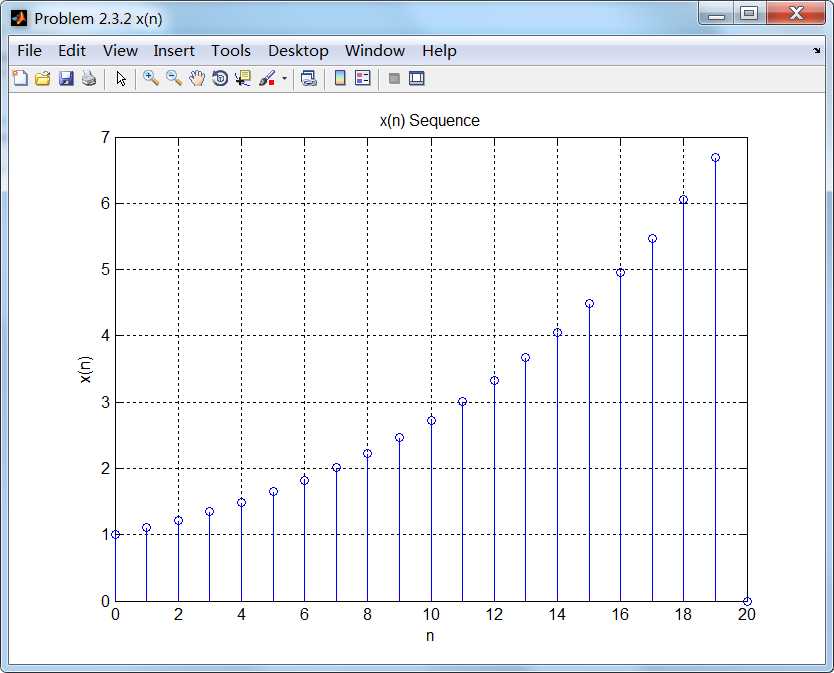
2、代码:
%% ------------------------------------------------------------------------
%%            Output Info about this m-file
fprintf(‘\n***********************************************************\n‘);
fprintf(‘        <DSP using MATLAB> Problem 2.3.2 \n\n‘);

time_stamp = datestr(now, 31);
[wkd1, wkd2] = weekday(today, ‘long‘);
fprintf(‘      Now is %20s, and it is %7s  \n\n‘, time_stamp, wkd2);
%% ------------------------------------------------------------------------

%%
%% exp(0.1n)[ u(n) - u(n-20)]     0-20 valid
%%
%% Plot 3 periods    [0;3*20-1]  [0,59]

n = [0:20];   % We can get self_periods=21 from here
x = exp(0.1*n) .* (stepseq(0,0,20) - stepseq(20,0,20));
%x = (stepseq(0,0,20) - stepseq(20,0,20));

figure(‘NumberTitle‘, ‘off‘, ‘Name‘, ‘Problem 2.3.2 x(n)‘);
set(gcf,‘Color‘,‘white‘);
stem(n,x); title(‘x(n) Sequence‘);
xlabel(‘n‘); ylabel(‘x(n)‘);grid on;

self_length = 21;
periods = 3;
n1 = [0:20 + (periods-1) * self_length];

xtilde = x‘ * ones(1,periods); xtilde = (xtilde(:))‘;

figure(‘NumberTitle‘, ‘off‘, ‘Name‘, ‘Problem 2.3.2‘);
set(gcf,‘Color‘,‘white‘);
stem(n1,xtilde); title(‘Sequence in Problem 2.3.2‘);
xlabel(‘n‘); ylabel(‘xtilde(n)‘);grid on;
运行结果:
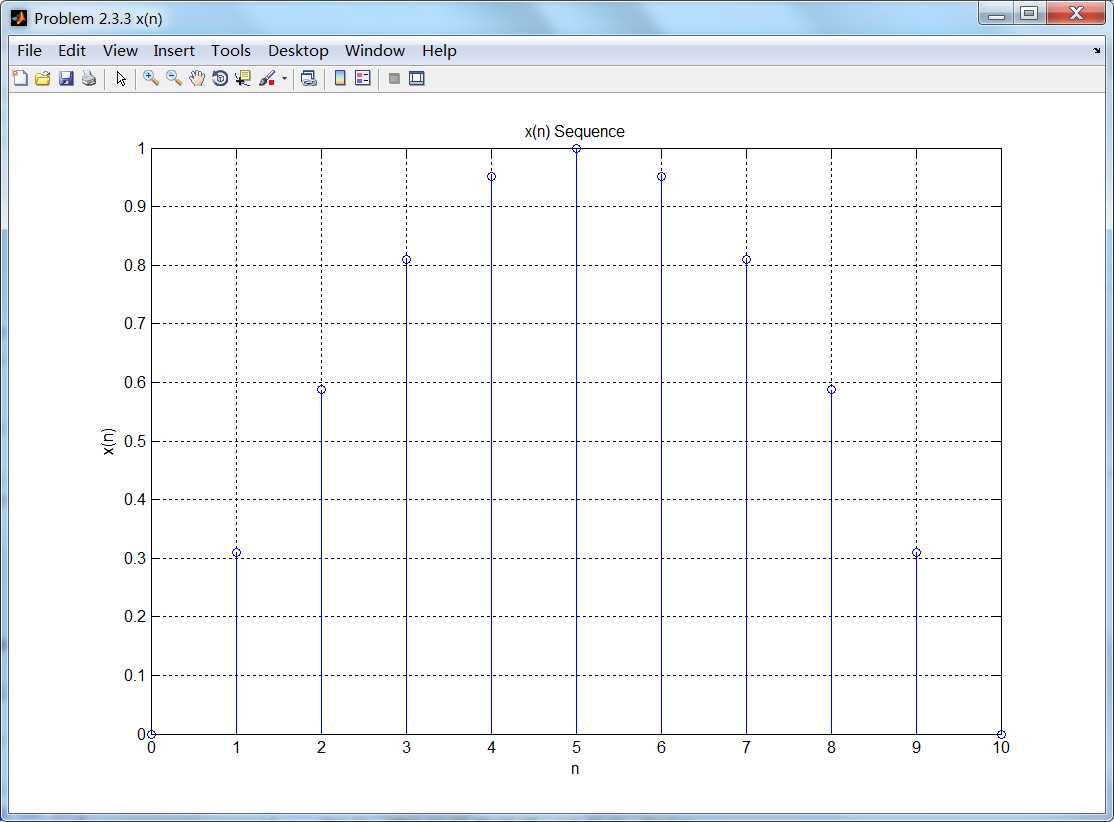
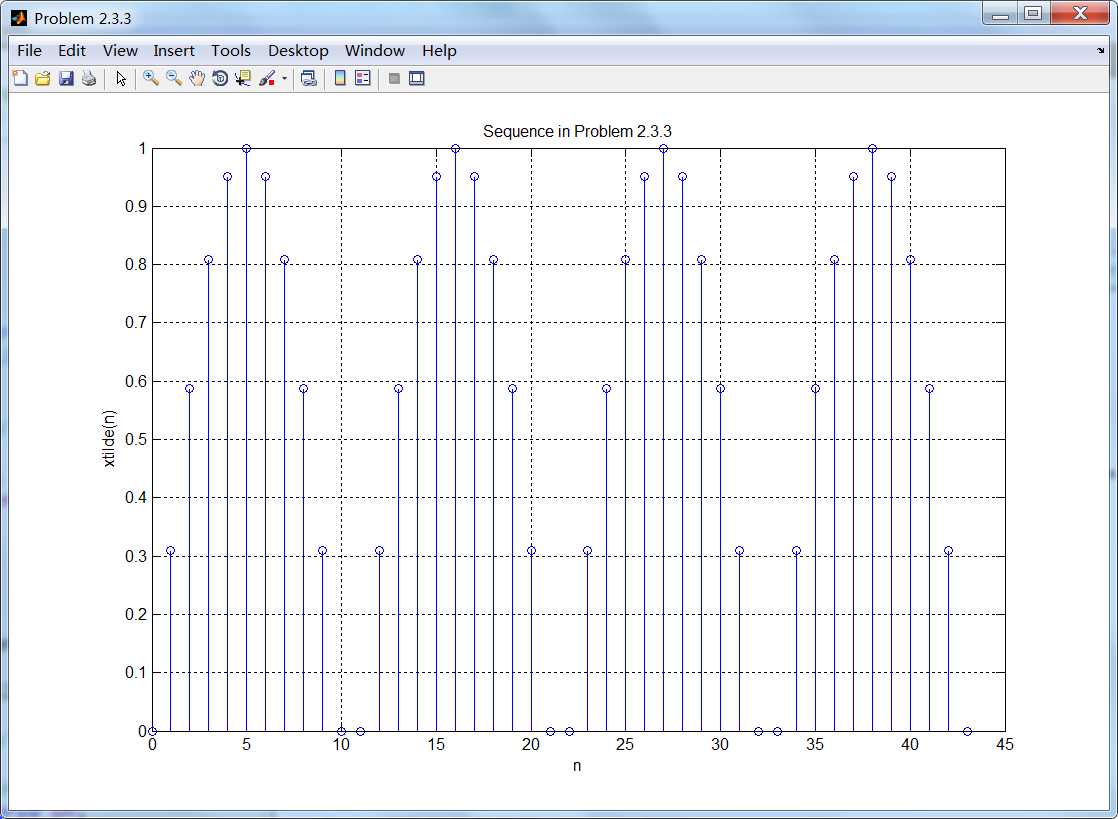
3、代码:
%% ------------------------------------------------------------------------
%%            Output Info about this m-file
fprintf(‘\n***********************************************************\n‘);
fprintf(‘        <DSP using MATLAB> Problem 2.3.3 \n\n‘);

time_stamp = datestr(now, 31);
[wkd1, wkd2] = weekday(today, ‘long‘);
fprintf(‘      Now is %20s, and it is %7s  \n\n‘, time_stamp, wkd2);
%% ------------------------------------------------------------------------


%%
%% sin(0.1*pi*n)[ u(n) - u(n-10)]     0-10 valid
%%
%% Plot 4 periods

n = [0:10];   % We can get self_periods=11 from here
x = sin(0.1*pi*n) .* (stepseq(0,0,10) - stepseq(10,0,10));


figure(‘NumberTitle‘, ‘off‘, ‘Name‘, ‘Problem 2.3.3 x(n)‘);
set(gcf,‘Color‘,‘white‘);
stem(n,x); title(‘x(n) Sequence‘);
xlabel(‘n‘); ylabel(‘x(n)‘);grid on;

self_length = 11;
periods = 4;
n1 = [0:10 + (periods-1) * self_length];

xtilde = x‘ * ones(1,periods); xtilde = (xtilde(:))‘;

figure(‘NumberTitle‘, ‘off‘, ‘Name‘, ‘Problem 2.3.3‘);
set(gcf,‘Color‘,‘white‘);
stem(n1,xtilde); title(‘Sequence in Problem 2.3.3‘);
xlabel(‘n‘); ylabel(‘xtilde(n)‘);grid on;
运行结果:
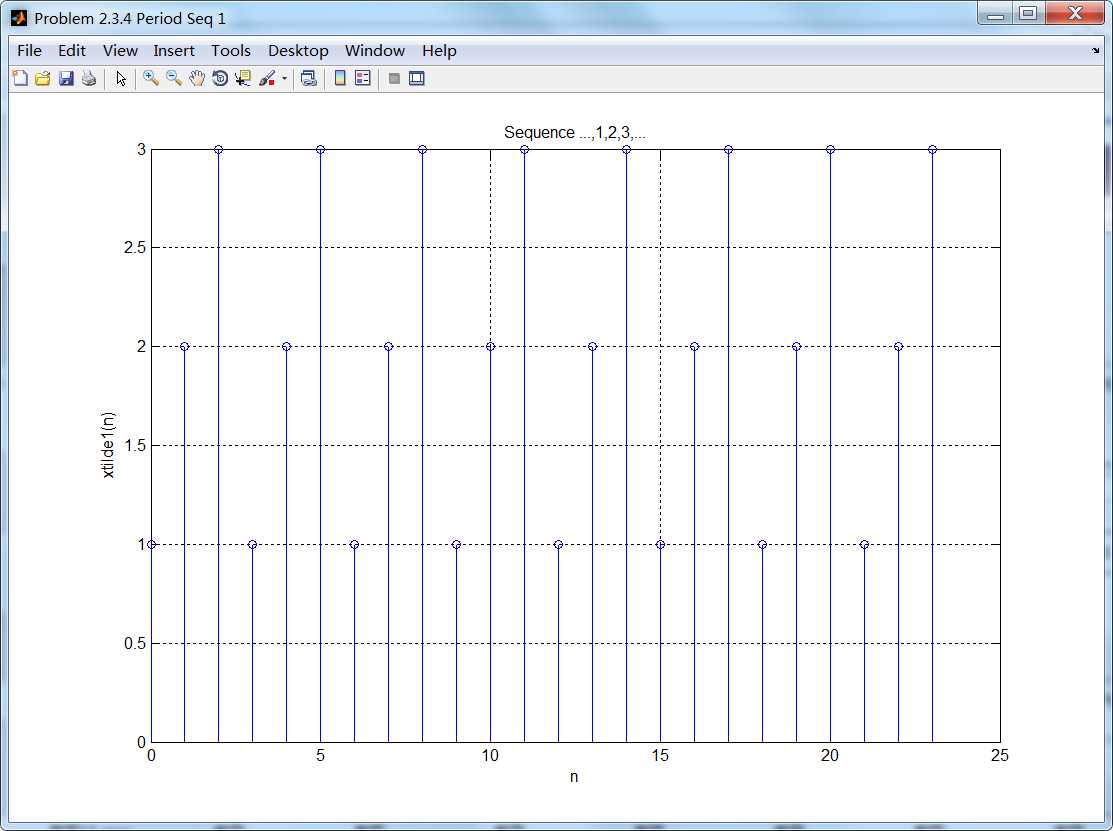
4、代码:
%% ------------------------------------------------------------------------
%% Output Info about this m-file
fprintf(‘\n***********************************************************\n‘);
fprintf(‘ <DSP using MATLAB> Problem 2.3.4 \n\n‘);
time_stamp = datestr(now, 31);
[wkd1, wkd2] = weekday(today, ‘long‘);
fprintf(‘ Now is %20s, and it is %7s \n\n‘, time_stamp, wkd2);
%% ------------------------------------------------------------------------
%%
%% {...,1,2,3,...} + {...,1,2,3,4,...} n=[0:24]
%% * *
%% what is the periods
self_length1 = 3;
periods1 = 8;
n1 = [0:(2+(periods1-1) * self_length1)];
x1 = [1, 2, 3];
xtilde1 = x1‘ * ones(1,periods1); xtilde1 = (xtilde1(:))‘;
figure(‘NumberTitle‘, ‘off‘, ‘Name‘, ‘Problem 2.3.4 Period Seq 1‘);
set(gcf,‘Color‘,‘white‘);
stem(n1,xtilde1); title(‘Sequence {...,1,2,3,...}‘);
xlabel(‘n‘); ylabel(‘xtilde1(n)‘);grid on;
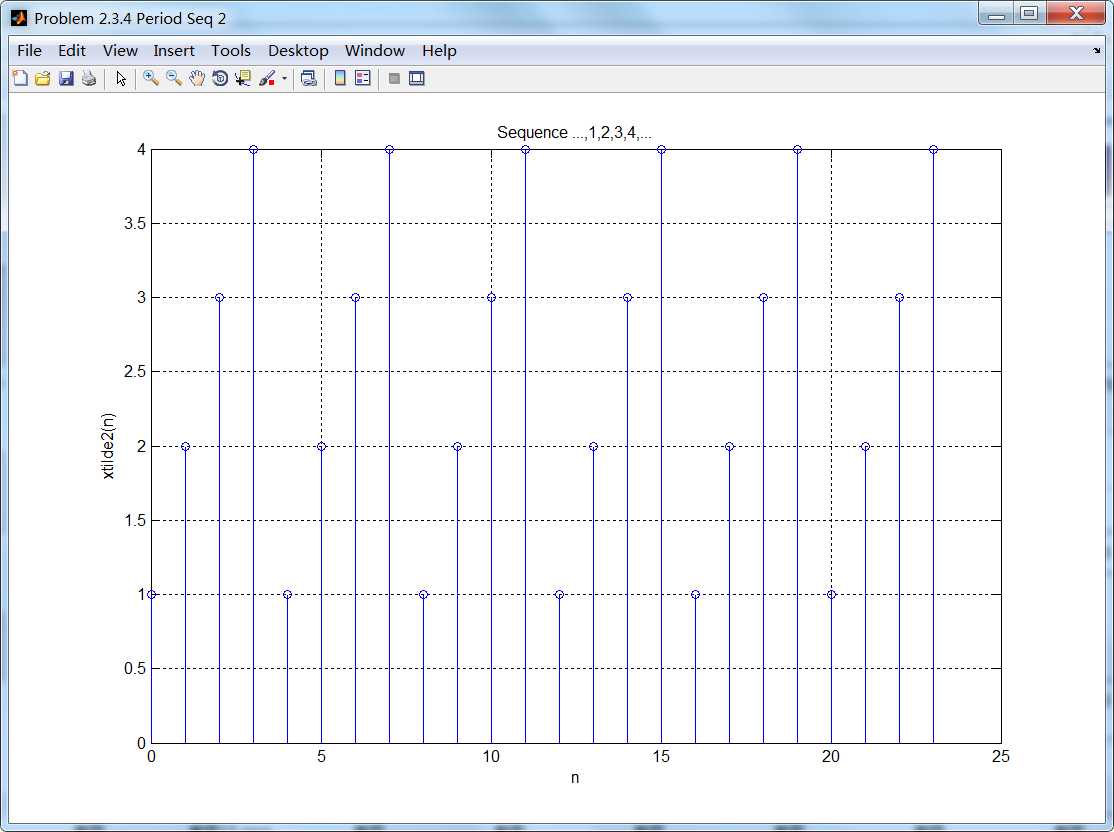
self_length2 = 4;
periods2 = 6;
n2 = [0:(3+(periods2-1) * self_length2)];
x2 = [1, 2, 3, 4];
xtilde2 = x2‘ * ones(1,periods2); xtilde2 = (xtilde2(:))‘;
figure(‘NumberTitle‘, ‘off‘, ‘Name‘, ‘Problem 2.3.4 Period Seq 2‘);
set(gcf,‘Color‘,‘white‘);
stem(n2,xtilde2); title(‘Sequence {...,1,2,3,4,...}‘);
xlabel(‘n‘); ylabel(‘xtilde2(n)‘);grid on;
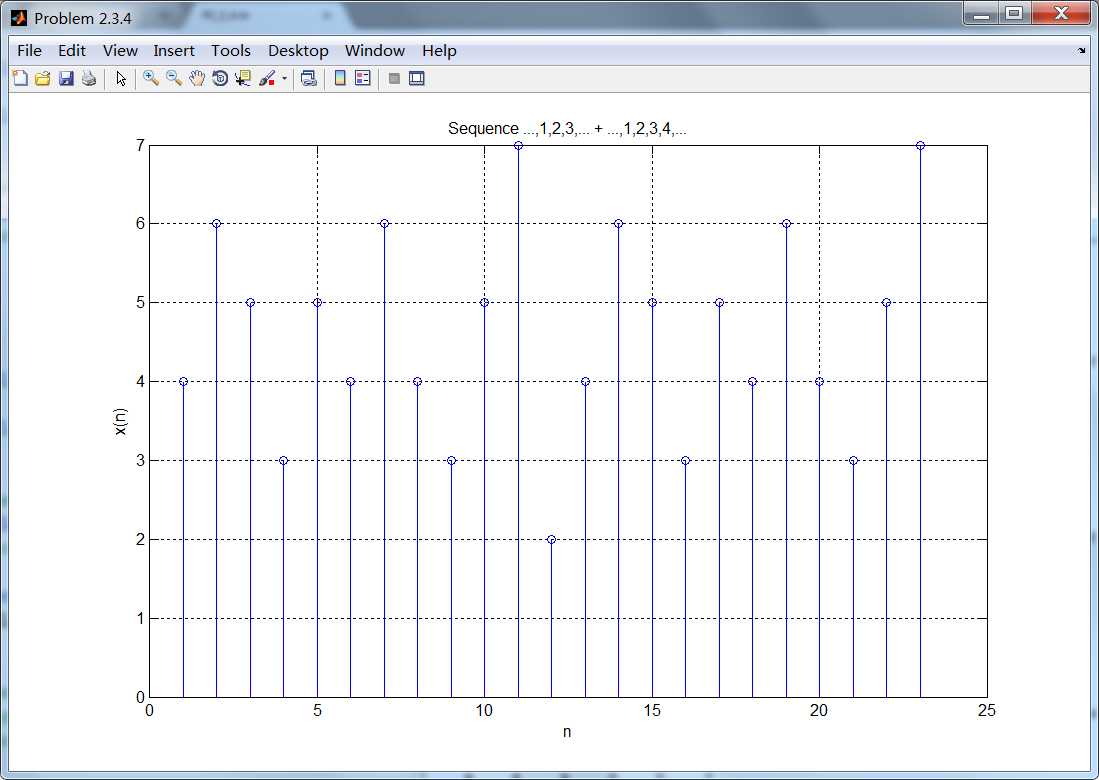
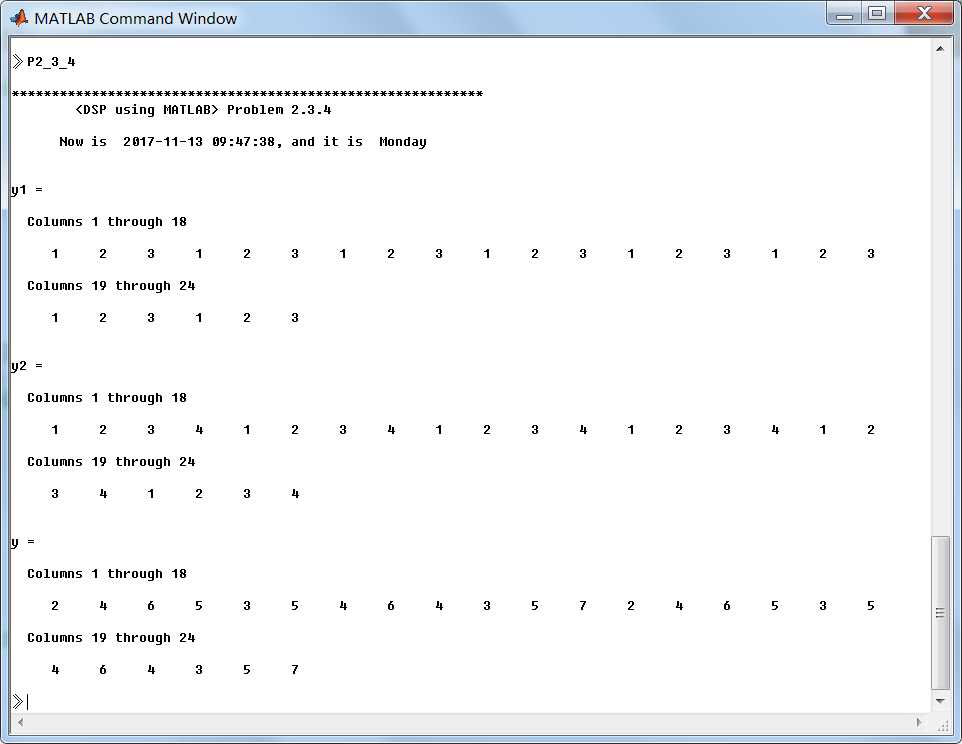
x = xtilde1 + xtilde2
%[x,n] = sigadd(xtilde1,24,xtilde2,24);
figure(‘NumberTitle‘, ‘off‘, ‘Name‘, ‘Problem 2.3.4‘);
set(gcf,‘Color‘,‘white‘);
stem(x); title(‘Sequence {...,1,2,3,...} + {...,1,2,3,4,...}‘);
xlabel(‘n‘); ylabel(‘x(n)‘);grid on;
运行结果:
《DSP using MATLAB》 Problem 2.3
标签:分享 3.3 number atl idt time self gad 运行
原文地址:http://www.cnblogs.com/ky027wh-sx/p/7856355.html